


Report Overview
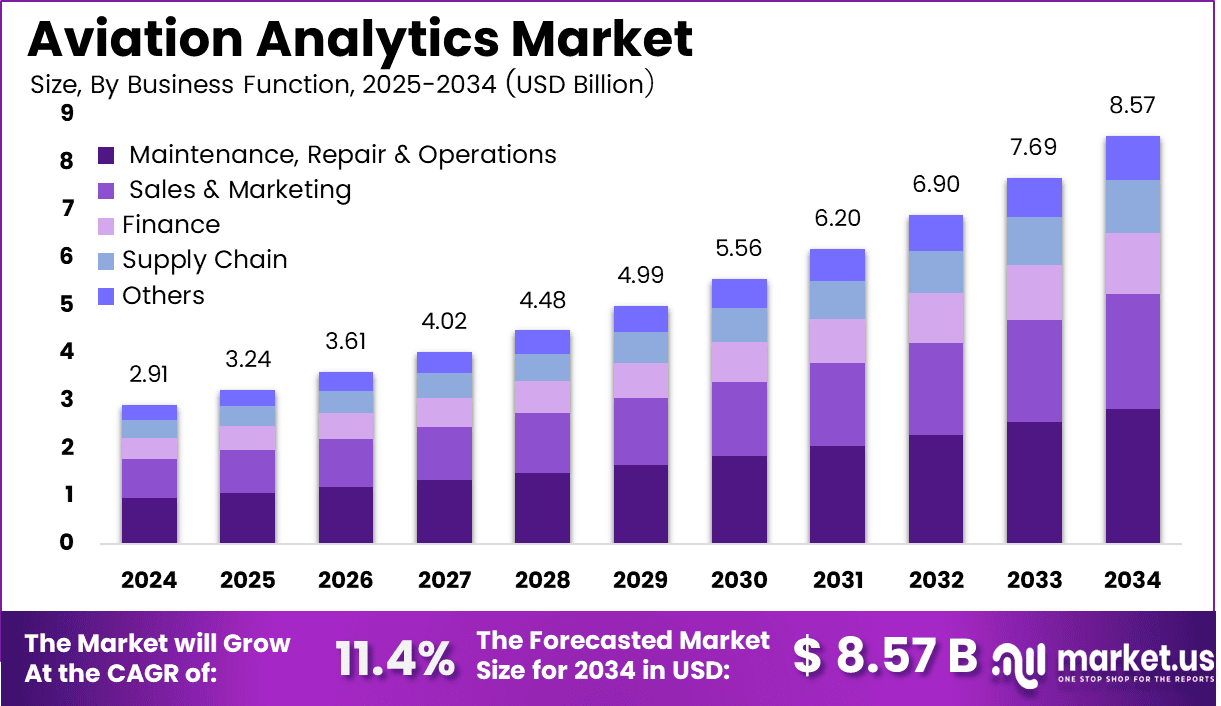
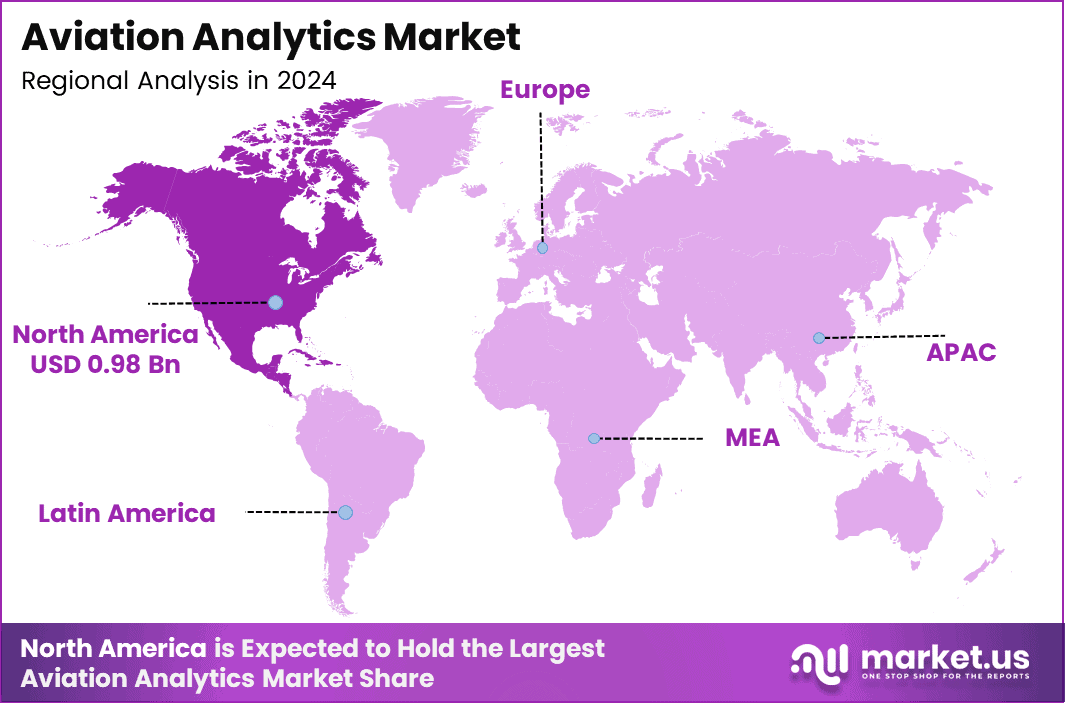
The Global Aviation Analytics Market reached USD 2.9 billion in 2024 and will reach USD 8.5 billion by 2034, growing at an 11.4% CAGR from 2025 to 2034. North America led the market with a 34% share and USD 0.99 billion in revenue during 2024.
Airlines and airports need analytics to manage larger passenger volumes, complex networks, fuel use, maintenance, pricing, and customer service. IATA expected airlines to carry 4.99 billion travelers and generate USD 979 billion in revenue during 2025. Passenger revenue alone reached an estimated USD 693 billion.
ACI World expects airport passenger traffic to reach 10.2 billion in 2026, up 3.9% from 2025. These operating volumes create billions of records from bookings, aircraft sensors, loyalty programs, cargo systems, and airport processes. Analytics platforms turn these records into demand forecasts, risk alerts, maintenance schedules, and pricing decisions.
North American region combines large airline networks, advanced airport systems, cloud infrastructure, and strong spending on artificial intelligence. ACI World forecasts 2.1 billion North American airport passengers for 2025. IATA reported that North American airlines increased annual traffic by 2.1% while capacity rose 2.4%.
Key Takeaways
- The Aviation Analytics Market stood at USD 2.9 billion in 2024 and will reach USD 8.5 billion by 2034. The market will grow at an 11.4% CAGR during 2025 to 2034.
- Software led the component segment with a 62.1% share.
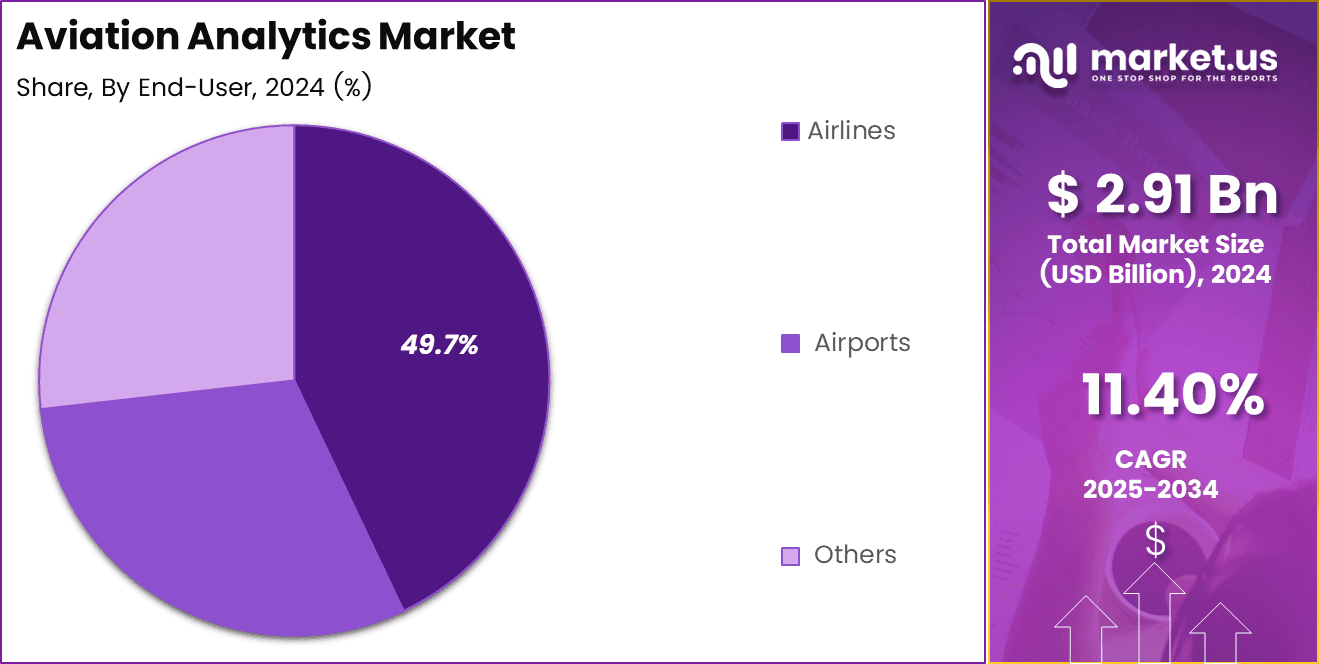
- Airlines led the end-user segment with a 49.7% share.
- Customer Analytics led the application segment with a 26.8% share.
- Maintenance, Repair and Operations led the business function segment with a 33.2% share.
- North America led with a 34% share and USD 0.99 billion in revenue.
By Component
Software dominates with 62.1% due to scalable control across complex aviation networks.
Software leads the component segment because airlines and airports require a unified view of flights, crews, aircraft, customers, and costs. SITA estimated that airlines spent $37 billion on IT in 2024, while airports spent $8.9 billion.
Software platforms support real-time data processing, risk detection, scheduling, and decision-making across large networks, while cloud access, artificial intelligence, and shared dashboards improve operational visibility.
Services are the fastest-growing sub-segment as aviation companies require support for system integration, cloud migration, cybersecurity, data management, and employee training. SITA reported that 74% of airlines and 72% of airports expected IT spending to increase over the next 2 years.
By Application
Customer Analytics dominates with 26.8% due to direct digital channels revealing passenger intent.
Customer analytics leads with a 26.8% share because passenger behavior directly affects ticket revenue, loyalty, and service costs. Airlines use booking history, search activity, trip purpose, and loyalty data to personalize fares and services.
IATA reported that 71% of passengers preferred online or app booking in 2024, while 53% preferred airline-owned digital channels. In addition, 79% preferred credit or debit cards, providing useful payment data for demand analysis and fraud detection.
Fuel Management is the fastest-growing application as airlines face volatile fuel costs and stricter emissions requirements. IATA expected sustainable aviation fuel production to reach 2 million tonnes in 2025, representing only 0.7% of total airline fuel use, while limited supply was estimated to add $4.4 billion to the global fuel bill.
By Business Function
Maintenance, Repair and Operations dominates with 33.2% due to safety checks demanding continuous asset insight.
Maintenance, Repair and Operations leads with a 33.2% share because aircraft safety and availability depend on timely maintenance. Analytics supports failure prediction, maintenance scheduling, labor planning, and repair records. Boeing expects the commercial fleet to exceed 50,000 aircraft by 2045 and forecasts around 44,000 new aircraft deliveries over 20 years.
It also projects demand for 710,000 new maintenance technicians through 2044, increasing the need for analytics to help maintenance teams prioritize critical tasks. Sales and Marketing is the fastest-growing function as airlines increasingly use analytics for personalized pricing, offers, loyalty programs, and ancillary services.
An IATA survey of more than 150 airline executives found that 81% of their airlines had adopted New Distribution Capability. IATA also reported participation from 73 airlines and 100 technology providers and other firms in its retailing maturity program, supporting wider adoption of data-driven airline retailing and digital sales.
By End-User
Airlines dominate with 49.7% due to constant pricing and fleet planning needs.
Airlines lead the end-user segment with a 49.7% share because they rely on analytics for pricing, route planning, aircraft allocation, crew management, delay prediction, and personalized services. IATA reported that global passenger demand increased by 5.3% in 2025, while the industry load factor reached a record 83.6%.
High aircraft utilization increases the need for accurate data to protect revenue, improve operations, and reduce disruption costs. Airports are the fastest-growing end-user segment as rising passenger volumes increase pressure on terminals, gates, baggage systems, security, and ground operations.
ACI World expects global airport traffic to reach 18.8 billion passengers by 2045, supported by annual growth of 3.4%. Airports are therefore adopting sensors, smart gates, digital identity, and real-time analytics to increase capacity, improve passenger flow, and make better use of existing infrastructure.
Key Market Segments
By Component
- Service
- Software
By End-User
- Airlines
- Airports
- Others
By Application
- Customer Analytics
- Flight Risk Management
- Inventory Management
- Fuel Management
- Revenue Management
- Others
By Business Function
- Maintenance, Repair and Operations
- Sales and Marketing
- Finance
- Supply Chain
- Others
Geopolitical Impact Analysis
Trade disputes raise the cost of the computing equipment that supports aviation analytics. Airlines, airports, and analytics vendors rely on servers, network devices, storage systems, sensors, and maintenance terminals that contain semiconductors, steel, aluminum, and copper. In 2025, the United States introduced a 20% additional tariff on imports from China and a 25% tariff on steel and aluminum from several countries.
Later policy changes raised steel and aluminum duties by 50 percentage points. These measures increase data center construction costs and hardware replacement prices. Vendors can respond by extending equipment life, shifting workloads to public clouds, or sourcing components from several countries. However, those actions add integration, cybersecurity, and compliance costs.
The WTO expected world merchandise trade volume to decline by 0.2% in 2025 under the tariff conditions it assessed in April. Weaker trade also reduces air cargo activity, which can slow demand for cargo forecasting and revenue analytics. Conflict around the Red Sea also disrupts the physical delivery of servers, sensor equipment, airport systems, and aircraft maintenance components.
UNCTAD found that rerouting a Shanghai to Rotterdam voyage around the Cape of Good Hope added 12 sailing days, increased transit time by about 30%, and reduced effective global container capacity by about 9%. Suez Canal trade volume fell 42%, while weekly container ship transits dropped 67%. These delays can push aviation companies to hold more spare hardware and use predictive inventory tools.
Energy volatility adds another layer of demand. The World Bank expected its energy price index to fall 12% in 2025 and another 10% in 2026, with Brent crude averaging USD 68 per barrel and USD 60 per barrel, respectively. Rapid fuel price changes strengthen the business case for fuel optimization, route analysis, and scenario planning software.
Regional Analysis
North America dominates the Aviation Analytics Market, holding a 34% share and generating USD 0.99 billion in revenue. The United States supports this position through a large commercial fleet, busy airports, major cloud providers, aircraft manufacturers, and enterprise software companies.
IATA projected that North American airlines would earn USD 11.3 billion in net profit during 2026, equal to USD 9.80 per passenger. This level of earnings gives carriers room to fund revenue management, customer analysis, disruption control, and predictive maintenance tools.
Asia Pacific offers a strong growth opportunity, although the DATA INPUT BLOCK does not formally identify it as the fastest-growing region. China handled 770.1 million airline passenger trips and 10.17 million tonnes of cargo and mail in 2025, increases of 5.5% and 13.3%. Its commercial airports processed 1.529 billion passenger movements.
US Market Size
The US Aviation Analytics Market was valued at USD 0.89 billion in 2024 and is projected to reach USD 2.23 billion by 2034, growing at a CAGR of 9.6% during the forecast period (2025–2034). The consistent rise in demand for real-time operational insights, predictive maintenance, and data-driven decision-making is fueling market growth. Increasing adoption of AI, machine learning, and IoT in aircraft systems is enhancing safety, optimizing fuel consumption, and improving overall operational efficiency.
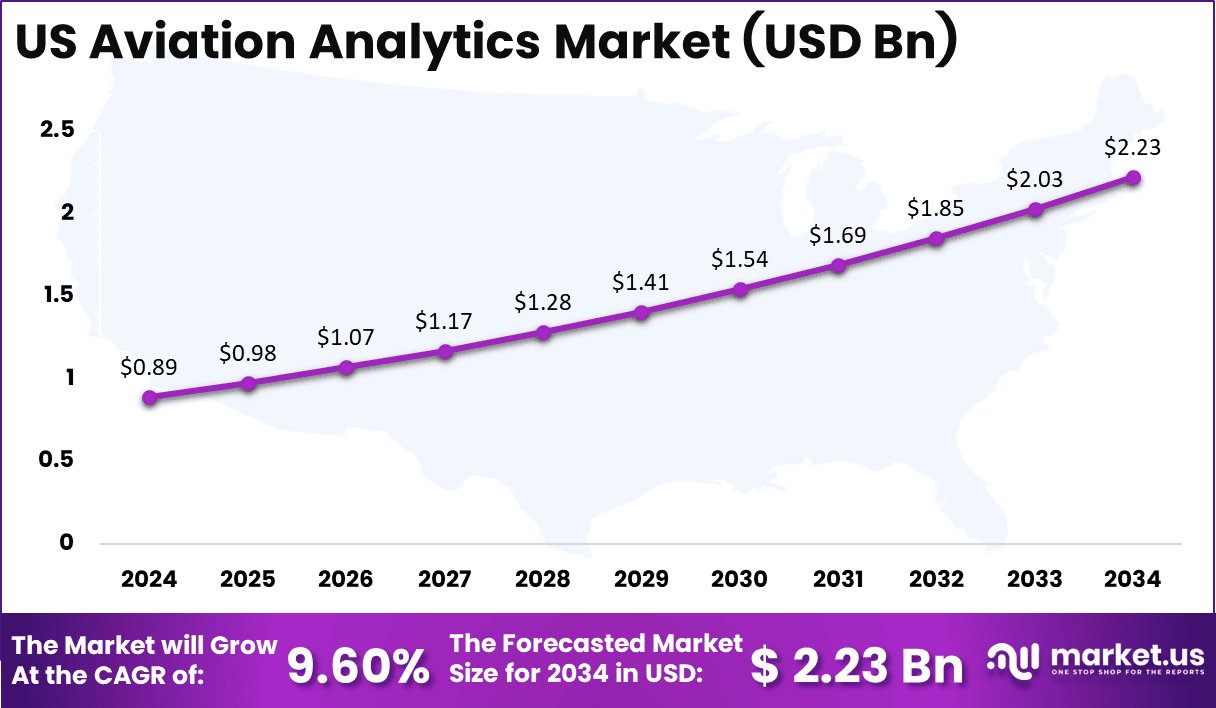
The Aviation Analytics Market is expected to add over USD 1.34 billion in new value, reflecting the aviation sector’s shift toward digital transformation. The integration of advanced analytics tools in flight management, passenger services, and maintenance scheduling continues to strengthen the competitive positioning of airlines and airports across the US.
Key Regions and Countries
North America
- US
- Canada
Europe
- Germany
- France
- The UK
- Spain
- Italy
- Rest of Europe
Asia Pacific
- China
- Japan
- South Korea
- India
- Australia
- Rest of APAC
Latin America
- Brazil
- Mexico
- Rest of Latin America
Middle East and Africa
- GCC
- South Africa
- Rest of MEA
Market Dynamics
Drivers
| Driver | (~) % Impact on CAGR Forecast | Geographic Relevance | Impact Timeline |
|---|---|---|---|
| Predictive maintenance analytics adoption | +2.8% | North America, Europe | Short term (2 years or less) |
| Rising global air traffic recovery | +2.1% | Asia-Pacific, Middle East | Short term (2 years or less) |
| Fleet digitization and IoT sensor proliferation | +1.6% | Global | Medium term (2 to 4 years) |
| Airline cost-optimization mandates post-pandemic recovery | +1.2% | Europe, North America | Short term (2 years or less) |
| Smart airport operational analytics rollout | +1.0% | Middle East, Asia-Pacific | Medium term (2 to 4 years) |
| MRO digital transformation initiatives | +0.7% | Global | Medium term (2 to 4 years) |
Predictive maintenance analytics adoption reshapes airline procurement economics
Predictive maintenance is becoming a major aviation analytics driver as onboard IoT sensors and machine-learning-based Remaining Useful Life models expanded commercially during 2024–2025. Continuous aircraft telemetry allows airlines and MRO providers to identify possible engine, avionics, and component failures before they result in aircraft-on-ground events. This supports higher dispatch reliability, shorter maintenance turnaround times, and better use of maintenance teams and spare parts.
Restraints
| Restraint | (~) % Impact on CAGR Forecast | Geographic Relevance | Impact Timeline |
|---|---|---|---|
| Fragmented cross-border data protection laws | -1.9% | Global | Short term (2 years or less) |
| High capital cost for legacy carrier IT overhaul | -1.4% | Latin America, Africa | Short term (2 years or less) |
| Elevated interest rates delaying analytics CapEx | -1.1% | North America, Europe | Short term (2 years or less) |
| Restrictive export controls on avionics data systems | -0.8% | Asia-Pacific, Middle East | Medium term (2 to 4 years) |
| Airline balance sheet constraints post-fuel price shocks | -0.6% | Global | Short term (2 years or less) |
Fragmented data protection regimes freeze cross-border analytics deployment
The structural bottleneck stems from over 160 countries maintaining independently developed data protection statutes, as documented by IATA data protection and privacy monitoring, which forces airlines operating interline and codeshare networks to build jurisdiction-specific data residency architectures before any single global analytics platform can process Passenger Name Record or flight-operations data at scale.
Challenges
| Challenge | (~) % CAGR Friction Drag | Geographic Relevance | Mitigation Horizon |
|---|---|---|---|
| Aviation data science talent shortage | -1.3% | Global | Medium term (2 to 4 years) |
| Legacy avionics data integration complexity | -1.0% | Global | Medium term (2 to 4 years) |
| Cybersecurity risk in connected fleet networks | -0.9% | North America, Europe | Medium term (2 to 4 years) |
| Semiconductor and sensor component lead times | -0.7% | Asia-Pacific | Short term (2 years or less) |
| Data standardization gaps across OEM platforms | -0.6% | Global | Long term (4 years or more) |
Talent scarcity constrains scaling of aviation-specific analytics teams
The underlying vulnerability is a persistent shortfall of engineers combining aerospace domain knowledge with applied machine-learning skills, a gap that workforce data referenced in national labor statistics agencies and aerospace manufacturing association surveys estimates in the tens of thousands globally, since traditional data-science graduates typically lack certification-grade familiarity with airworthiness directives and ARINC data standards.
Opportunities
| Opportunity | (~) % Potential CAGR Upside | Geographic Relevance | Execution Window |
|---|---|---|---|
| AI-driven sustainable aviation fuel optimization analytics | +2.2% | Europe, North America | Medium term (2 to 4 years) |
| Embedded analytics monetization via usage-based pricing | +1.5% | Global | Medium term (2 to 4 years) |
| M&A roll-up of fragmented regional analytics vendors | +1.1% | Asia-Pacific, Latin America | Long term (4 years or more) |
| Adjacent expansion into urban air mobility analytics | +0.9% | North America, Asia-Pacific | Long term (4 years or more) |
| Untapped low-cost carrier analytics penetration | +0.7% | Africa, Southeast Asia | Medium term (2 to 4 years) |
Sustainable fuel optimization analytics represent unexploited white space beyond current adoption
This is classified as untapped white space rather than a current driver because, unlike predictive maintenance which already has broad contractual penetration, fuel-burn and emissions optimization analytics tied to sustainable aviation fuel blending remain confined largely to pilot programs at a handful of carriers, with ICAO CORSIA compliance deadlines and EU emissions trading scheme phase-ins through the remainder of this decade creating a deliberate future action window rather than an active revenue stream today.
Key Players Analysis
Tier 1 market leaders include General Electric, IBM Corporation, Oracle Corporation, SAP SE, and SAS Institute. GE Aerospace generated USD 45.9 billion in 2025 revenue, including USD 30.2 billion from services. It funded USD 1.58 billion of research and development directly, while customers and partners contributed another USD 1.41 billion. This scale supports aircraft health monitoring, maintenance forecasting, and fleet service analytics.
IBM reported USD 67.5 billion in 2025 revenue and spent USD 8.32 billion on research and development. Its USD 6.4 billion HashiCorp acquisition added infrastructure automation tools that support secure aviation cloud systems. Oracle generated USD 57.4 billion in fiscal 2025 revenue and invested USD 9.9 billion in research and development.
Its database, cloud, finance, and customer platforms support airline revenue, airport operations, and enterprise analysis. SAP reported 23% cloud revenue growth in 2025 and ended the year with a EUR 77 billion total cloud backlog. SAP also committed more than EUR 1 billion to scale Prior Labs and its structured-data artificial intelligence technology. These figures place Oracle and SAP among the strongest enterprise platform competitors.
Tier 2 challengers include Accelya, IGT Solutions, MU Sigma, OAG Aviation Worldwide, and Ramco Systems. Accelya supports more than 200 airlines, processes over 30 billion offers each day, and settles more than USD 100 billion annually. Ramco Systems recorded quarterly revenue of USD 20.29 million in its second fiscal quarter of 2026.
Top Key Players in the Market
- Accelya
- General Electric
- IBM Corporation
- IGT Solutions Pvt. Ltd.
- MU Sigma
- OAG Aviation Worldwide Limited
- Oracle Corporation
- Ramco Systems
- SAP SE
- SAS Institute Inc.
Recent Developments
- In February 2025, IBM completed its acquisition of HashiCorp for USD 35 per share in cash, representing an enterprise value of USD 6.4 billion and adding cloud infrastructure automation capabilities.
- In March 2025, L3Harris Technologies completed the sale of its Commercial Aviation Solutions business to an affiliate of TJC for USD 800 million in cash.
- In April 2025, Boeing agreed to sell its Jeppesen, ForeFlight, AerData, and OzRunways digital aviation assets to Thoma Bravo for USD 10.55 billion in cash.
- In August 2025, AAR acquired aviation maintenance planning software provider Aerostrat for USD 15 million, plus contingent consideration of up to USD 5 million.
- In July 2026, SAP completed its acquisition of Prior Labs and committed more than EUR 1 billion over four years to expand its structured-data artificial intelligence operations.
Report Scope
| Report Features | Description |
|---|---|
| Market Value (2024) | USD 2.9 billion |
| Forecast Revenue (2034) | USD 8.5 billion |
| CAGR (2025-2034) | 11.4% |
| Base Year for Estimation | 2024 |
| Historic Period | 2020-2023 |
| Forecast Period | 2025-2034 |
| Report Coverage | Revenue Forecast, Market Dynamics, Competitive Landscape, Recent Developments |
| Segments Covered | By Component (Service, Software); By End-User (Airlines, Airports, Others); By Application (Customer Analytics, Flight Risk Management, Inventory Management, Fuel Management, Revenue Management, Others); By Business Function (Maintenance, Repair and Operations, Sales and Marketing, Finance, Supply Chain, Others) |
| Regional Analysis | North America – US, Canada; Europe – Germany, France, The UK, Spain, Italy, Rest of Europe; Asia Pacific – China, Japan, South Korea, India, Australia, Singapore, Rest of APAC; Latin America – Brazil, Mexico, Rest of Latin America; Middle East & Africa – GCC, South Africa, Rest of MEA |
| Competitive Landscape | Accelya, General Electric, IBM Corporation, IGT Solutions Pvt. Ltd., MU Sigma, OAG Aviation Worldwide Limited, Oracle Corporation, Ramco Systems, SAP SE, SAS Institute Inc. |
| Customization Scope | Customization for segments, region/country-level will be provided. Moreover, additional customization can be done based on the requirements. |
| Purchase Options | We have three licenses to opt for: Single User License, Multi-User License (Up to 5 Users), Corporate Use License (Unlimited Users and Printable PDF) |





































