
Quick Navigation
Report Overview
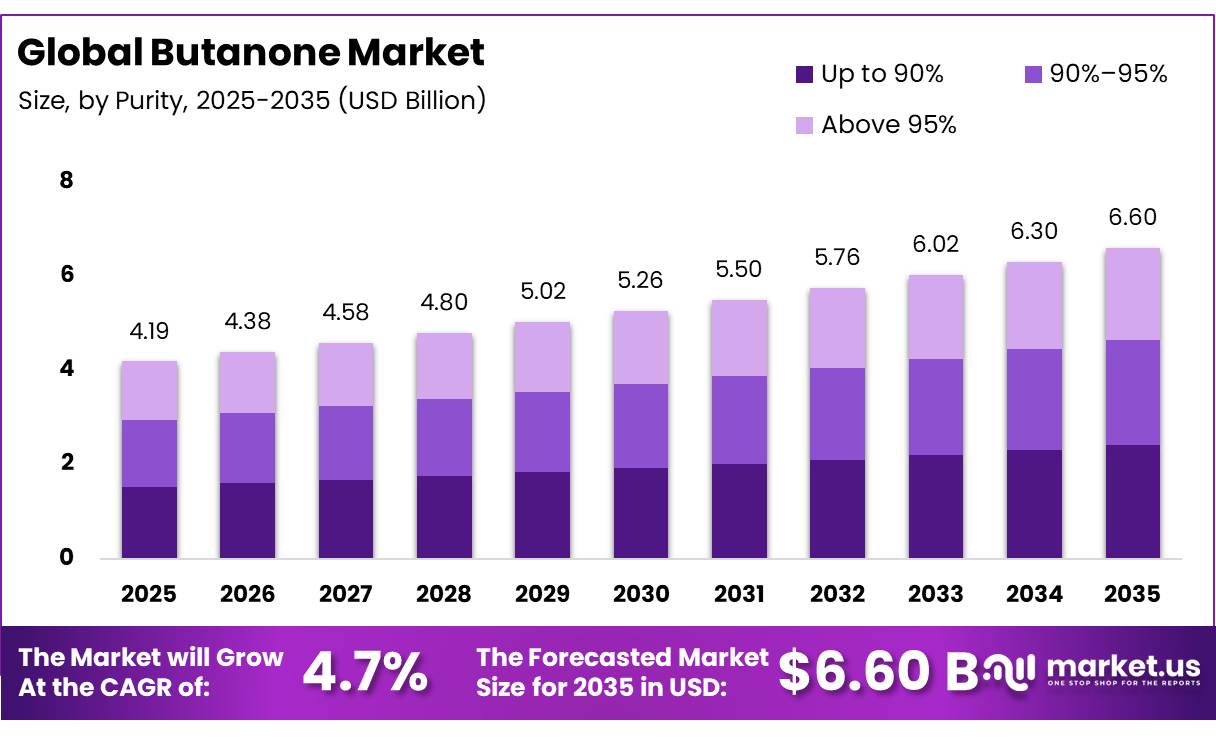
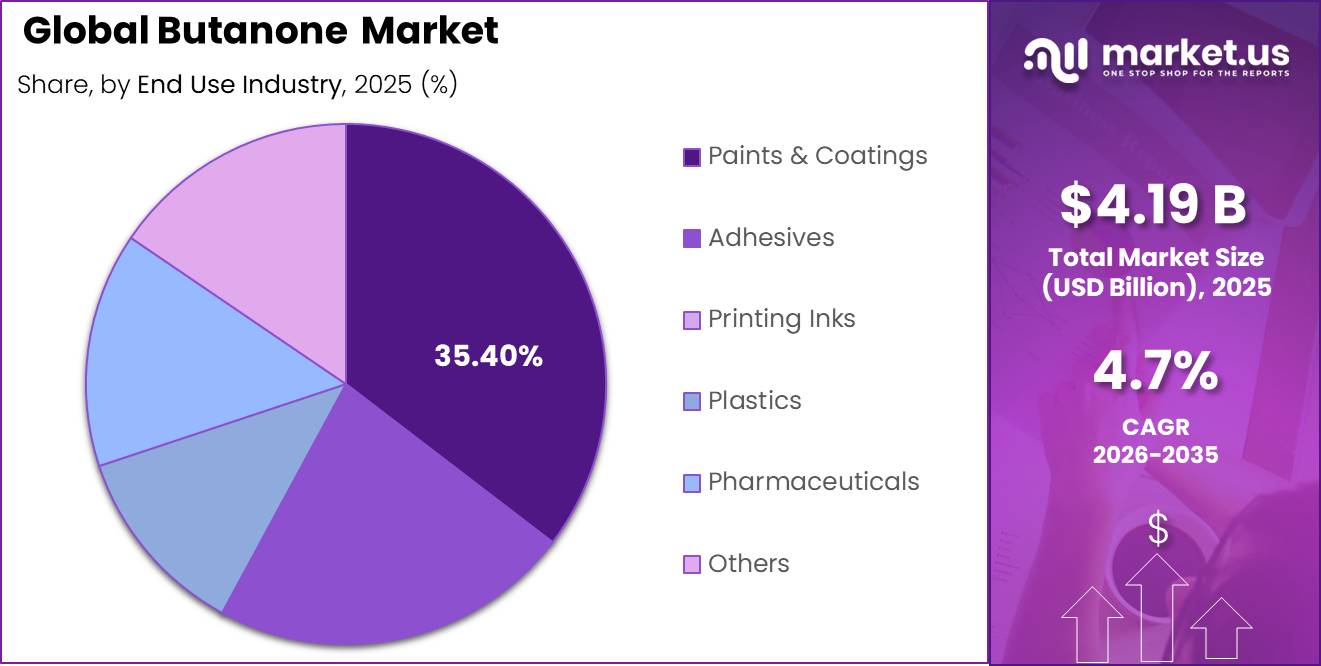
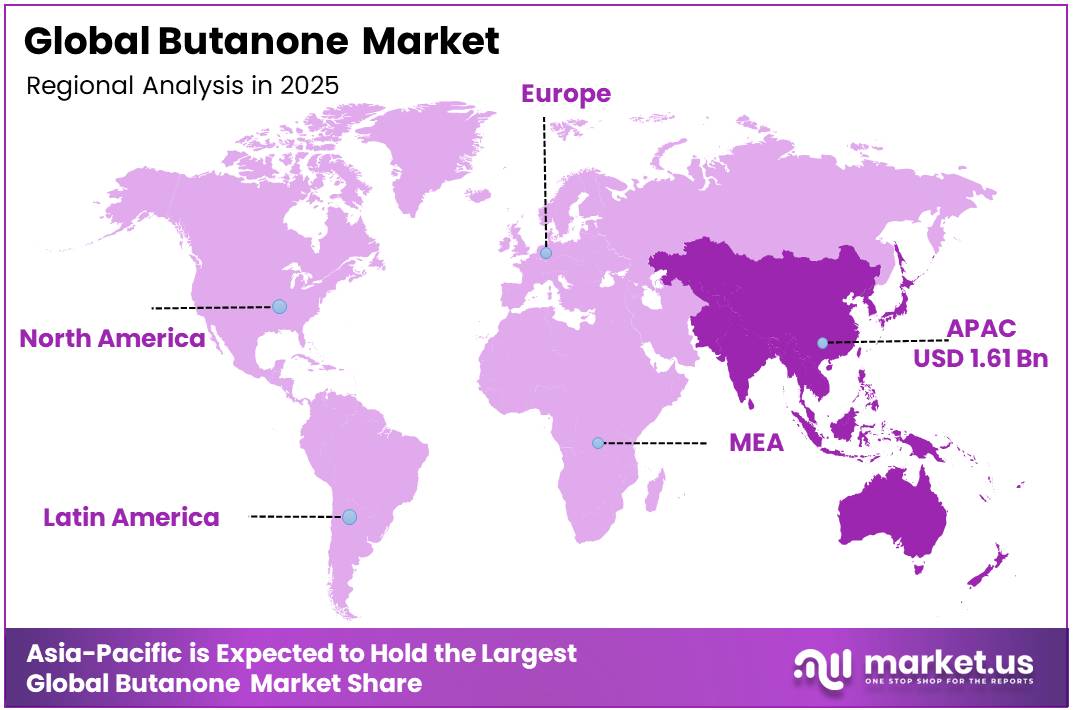
In 2025, the global Butanone Market was valued at USD 4.19 billion, and between 2026 and 2035, this market is estimated to register a CAGR of 4.70%, reaching about USD 6.60 billion by 2035. In 2025, Asia Pacific led the market, achieving over 38.50% share with a revenue of USD 1.61 Billion.
The global butanone (methyl ethyl ketone) market is a significant component of the industrial solvents sector, with deep integration into manufacturing ecosystems. The chemical is primarily used as a high-efficiency solvent, with fast evaporation rates and excellent solubility for surface coatings, adhesives, and printing inks. The Asia-Pacific area has the world’s highest consumption and production volume, driven by booming automotive and construction industries. The usual industrial synthesis pathway is based mostly on the dehydrogenation of secondary butyl alcohol or the liquid-phase oxidation of n-butene.
- UN Comtrade-based trade data for HS 291412 confirms that butanone, or methyl ethyl ketone, remains an actively traded industrial solvent in global chemical markets. In 2024, global export value was reported at around USD 637.19 million, while global import value reached about USD 670.35 million. These trade flows reflect continued cross-border demand from coatings, adhesives, printing inks, and industrial chemical applications.
Key Takeaways
- The global Butanone Market was valued at USD 4.19 billion in 2025.
- The global Market is projected to grow at a CAGR of 4.70% and is estimated to reach USD 6.60 billion by 2035.
- The market segment for butanone with a purity level Up to 90% emerges as the leading category, accounting for a plurality share of 36.50% of the total market distribution.
- By Grade: Urethane Grade products command the majority of the market volume, establishing a strong clear lead over alternative options with a 57.40% share.
- The Synthetic product type heavily dictates market supply, generating roughly two-thirds of the total market activity at 65.00%.
- The Paints & Coatings sector functions as the primary economic engine for the industry, consuming a dominant 35.40% share of the total market consumption.
- The Asia Pacific region exhibits immense market concentration, securing a commanding regional footprint of 38.50%.
Rapid industrial decarbonisation appears as the fastest-growing demand factor, requiring chemical makers to improve production energy efficiency. Advanced manufacturing facilities increasingly use artificial intelligence (AI) networks to automate predictive maintenance, optimize feedstock use, and control real-time synthesis factors. AI integration reduces operational downtime while balancing manufacturing capacity against variable global demand fluctuations.
Butanone Market Segment
Purity Analysis
Up to 90% represents dominant Segment in the Market.
Up to 90% Purity held a market-leading 36.50% share. This dominance is driven by the sheer scale of primary downstream applications in which tiny fractional contaminants comprising trace secondary alcohols or comparable structural alkanes do not impair final performance attributes. The primary driver of this segment’s market dominance is the fundamental cost-to-performance matrix in large-scale industrial washing and formulation. Higher fraction purification necessitates multiple, energy-intensive distillation columns, which increase the operational thermal load and processing time.
The 90%-95% purity segment is expected to exhibit the highest compound growth velocity over the 2026-2035 forecast period, surpass progressive market valuation milestones, and reach a multi-million dollar peak by 2035 as intermediate chemical processors upgrade from lower-tier grades to achieve tighter quality baselines without incurring extreme ultra-pure capital costs.
Grade Analysis
Urethane Grade segment is most widely used grade in market
Urethane Grade held the market’s largest share at 57.40% in 2025. This dominance stems from the strict engineering requirement for ultra-low moisture characteristics in solvents employed with reactive isocyanate chemicals. The key driver of this segment’s leadership is the global expansion of the premium vehicle production and building insulation industries. To meet rigorous specification limits, urethane-grade butanone is subjected to intense moisture-stripping methods.
The premium and specialty grade segment represents an emerging technological frontier that is expected to reach critical adoption milestones between 2030 and 2035, with rapid expansion as niche industries demand tailored chemical profiles for applications such as advanced biomaterial synthesis, aerospace coatings, and high-purity laboratory diagnostic reagents.
Product Type Analysis
Synthetic Product Are the Most Widely Used in market.
Synthetic Butanone dominated the market, accounting for 65%. This supremacy is fueled by the large, highly efficient infrastructure of global petrochemical complexes that use traditional n-butene and secondary butyl alcohol feedstocks. The integrated refineries in large industrial hubs use continuous-flow dehydrogenation technologies to produce high-volume, consistent streams of synthetic butanone. This developed network provides a trustworthy supply chain to meet the vast raw material demands of the worldwide chemical processing industry.
The natural and bio-based butanone segment is expected to have the highest compound growth rate between 2026 and 2035. It is poised to achieve significant value milestones as global chemical supply chains try to lessen their carbon footprint. Major market upheavals are projected by 2035, when global consumer brands replace fossil-fuel-derived solvents with bio-derived alternatives in product formulations. The key drivers of this rapid expansion are international decarbonisation standards and stringent corporate net-zero sustainability targets.
End Use Analysis
Butanone Are Mostly Utilized in the Paints and Coatings Sector.
Paints and coatings dominated the market, accounting for 35.40%. Butanone’s remarkable resin-dissolving capabilities, as well as its quick evaporation kinetics, contribute to its dominance in liquid formulation technologies. For example, high-solids industrial paints, automobile refinish lacquers, and marine protective coatings all rely significantly on this solvent to produce uniform layer formation and proper viscosity.
The pharmaceuticals and electronics manufacturing segment represents a highly advanced, future-oriented application space with key milestones expected between 2030 and 2035, seeing a surge in specialized butanone usage as a processing solvent. For instance, micro-circuitry component production and active pharmaceutical ingredient (API) extraction will increasingly rely on this versatile chemical intermediate.
Key Market Segments
By Purity
- Up to 90%
- 90%–95%
- Above 95%
By Grade
- Urethane Grade
- Regular Grade
By Product Type
- Synthetic
- Natural
By End-Use Industry
- Paints & Coatings
- Adhesives
- Printing Inks
- Plastics
- Pharmaceuticals
- Others
Drivers
Coatings and adhesive restocking across industrial value chains
MEK remains a standard solvent in paints, coatings, adhesives, glues, printing inks, and automotive or aerospace cleaning applications, so even a modest cyclical recovery in these downstream sectors translates quickly into solvent drawdown from distributors and formulators. Broader chemical conditions also turned more supportive: global chemical production was projected to rise 3.4% in 2024 and 3.5% in 2025 after only 0.3% growth in 2023, while many 2023–2024 cost-reduction and asset-efficiency programs continued into 2025–2026, signaling that the market had moved beyond the deepest destocking phase.
That matters for butanone because coatings and adhesive producers typically rebalance inventories before expanding new capacity, so the first leg of recovery tends to appear as higher operating rates and solvent reorder frequency rather than headline capex. In practical terms, this driver adds about 1.4 percentage points to CAGR because it lifts base-volume utilization across the largest incumbent end uses without requiring a step-change in technology adoption.
Drivers Impact Analysis
| Driver | (~) % Impact on CAGR | Geographic Relevance | Impact Timeline |
|---|---|---|---|
| Coatings and adhesive restocking across industrial value chains | +1.4% | Asia-Pacific core, North America core, EU selective rebound | Short term (≤ 2 years) |
| Cost-competitive Asian supply and price arbitrage improving solvent offtake | +0.9% | Northeast Asia core, Southeast Asia, India, export-linked EU buyers | Short term (≤ 2 years) |
| EV, electronics, and specialty film manufacturing sustaining high-purity solvent demand | +1.1% | China core, Korea, Japan, Taiwan, North America battery corridor, EU battery pilots | Medium term (2-4 years) |
| Supply chain regionalization after European capacity pressure | +0.8% | EU import markets, US Gulf export base, Middle East-to-Europe flows, India spill-over | Medium term (2-4 years) |
| Process-efficiency and customer-specific formulation innovation preserving MEK relevance | +0.7% | North America, EU, Japan, Korea, multinational coating and adhesive accounts | Medium term (2-4 years) |
| Construction-renovation and protective maintenance demand stabilizing solvent consumption | +1.0% | APAC corridors, US maintenance markets, Middle East infrastructure, selected EU renovation markets | Long term (≥ 4 years) |
Restraints
Europe energy-cost squeeze
Europe remains the least attractive major production zone for butanone expansion because persistent energy-cost disadvantage is destroying manufacturing competitiveness and shrinking local chemical optionality. By early 2026, announced European chemical closures from 2022 to 2025 had reached 37 million metric tons, equal to about 9% of the region’s total chemical production base, and 49% of shutdown announcements explicitly cited insufficient energy-cost competitiveness as the primary cause.
Earlier industry analysis also showed Europe-based plants still carrying natural-gas prices roughly 70% above pre-crisis levels and operating-rate pressure across petrochemicals, which suppresses margin tolerance for mid-chain solvents. The estimated CAGR drag is 1.2 percentage points because the region’s cost stress delays capex, discourages restarts, and shifts buyers toward lower-MEK or alternative formulations whenever solvent value capture fails to offset structurally higher European manufacturing overhead.
Restraint Impact Analysis
| Restraint | (~) % Impact on CAGR | Geographic Relevance | Impact Timeline |
|---|---|---|---|
| VOC regulation tightening | -1.6% | North America core, EU core, advanced APAC | Medium term (2-4 years) |
| Europe energy-cost squeeze | -1.2% | EU core, UK, import-linked EMEA | Short term (≤ 2 years) |
| Freight and rerouting volatility | -1.0% | Asia-EU lanes, India-EU, Asia-US East Coast | Short term (≤ 2 years) |
| Downstream reformulation shift | -1.1% | EU, Canada, US, Japan, Korea | Medium term (2-4 years) |
| Trade-policy and inventory shocks | -0.8% | US core, China-linked trade, Southeast Asia, India | Short term (≤ 2 years) |
| Mature end-use saturation | -0.7% | North America, Western Europe, Japan | Long term (≥ 4 years) |
Opportunity
Premium compliant blends
Suppliers that can combine MEK with co-solvents, recovery guidance, documentation support, and lower-loss application protocols may be able to preserve 60%–80% of at-risk accounts that would otherwise migrate fully to alternative systems, while charging a premium of 8%–15% for validated compliant blends in regulated categories. Because this strategy protects existing demand and opens regulated premium niches simultaneously, it can add about +1.0 percentage point to CAGR on top of baseline in Canada, the EU, the US, and advanced APAC markets where compliance complexity rewards technically differentiated solvent systems.
Opportunity Impact Analysis
| Opportunity | (~) % Potential CAGR | Geographic Relevance | Execution Window |
|---|---|---|---|
| High-purity electronics grades | +1.3% | China, Korea, Japan, Taiwan, US battery corridor | Medium term (2-4 years) |
| Solvent recovery service model | +1.1% | EU core, North America core, Japan, Korea | Short term (≤ 2 years) |
| India and ASEAN converting lines | +1.4% | India core, Vietnam, Indonesia, Thailand, Philippines | Short term (≤ 2 years) |
| Advanced recycling solvent niche | +0.9% | EU, North America, Japan selective | Medium term (2-4 years) |
| Formulation-led M&A roll-up | +0.8% | EU, US, India, Southeast Asia | Medium term (2-4 years) |
| Premium compliant blends | +1.0% | Canada, EU, US, advanced APAC | Short term (≤ 2 years) |
Challenges
Process-engineer talent gap
The process-engineer talent gap is a slow-burning challenge that constrains debottlenecking, process-intensification, and safe solvent handling across butanone production and consumption sites, without collapsing current operations outright.
This shortage has operational consequences: fewer experienced engineers per plant means longer timelines—often 12–24 months instead of 9–12 months—for revamp projects, slower response to process upsets or solvent recovery optimization, and higher reliance on external consultants for root-cause analysis and plant-wide integration, each of which adds 10–25% to project engineering budgets. For MEK-linked assets, where
Challenges Impact Analysis
| Challenge | (~) % CAGR Friction | Geographic Relevance | Mitigation Horizon |
|---|---|---|---|
| Volatile solvent logistics | -1.1% | APAC–EU, APAC–US, India–EU corridors | Medium term (2-4 years) |
| VOC compliance complexity | -1.0% | EU regulatory hubs, North America, India | Long term (≥ 4 years) |
| Process-engineer talent gap | -0.8% | North America, EU, Australia, aging clusters | Long term (≥ 4 years) |
| Safety stock and working capital | -0.9% | Global manufacturing hubs, large distributors | Short term (≤ 2 years) |
| Capex discipline and payback risk | -0.7% | Global chemical producers, especially EU | Medium term (2-4 years) |
| Data and traceability demands | -0.6% | EU, North America, India compliance corridors | Medium term (2-4 years) |
Geopolitical Impact Analysis
Maritime bottlenecks and energy weaponization fracture international supply chains.
Ongoing Russia-Ukraine war and increased maritime disputes in the Red Sea have a direct and severe distorting effect on the global butanone market structure. Because butanone synthesis is essentially dependent on petrochemical feedstocks such as n-butene and secondary butyl alcohol, structural instabilities in oil and gas production routes produce rapid disruptions in manufacturer margins. For example, trade tracking maps demonstrate that European chemical complexes are subjected to chronically high utility tariffs and unpredictable naphtha prices as a result of the permanent loss of low-cost Russian pipeline gas imports.
For example, increasing supply constraints prevent the legal transport of highly specialized oxygenated solvents into specific Eastern European production corridors, resulting in severe regional shortages. In reaction to these supply problems, global chemical purchasers are progressively abandoning just-in-time sourcing strategies. Industrial procurement teams are implementing near-shoring strategies and increasing buffer inventories to protect automated downstream packaging and automobile refinish lines from ongoing geopolitical shocks.
Regional Analysis
Asia Pacific Held the Largest Share of the Global Butanone Market.
Asia Pacific held the largest share of the global butanone market, accounting for 38.50%. This dominance is mainly supported by strong demand from paints and coatings, adhesives, printing inks, automotive manufacturing, construction, packaging, electronics, and chemical processing industries. China, India, Japan, South Korea, and Southeast Asian countries represent key consumption hubs due to their large manufacturing base and expanding infrastructure activity.
North America and Europe remain stable markets, supported by established coatings, specialty chemicals, automotive refinishing, and industrial manufacturing sectors. However, stricter VOC and environmental regulations are encouraging greater focus on compliant solvent use, emission control, and higher-efficiency formulations. Latin America, the Middle East, and Africa are gradually expanding as construction, packaging, and industrial manufacturing activity increases, although their market share remains smaller compared with Asia Pacific.
Key Regions and Countries
- North America
- The US
- Canada
- Europe
- Germany
- France
- The UK
- Spain
- Italy
- Russia & CIS
- Rest of Europe
- APAC
- China
- Japan
- South Korea
- India
- ASEAN
- Rest of APAC
- Latin America
- Brazil
- Mexico
- Rest of Latin America
- Middle East & Africa
- GCC
- South Africa
- Rest of MEA
Key Players Analysis
The Global Butanone Market exhibits a moderately consolidated to oligopolistic market structure, driven by the prominent presence of established chemical conglomerates. From the list of competitors, one can see that large companies, including ExxonMobil, Shell Chemicals, INEOS Group, and LyondellBasell, have huge production capacities and market shares. The oligopoly market structure is characterized by high competition levels from a few large multinational corporations that exercise great control over the price formation, logistics, and innovations.
Major players in the Asian region such as Sinopec, China National Petroleum Corporation (CNPC), Mitsui Chemicals, SK Group, and Maruzen Petrochemical dominate the eastern supply chain. There is also the aspect of specialized firms such as Celanese, Arkema, Sasol Limited, and Nouryon that serve particular needs in terms of purity and grades. However, while this fragmentation exists based on geographical location, it does not necessarily imply an overall fragmented market structure or market dominance.
The Major Players In The Industry
- ExxonMobil Chemical Company
- Shell Chemicals / Shell Plc
- Maruzen Petrochemical Co., Ltd.
- TonenGeneralŠebio / Tonen
- Sasol Limited
- SK Group
- Celanese Corporation
- Arkema S.A.
- INEOS Group
- Nouryon
- Zibo Qixiang Tengda Chemical Co., Ltd.
- Mitsui Chemicals, Inc.
- China National Petroleum Corporation (CNPC)
- Sinopec (China Petroleum & Chemical Corporation)
- LyondellBasell Industries
Key Development
- In March 2026, Sinopec (China Petroleum & Chemical Corporation) published its comprehensive 2025 financial and production review confirming a 3.6% year-on-year growth in total chemical product sales volume to 87.12 million tonnes. The state-owned enterprise verified its strict regulatory capital redirection plans for the rest of 2026, focusing capital expenditure (budgeted between 131.6 billion to 148.6 billion yuan) primarily on raw material integration to stabilize volatile upstream chemical chains amid lower global commodity pricing.
- In March 2026, Zibo Qixiang Tengda Chemical Co., Ltd. officially implemented targeted market pricing optimization policies, enacting upward adjustments to its spot-market quotes for premium organic solvent grades. The pricing optimization followed consecutive downstream stabilization trends in regional industrial coatings distribution
Report Scope
| Report Features | Description |
|---|---|
| Market Value (2025) | USD 4.19 Bn |
| Forecast Revenue (2035) | USD 6.60 Bn |
| CAGR (2026-2035) | 4.70% |
| Base Year for Estimation | 2025 |
| Historic Period | 2020-2024 |
| Forecast Period | 2026-2035 |
| Report Coverage | Revenue Forecast, Market Dynamics, Competitive Landscape, Recent Developments |
| Segments Covered | By Purity (Up to 90%, 90%–95%, Above 95%), By Grade (Urethane Grade, Regular Grade), By Product Type (Synthetic, Natural), By End-Use Industry (Paints & Coatings, Adhesives, Printing Inks, Plastics, Pharmaceuticals, Others) |
| Regional Analysis | North America – The US & Canada; Europe – Germany, France, The UK, Spain, Italy, Russia & CIS, Rest of Europe; APAC– China, Japan, South Korea, India, ASEAN & Rest of APAC; Latin America– Brazil, Mexico & Rest of Latin America; Middle East & Africa– GCC, South Africa, & Rest of MEA |
| Competitive Landscape | ExxonMobil Chemical Company, Shell Chemicals / Shell Plc, Maruzen Petrochemical Co. Ltd., TonenGeneralŠebio / Tonen, Sasol Limited, SK Group, Celanese Corporation, Arkema S.A., INEOS Group, Nouryon, Zibo Qixiang Tengda Chemical Co. Ltd., Mitsui Chemicals Inc., China National Petroleum Corporation (CNPC), Sinopec (China Petroleum & Chemical Corporation), LyondellBasell Industries |
| Customization Scope | Customization for segments, region/country-level will be provided. Moreover, additional customization can be done based on the requirements. |
| Purchase Options | We have three licenses to opt for: Single User License, Multi-User License (Up to 5 Users), Corporate Use License (Unlimited Users and Printable PDF) |


