


Report Overview
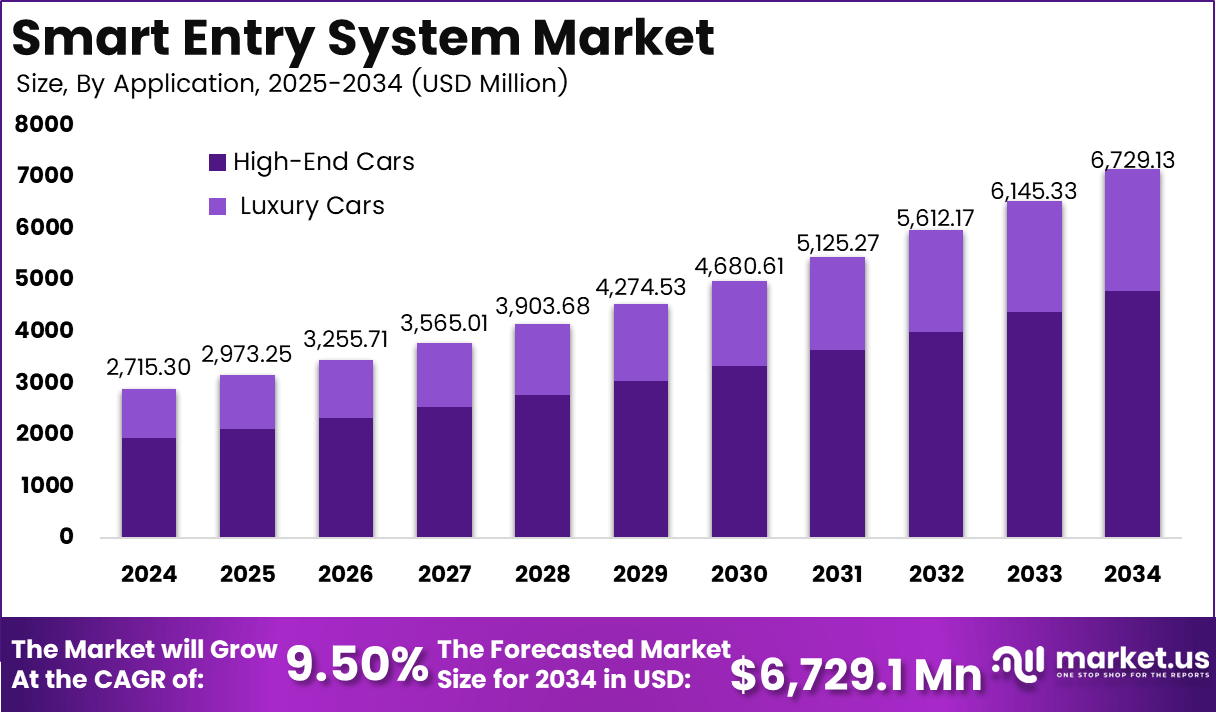
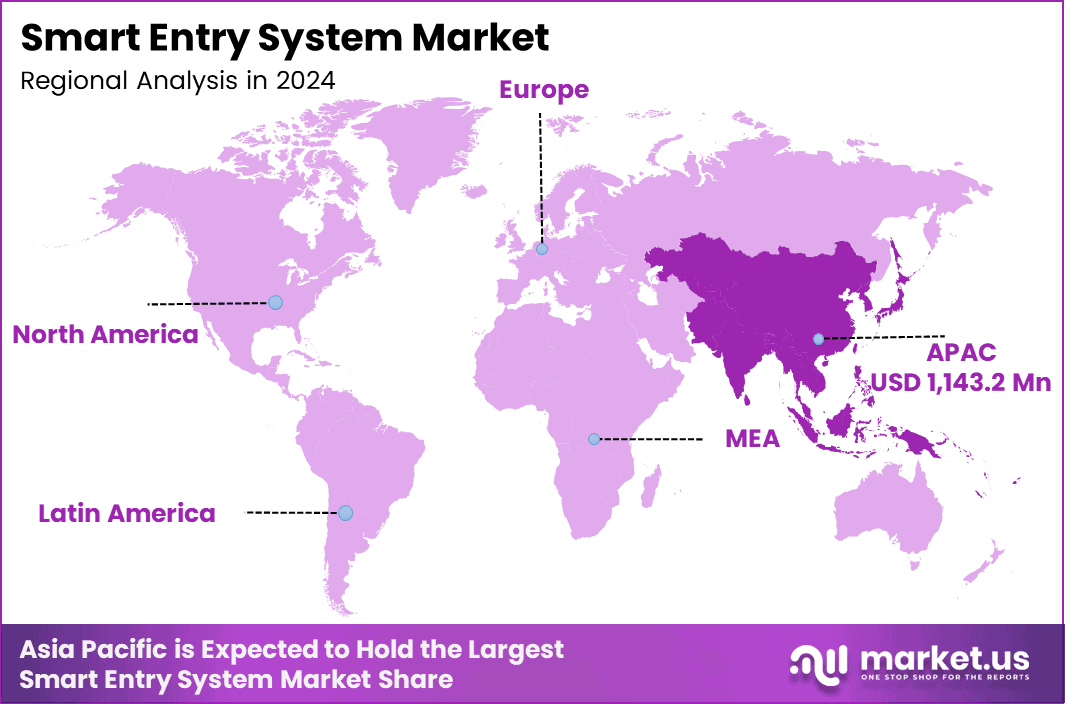
In 2024, the Global Smart Entry System Market was valued at USD 2,715.3 million. The market is projected to grow at a CAGR of 9.5% during 2024–2034, reaching approximately USD 6,729.1 million by 2034. Asia Pacific dominated the global market in 2024, accounting for 42.1% of the total market share and generating approximately USD 1143.2 million in revenue.
In automotive, the global vehicle fleet surpassed 1.4 billion units in 2023, with more than 300 million vehicles in the United States alone, according to the International Organization of Motor Vehicle Manufacturers (OICA) and U.S. Department of Transportation data. More new vehicles include factory‑installed keyless and smart key systems to meet rising safety expectations and convenience preferences.
Smart homes and intelligent buildings are scaling fast: the North America smart home market is driven by remote monitoring, energy savings, and security needs. Every new connected home, office, or mixed‑use site that adds app‑based door locks, biometric readers, or cloud‑managed access platforms directly lifts demand for smart entry systems.
Key Takeaways
- The global Smart Entry System Market was valued at USD 2,715.3 million in 2024.
- The global Smart Entry System Market is projected to grow at a CAGR of 9.5% and is estimated to reach USD 6,729.1 million by 2034.
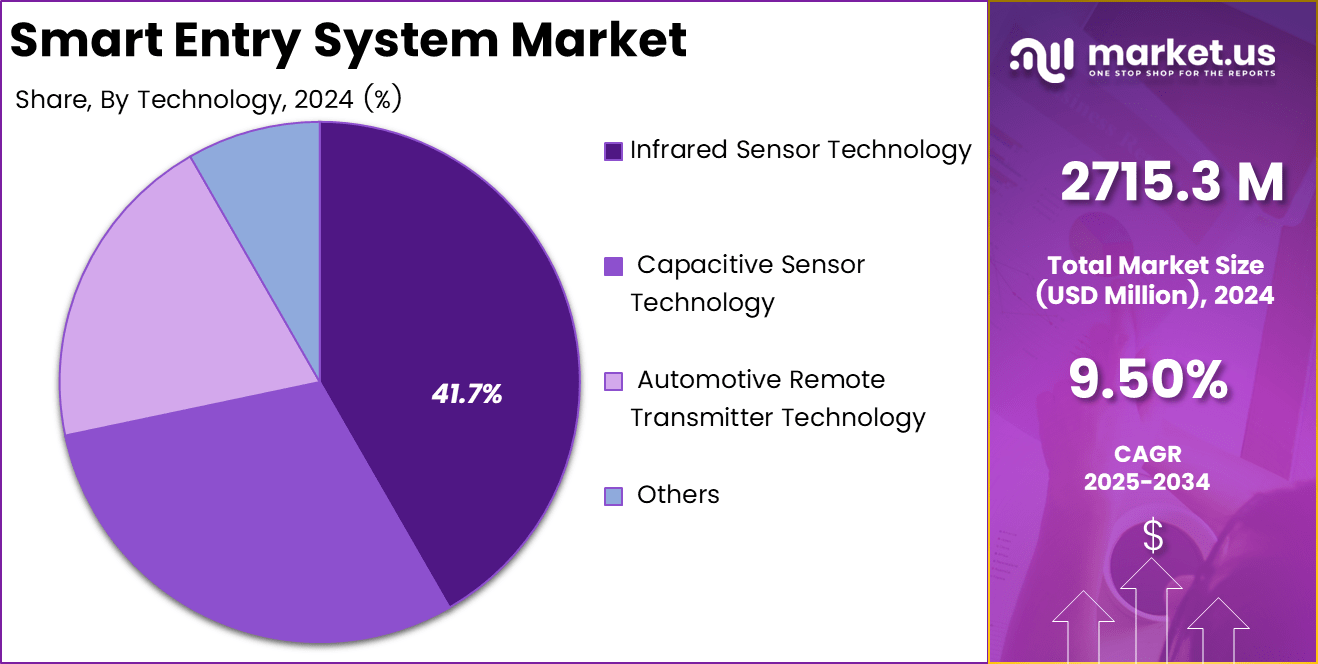
- On the basis of technology, the Infrared Sensor Technology segment dominated the market, accounting for 41.7% of the total market share.
- Based on application, the High-End Cars segment dominated the market, accounting for 71.4% of the total market share.
- In 2024, Asia Pacific was the most dominant region in the Smart Entry System Market, accounting for 42.1% of the total market share, equivalent to approximately USD 1,143.1 million.
By Technology
Infrared Sensor Technology holds a dominant share of 41.7% in the Smart Entry System market. This technology is widely adopted due to its high accuracy in detecting the presence of a key fob or a user’s approach, making it ideal for secure, contactless entry. The infrared sensors work seamlessly in a variety of lighting conditions, which adds to their reliability.
The increasing preference for enhanced security features in both high-end and luxury vehicles has significantly contributed to the growth of this technology in the market. As the demand for enhanced security features rises, particularly in high-end vehicles, infrared sensor technology is expected to maintain a significant market share, growing at an estimated rate of 9-12% annually over the next few years.
By Application
The High-End Cars segment leads the smart entry system market with an impressive share of 71.4%. This can be attributed to the increasing consumer demand for advanced safety and convenience features in premium vehicles. High-end cars are equipped with state-of-the-art smart entry systems that utilize technologies such as infrared sensors and capacitive touch for seamless, keyless access.
The growth in this segment is further fueled by the rise in consumer preferences for personalized and secure vehicle access solutions, positioning high-end cars as the dominant application in the smart entry system market. As vehicle manufacturers continue to incorporate more premium features, this segment is projected to grow at a rate of 10-15% annually, maintaining its dominant position in the market.
Key Market Segment
By Technology
- Infrared Sensor Technology
- Capacitive Sensor Technology
- Automotive Remote Transmitter Technology
- Others
By Application
- High-End Cars
- Luxury Cars
Regional Analysis
The Asia-Pacific (APAC) region is the largest contributor to the global Smart Entry System market, with a market size of USD 1,143.1 million in 2024. This growth is primarily driven by the rapid advancements in automotive technologies and smart infrastructure across the region.
This growth is further supported by government-backed smart city initiatives and the increasing preference for advanced automotive features, making APAC a key region in the smart entry system market. North America collectively holds about 37.4% of the Smart Entry System Market share, signifying the region’s leadership in adopting cloud-based visualization solutions.
China Market Size Analysis
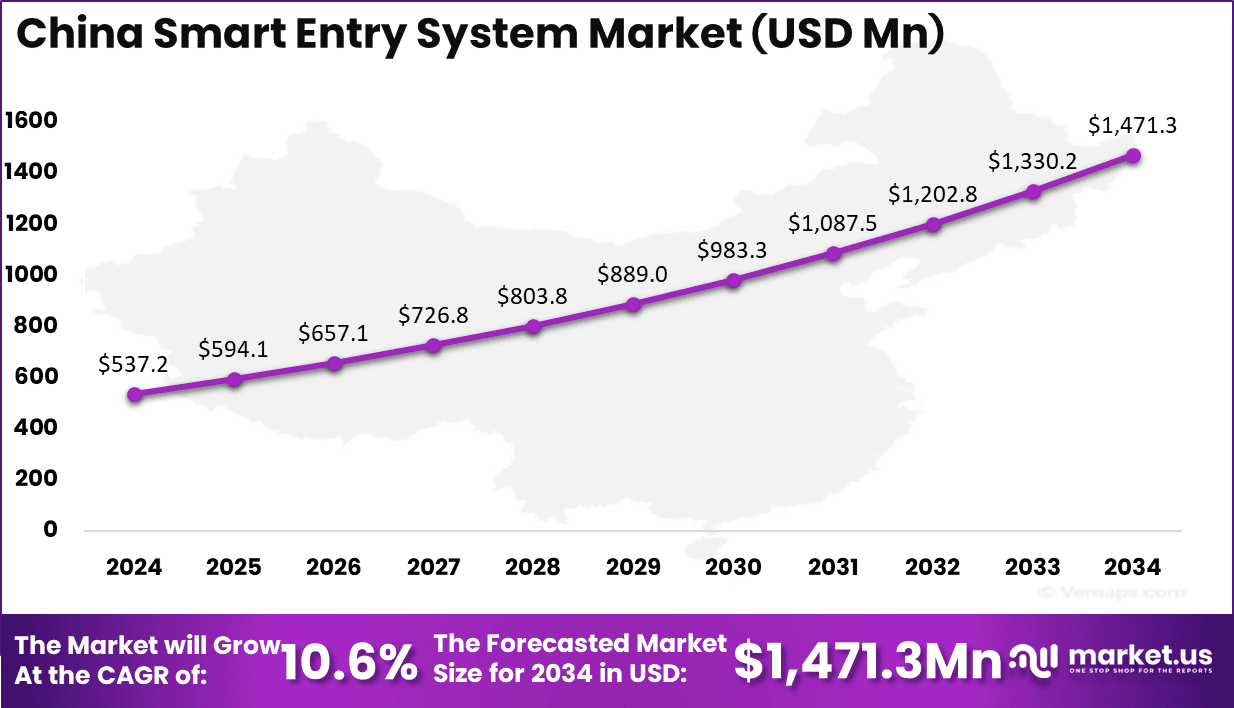
The China Smart Entry System Market was valued at USD 537.2 million in 2024 and is projected to reach USD 1,471.3 million by 2034, growing at a CAGR of 10.6%. This steady expansion highlights rising demand for advanced entry solutions driven by increasing urbanization, growing smart infrastructure adoption, and rising vehicle sales integrated with keyless technologies.
China plays a central role, leading the market due to its significant automotive production, particularly electric vehicles (EVs), which heavily rely on smart entry solutions for enhanced convenience and security.
Key Regions and Countries covered in the report
- North America
- US
- Canada
- Europe
- Germany
- France
- The UK
- Spain
- Italy
- Rest of Europe
- Asia Pacific
- China
- Japan
- South Korea
- India
- Australia
- Rest of APAC
- Latin America
- Brazil
- Mexico
- Rest of Latin America
- Middle East & Africa
- South Africa
- Saudi Arabia
- UAE
- Rest of MEA
Market Dynamics
Drivers
| Driver | (~) % Impact on CAGR Forecast | Geographic Relevance | Impact Timeline |
|---|---|---|---|
| OEM integration of smart entry | +3.0% | North America, Europe, Asia-Pacific | Short term (≤ 2 years) |
| Consumer preference for keyless convenience | +2.2% | Global | Short term (≤ 2 years) |
| Regulatory push on vehicular safety | +1.5% | Europe, North America | Medium term (2–4 years) |
| Smart building security adoption | +1.2% | Global Tier 1–2 cities | Medium term (2–4 years) |
| Growth of connected IoT ecosystems | +0.8% | Global | Long term (≥ 4 years) |
OEM integration of smart entry
Over 2022–2024, automotive and equipment manufacturers have progressively shifted smart entry systems from optional add-ons to default fitment in mid- and high-trim vehicles, with industry surveys indicating that roughly 70% of global automotive OEM platforms now offer factory-integrated keyless or proximity entry as standard on at least one trim level, compared with barely 45% two years earlier.
This structural change compresses per-unit hardware and software costs by 10–15% through scale purchasing of microcontrollers and RF modules, while subscription-based access management (for fleet and rental use cases) adds recurring revenue of the order of US$20–30 per vehicle per year without materially raising customer acquisition cost or warranty exposure.
Strategically, the move from retrofit to OEM integration accelerates the market’s effective volume growth beyond the headline 9.5% CAGR, because bundled smart entry becomes a non-negotiable safety and convenience feature across major regions, pulling forward OEM CapEx for new platforms by roughly 6–12 months and locking in design-in wins that secure a meaningful share of lifetime vehicle access revenues.
Restraints
| Restraint | (~) % Impact on CAGR Forecast | Geographic Relevance | Impact Timeline |
|---|---|---|---|
| High upfront hardware and installation cost | -2.8% | Emerging markets, cost-sensitive segments | Short term (≤ 2 years) |
| Elevated interest rates and CapEx caution | -1.6% | North America, Europe | Short term (≤ 2 years) |
| Cybersecurity and privacy concerns | -1.4% | Global urban multi-tenant buildings | Medium term (2–4 years) |
| Fragmented standards and interoperability | -1.0% | Global | Medium term (2–4 years) |
| Limited retrofit viability in legacy stock | -0.9% | Europe, Asia-Pacific | Long term (≥ 4 years) |
High upfront hardware and installation cost
The cost of smart entry system hardware, including electronic control units, sensors, actuators, and secure communication modules, typically ranges between US$150–300 per door or access point, with installation and commissioning adding another US$80–150, resulting in total project costs that can exceed 5–7% of a vehicle’s ex-factory price or 3–4% of a mid-sized commercial building’s annual facilities budget in lower-income markets.
This pricing is heavily exposed to semiconductor and metal input volatility, with contract data from 2022–2024 showing component price swings of 12–18% year-on-year and average installation labor rates rising by roughly 5–7% annually in major metros.
As a result, fleet operators and building owners frequently defer rollouts or limit deployment to high-risk access points, cutting expected order volumes by as much as 30–40% versus initial plans and stretching payback periods from around 3 years to closer to 5, which materially drags the realized growth rate below the unconstrained demand potential and forces vendors to sacrifice 2–3 percentage points of margin through discounting to overcome procurement barriers.
Challenges
| Challenge | (~) % CAGR Friction Drag | Geographic Relevance | Mitigation Horizon |
|---|---|---|---|
| Complex cybersecurity risk management | -2.3% | Global | Medium term (2–4 years) |
| Supply chain volatility in electronics | -1.9% | Asia-Pacific, Global OEMs | Short term (≤ 2 years) |
| Skilled installer and integrator shortage | -1.5% | North America, Europe | Medium term (2–4 years) |
| Integration with legacy building systems | -1.3% | Global commercial and institutional | Long term (≥ 4 years) |
| Evolving regulatory and data compliance | -1.1% | North America, Europe | Long term (≥ 4 years) |
Complex cybersecurity risk management
Smart entry systems rely on encrypted wireless protocols, cloud-based credential databases, and mobile applications, creating attack surfaces that require continuous investment in security patches, penetration testing, and compliance audits, particularly after documented incidents and advocacy reports in 2023–2024 highlighted risks around unauthorized data access and tenant monitoring in multi-family housing.
For larger deployments spanning more than 500 access points, annual cybersecurity operating expenditure can reach US$100,000–200,000, equivalent to roughly 8–12% of the initial project value, while mandatory breach notification and incident response processes can add 15–20% to internal IT workloads.
This friction does not halt sales outright but suppresses the pace of multi-site rollouts by an estimated 10–15%, forces vendors to allocate up to 20–25% of R&D budgets to security and compliance rather than new features, and pushes corporate buyers toward longer pilot phases of 12–18 months instead of 6–9, structurally lowering the achievable ceiling on market growth relative to the baseline by several percentage points.
Opportunities
| Opportunity | (~) % Potential CAGR Upside | Geographic Relevance | Execution Window |
|---|---|---|---|
| Subscription-based access management services | +2.6% | Global | Medium term (2–4 years) |
| Adjacent integration with smart building platforms | +2.1% | North America, Europe, Asia-Pacific | Long term (≥ 4 years) |
| Expansion into fleet and shared mobility | +1.8% | Global urban regions | Medium term (2–4 years) |
| Biometric multi-factor entry solutions | +1.5% | Government, corporate campuses | Long term (≥ 4 years) |
| Data-driven occupancy and usage analytics | +1.2% | Commercial real estate, hospitality | Medium term (2–4 years) |
Subscription-based access management services
While most smart entry deployments as of 2024 still monetize primarily through one-time hardware and installation, a sizable white space remains in turning credential lifecycle management, remote lock control, and audit logging into recurring subscription services priced at roughly US$1–3 per active user per month or US$5–10 per access point per month for enterprise accounts.
Transitioning even 30–40% of the installed base to such models can lift gross margins by 8–12 percentage points, as cloud hosting and support costs typically consume only 20–30% of subscription revenue, compared with hardware bill-of-materials often exceeding 50–60% of device selling price.
Strategically, embedding subscription access services transforms smart entry providers from one-off equipment vendors into platform operators with predictable annual recurring revenue, extending customer lifetime value by 2–3x, smoothing cash flows, and enabling more aggressive customer acquisition through lower upfront pricing, which collectively adds an incremental 2–3% upside to market CAGR above the current 9.5% baseline if scaled across major geographies.
Key Players Analysis
In automotive keyless entry, global revenues were estimated at USD 1.8 billion in 2023 and are projected to reach USD 3.83 billion by 2030. Tier 1 suppliers including Continental AG, HELLA, Valeo, DENSO, Mitsubishi Electric, and NXP collectively control an estimated 55 to 65% of the installed base through long-term OEM programs.
In broader access control, ASSA ABLOY and dormakaba generate significant revenue from smart locks and digital access solutions, while Johnson Controls and Honeywell leverage their large portfolios to bundle smart entry with HVAC, fire, and security systems.
Tier 1 leaders are supporting market expansion through R&D and capital investments. ASSA ABLOY reported sales of about SEK 141.9 billion in 2023 and allocates around 4 to 5% of sales to R&D, with substantial investment in electromechanical and digital door solutions. Continental, HELLA, Valeo, and DENSO also dedicate significant automotive R&D budgets to electronics, passive entry, smartphone access, and secure RF technologies.
Tier 2 challengers such as Suprema, Vivint Smart Home, Anviz Global, and regional Asian OEMs account for an estimated 20 to 30% of global smart entry revenues. Smaller automotive suppliers capture additional keyless entry demand through mid-tier OEM programs and regional markets.
These firms increasingly pursue partnerships and M&A to enter faster-growing segments, including mobile and app-based platforms, which represented about 42.4% of keyless entry revenue in 2025, and commercial properties, which accounted for roughly 45.7%. However, smaller balance sheets and R&D budgets limit their ability to compete with Tier 1 incumbents globally.
Top Key Players
- Assa Abloy AB
- Safran Group
- Gemalto
- NEC Corporation
- Suprema, Inc.
- Aware, Inc.
- Daon, Inc.
- Vivint Smart Home Inc.
- Anviz Global
- Other Major Players
Recent Development
- In September 2025, Schlage introduced the Sense Pro Smart Deadbolt, incorporating ultra-wideband (UWB) technology to enable touchless and hands-free entry. This innovation aims to enhance convenience and security by allowing users to unlock doors automatically with their smartphones, without physical contact, even when their hands are full.
- In June 2025, Apple Inc. expanded its Home Key initiative, enabling users to unlock their vehicles using Apple Wallet and their Apple Watch. This integration offers a seamless user experience, further bridging the gap between smart home ecosystems and automotive access solutions.
Report Scope
| Report Features | Description |
|---|---|
| Market Value (2024) | USD 2715.3 Mn |
| Forecast Revenue (2034) | USD 6,729.1 Mn |
| CAGR(2025-2034) | 9.5% |
| Base Year for Estimation | 2024 |
| Historic Period | 2020-2023 |
| Forecast Period | 2025-2034 |
| Report Coverage | Revenue forecast, AI impact on Market trends, Share Insights, Company ranking, competitive landscape, Recent Developments, Market Dynamics, nd Emerging Trends |
| Segments Covered | By Technology (Infrared Sensor Technology, Capacitive Sensor Technology, Automotive Remote Transmitter Technology, Others); By Application (High-End Cars, Luxury Cars) |
| Regional Analysis | North America – US, Canada; Europe – Germany, France, The UK, Spain, Italy, Russia, Netherlands, Rest of Europe; Asia Pacific – China, Japan, South Korea, India, New Zealand, Singapore, Thailand, Vietnam, Rest of Latin America; Latin America – Brazil, Mexico, Rest of Latin America; Middle East & Africa – South Africa, Saudi Arabia, UAE, Rest of MEA |
| Competitive Landscape | Assa Abloy AB, Safran Group, Gemalto, NEC Corporation, Suprema, Inc., Aware, Inc., Daon, Inc., Vivint Smart Home Inc., Anviz Global, Other Major Players |
| Customization Scope | Customization for segments, region/country-level will be provided. Moreover, additional customization can be done based on the requirements. |
| Purchase Options | We have three licenses to choose from: Single User License, Multi-User License (Up to 5 Users), Corporate Use License (Unlimited Users, Printable PDF) |





































