


Report Overview
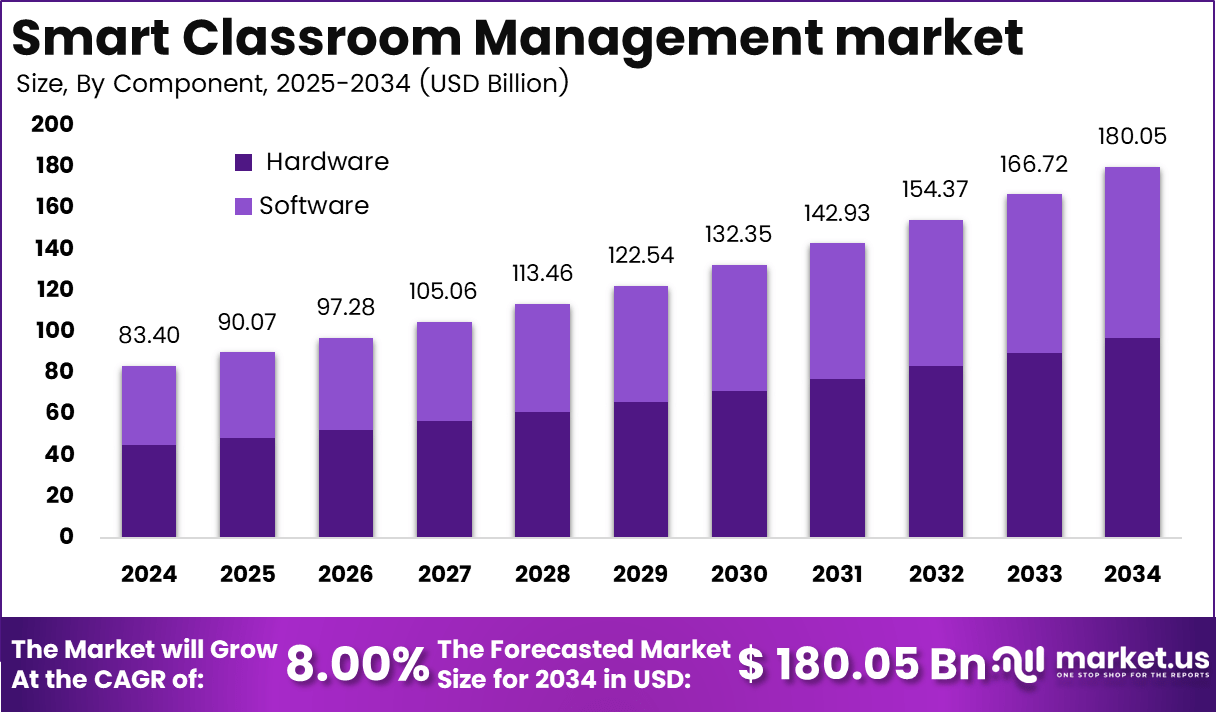
In 2025, the Global Smart Classroom Management Market was valued at USD 83.4 billion. The market is projected to grow at a CAGR of 8.0% during 2026–2035, reaching approximately USD 180.05 billion by 2035. North America dominated the global market in 2025, accounting for 40% of the total market share and generating approximately USD 31.5 billion in revenue.
According to the World Bank, global education spending is above USD 5 trillion a year, and a growing share of this is now directed toward devices, connectivity, and digital platforms in schools and universities. When governments and institutions deploy millions of laptops and tablets and connect classrooms to learning management systems and video platforms, they must also invest in software that can manage devices, control access, schedule lessons, and monitor student activity.
The U.S. smart classroom segment generated around USD 26.9–35.1 billion in 2024, reflecting deep penetration of interactive displays, LMS platforms, and analytics tools that all require central management software to operate efficiently. As schools seek measurable gains in learning outcomes and operational efficiency, they need real‑time classroom analytics, automated attendance, and secure content delivery.
Key Takeaways
- Sustained Growth: The global market is projected to grow at a steady CAGR of 8.0%, with increasing demand for both hardware and cloud-based software.
- Regional Leadership: North America will continue to dominate with around 40% market share, followed by Asia Pacific, which is expected to grow at the fastest rate, driven by strong EdTech investments.
- Hardware vs Software: Hardware will maintain a dominant position, but software is predicted to grow at a faster pace, with increasing adoption in K-12 schools and higher education.
- Profit Margins: While hardware margins may slightly decline due to competition, software solutions will experience higher profitability, especially those with subscription-based models.
- Emerging Markets: Latin America and MEA are projected to see steady growth at 9-10% annually, as digital classroom adoption increases.
- Hybrid & Remote Learning: The shift towards hybrid and remote learning will continue to accelerate the demand for interactive tools and cloud-based classroom management systems.
By Component
Hardware accounted for the majority share, contributing 54% in 2024, led by projectors, interactive whiteboards & displays, and interactive tables. The hardware segment continues to dominate due to strong demand from K-12 institutions, particularly as schools adopt interactive and immersive learning tools.
However, software (on-premises and cloud-based) is growing at a faster pace, driven by cloud adoption, real-time analytics, and integration with AI-driven teaching tools. Software solutions are predicted to grow by approximately 10-12% annually as educational institutions shift towards digital platforms for remote learning, collaboration, and data analytics.
The rise in cloud-based learning management systems (LMS) and digital classrooms is expected to further drive software growth, contributing 45% of market share by 2034, with software-based solutions leading in demand due to their scalability and continuous updates.
By Application
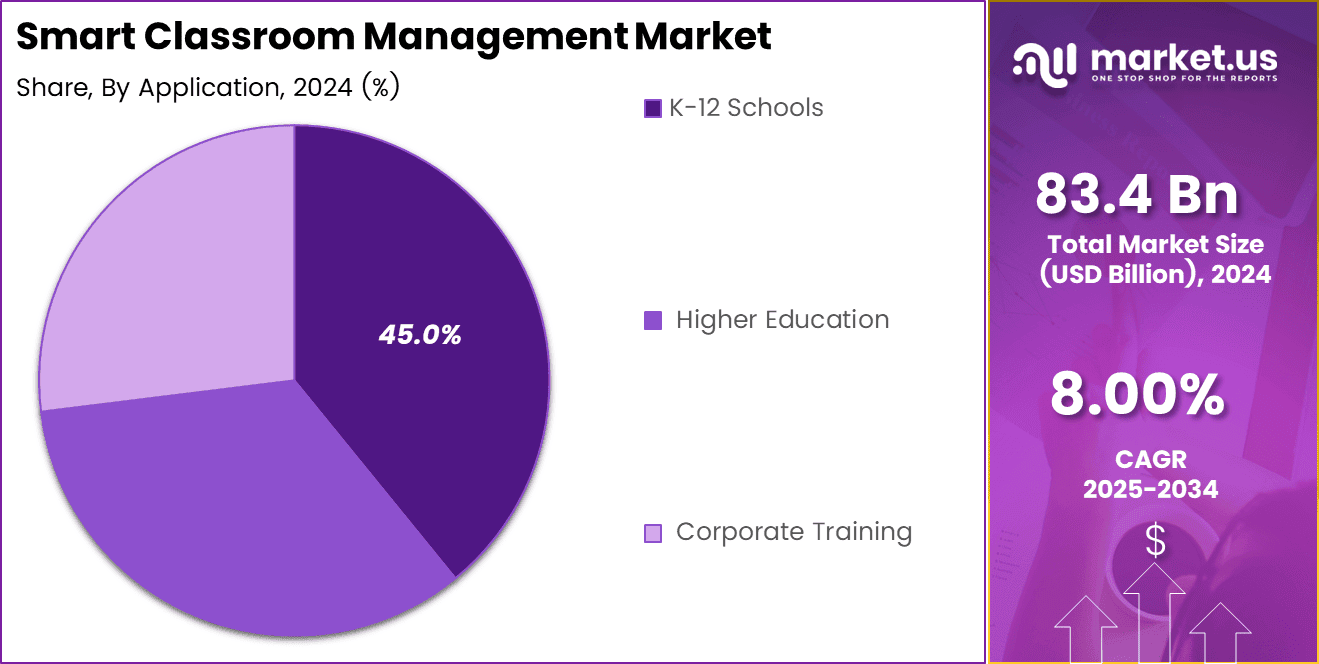
The largest share in 2024 was held by K-12 schools at 45%, reflecting strong investments in digital learning environments, government funding for educational technologies, and the expansion of hybrid learning models.
The K-12 sector is projected to grow at 7-8% CAGR annually, driven by the increasing adoption of smart classrooms, digital curricula, and interactive learning tools. Higher Education and Corporate Training follow, supported by the growing shift towards online platforms, hybrid classrooms, and lifelong learning initiatives.
Higher education institutions are expected to see 6-7% annual growth, while corporate training solutions are expanding due to workforce upskilling and the integration of AI tools. The corporate training market is predicted to grow at a 9-10% CAGR due to demand for employee development through digital and interactive learning tools.
Key Market Segments
By Component
- Hardware
- Projector
- Interactive Whiteboards & Displays
- Interactive Tables
- Software
- On-premises
- Cloud-based
By Application
- K-12 Schools
- Higher Education
- Corporate Training
Investment and Business Benefits
On the investment side, the Smart Classroom Management market is seeing significant demand across education, corporate training, and government sectors. Investment in the market is primarily directed towards the development of interactive hardware, such as smart boards and interactive displays, which represent approximately 50% of total market sales.
In parallel, there is a growing focus on cloud-based software solutions, which are expected to contribute around 35% of the market, with substantial investment in AI-driven tools for personalized learning and remote classroom management.
On the business side, cloud-based classroom management systems and hybrid learning platforms represent a substantial portion of the market, with higher education and corporate training segments contributing about 40% to total market sales. These systems vary widely in price, with basic models accessible for smaller institutions, while high-end enterprise solutions can reach several hundred thousand dollars.
Regional Analysis
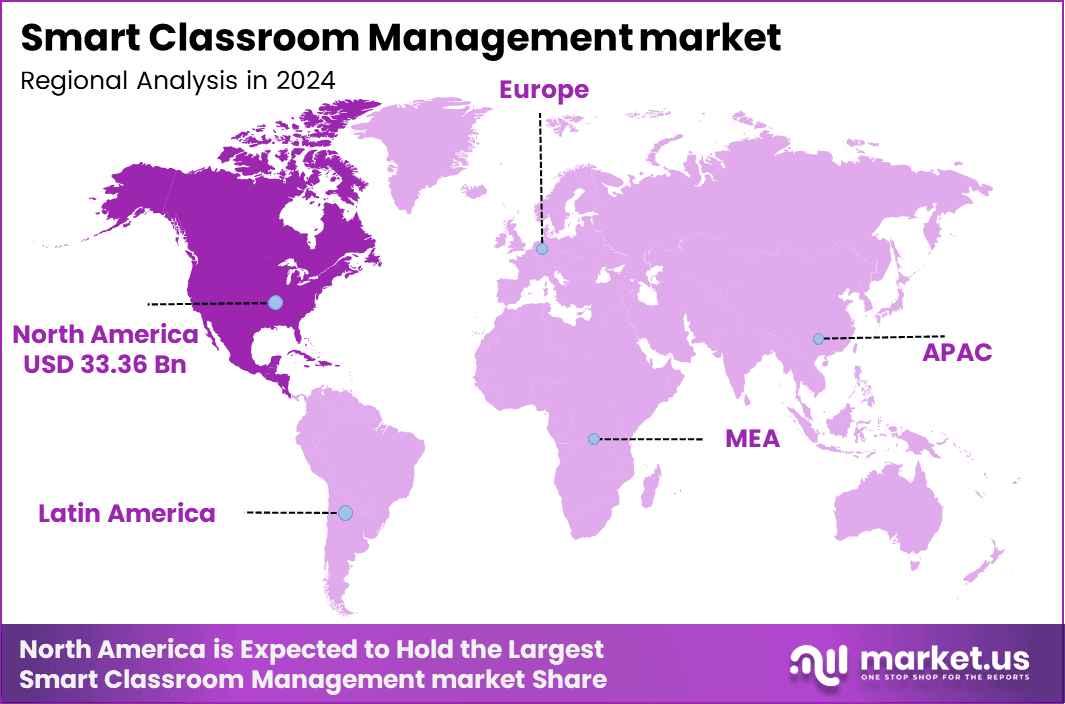
In 2024, North America clearly led the global Smart Classroom Management Market, accounting for around 40% of total revenue and generating about USD 33.4 billion. This regional dominance is supported by very high education spending and strong adoption of digital tools in schools and universities. U.S. public education expenditure alone is over USD 800 billion per year, and a growing part of this budget is dedicated to connected classrooms, student devices, and learning management systems.
When districts deploy hundreds of thousands of interactive displays, laptops, and cloud‑based platforms, they need reliable software to manage access, schedules, content, and student data. This direct link between infrastructure investment and the need to control and monitor digital classrooms explains why North America can sustain such a large share of the global market.
Government initiatives and broadband penetration further reinforce the region’s lead. The U.S. and Canada have near‑universal internet access in schools and are rolling out large‑scale programs for hybrid and online learning, which makes classroom management platforms essential to keep teaching organized and secure.
U.S Market Size
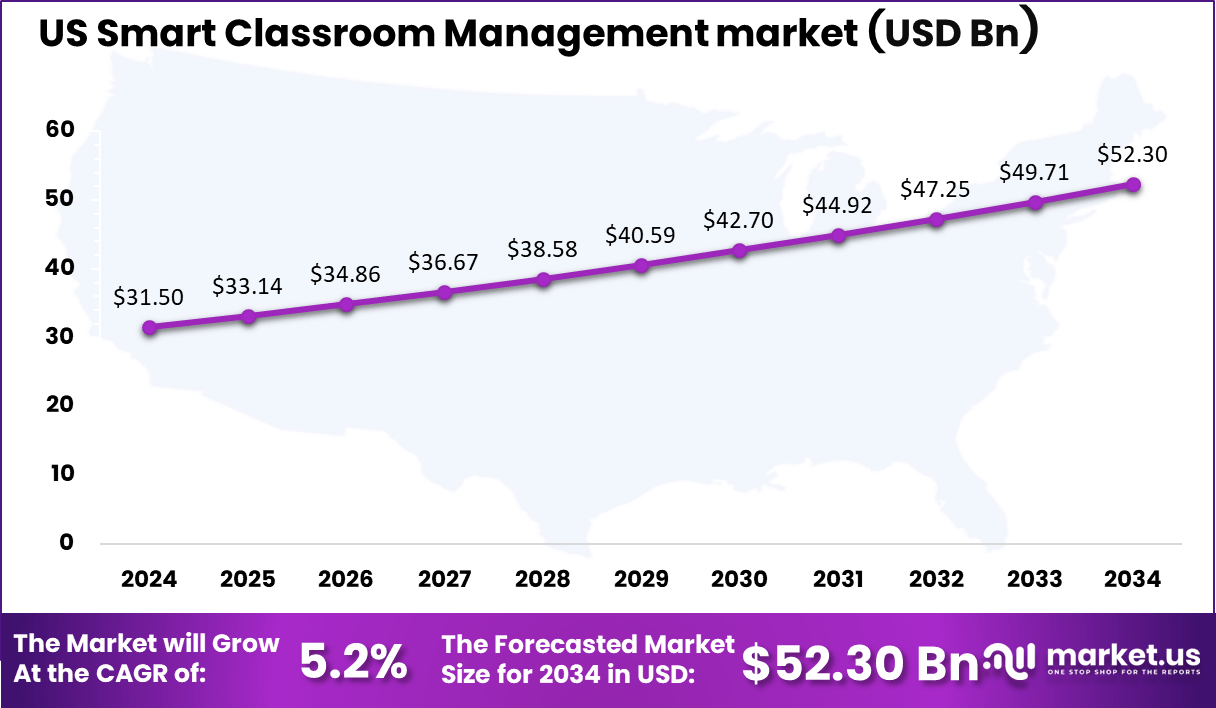
The U.S. Smart Classroom Management market is projected to grow steadily, with a compound annual growth rate (CAGR) of 5.2% over the forecast period. Starting from a market size of USD 31.5 billion in 2024, it is expected to reach USD 52.30 billion by 2034.
The market is expected to grow at a consistent annual growth rate, typically ranging between 4% and 7%, depending on industry factors like adoption, technology integration, and market demand shifts. 5% to 6% growth rate is considered healthy for most markets over a forecast period, reflecting steady demand and product expansion.
Key Regions and Countries
- North America
- US
- Canada
- Europe
- Germany
- France
- The UK
- Spain
- Italy
- Rest of Europe
- Asia Pacific
- China
- Japan
- South Korea
- India
- Australia
- Singapore
- Rest of Asia Pacific
- Latin America
- Brazil
- Mexico
- Rest of Latin America
- Middle East & Africa
- South Africa
- Saudi Arabia
- UAE
- Rest of MEA
Drivers
| Driver | (~) % Impact on CAGR Forecast | Geographic Relevance | Impact Timeline |
|---|---|---|---|
| Post-pandemic hybrid teaching normalization | +2.2% | North America, Europe, East Asia | Short term (≤ 2 years) |
| One-to-one device penetration in K12 | +1.5% | North America, Europe | Medium term (2–4 years) |
| Cloud-native LMS integration wave | +1.2% | Global | Medium term (2–4 years) |
| Government-backed classroom digitization | +0.9% | Asia-Pacific, Middle East, Latin America | Long term (≥ 4 years) |
| Growing teacher demand for analytics | +0.7% | Global urban districts | Short term (≤ 2 years) |
| Remote classroom monitoring for safety | +0.5% | North America, Western Europe | Medium term (2–4 years) |
Post-pandemic hybrid teaching normalization
The root cause is the structural shift since 2020, when emergency remote learning led districts in North America and Europe to embed video platforms, LMS, and digital workflows as default practice; by 2023, over 60% of K12 districts in the U.S. reported maintaining hybrid-ready timetables and issuing laptops or tablets to at least 80% of students, while roughly 50% of secondary schools in the EU had permanent virtual-classroom capability, creating a standing need for smart classroom management to orchestrate devices, content, and behavior.
Quantitatively, this hybrid normalization lifts adoption rates for classroom management software into the mid-40% range of digitally equipped schools in leading markets, and increases average annual software spend per classroom by around 15–20% as institutions move from single-point tools to integrated suites (attendance, screen control, participation monitoring), supporting an incremental contribution of roughly +2.2% to the baseline smart classroom management CAGR.
Commercially, vendors are shifting business models from perpetual licenses tied to on-prem servers toward SaaS subscriptions priced per student or per classroom (often in the US$5–US$15 per user per year band), which improves recurring revenue visibility but requires tighter control of customer acquisition cost district-level pilots that can run US$20,000–US$50,000 per deployment and pushes margins toward a profile where gross margins above 65% are attainable only with multi-tenant cloud delivery and centralized support rather than bespoke installations.
Restraints
| Restraint | (~) % Impact on CAGR Forecast | Geographic Relevance | Impact Timeline |
|---|---|---|---|
| Fragmented data privacy compliance burden | –1.9% | North America, Europe | Short term (≤ 2 years) |
| Constrained school IT budgets | –1.6% | Emerging markets, rural districts | Medium term (2–4 years) |
| Teacher resistance to monitoring tools | –1.1% | Europe, North America | Short term (≤ 2 years) |
| Legacy infrastructure and procurement cycles | –0.9% | Global | Long term (≥ 4 years) |
| Limited connectivity in low-income regions | –0.7% | Sub-Saharan Africa, South Asia | Long term (≥ 4 years) |
Fragmented data privacy compliance burden
The root cause is the overlapping web of education data privacy regulations—FERPA and COPPA in the U.S., GDPR in the EU, plus dozens of state-level statutes that treat student data as highly sensitive and impose explicit consent, role-based access, data minimization, and deletion obligations, forcing smart classroom management vendors to engineer compliance into every feature rather than relying on policy language alone.
Quantitatively, multi-region deployments require mapping upward of 50–100 distinct data elements (identifiers, behavioral logs, assessment scores) into retention categories, implementing access logging at per-event granularity, and managing sub-processor contracts with hosting-region constraints, adding security and compliance engineering costs that can lift development spend by 20–30% and delay rollouts by 6–12 months for cross-border deals.
This translates into an estimated drag of about –1.9% on the achievable CAGR relative to a frictionless regulatory environment. Strategically, vendors face margin compression because school districts increasingly demand independent security audits, data-processing addendums, and options such as single sign-on and two-factor authentication at no additional license charge, even though such capabilities can add US$1–US$3 per user per year in operating costs, which pushes providers to centralize compliance tooling.
Challenges
| Challenge | (~) % CAGR Friction Drag | Geographic Relevance | Mitigation Horizon |
|---|---|---|---|
| Interoperability with diverse edtech stacks | –1.7% | Global | Medium term (2–4 years) |
| Dependence on reliable connectivity | –1.3% | Emerging markets, rural areas | Long term (≥ 4 years) |
| Teacher digital skills gap | –1.1% | Global | Medium term (2–4 years) |
| Complexity of AI-driven analytics adoption | –0.9% | North America, Europe, East Asia | Medium term (2–4 years) |
| Long sales cycles in public education | –0.8% | Global | Long term (≥ 4 years) |
Interoperability with diverse edtech stacks
The structural vulnerability arises from the fact that most schools have assembled heterogeneous edtech environments over the past 5–10 years, mixing multiple LMS platforms, assessment systems, device management tools, and communication apps, so smart classroom management solutions must integrate cleanly with 5–10 different systems per institution to be fully adopted, rather than functioning as standalone tools.
Quantitatively, delivering robust interoperability can add 20–40% to initial engineering effort for each major platform integration, extend deployment timelines by 3–6 months while districts test data flows and user experience, and reduce the maximum addressable penetration rate from near-universal to something closer to the 50–60% of schools whose existing stacks match the supported combinations, creating friction that clips potential CAGR by about -1.7% even when baseline sales continue to grow.
Over the long term, corporate adjustments include investing in standardized APIs and interoperability frameworks, joining sector consortia to define data schemas, and building dedicated integration teams that can cost 10–15% of total headcount.
Opportunities
| Opportunity | (~) % Potential CAGR Upside | Geographic Relevance | Execution Window |
|---|---|---|---|
| Outcome-linked SaaS monetization models | +2.0% | North America, Europe | Medium term (2–4 years) |
| Expansion into emerging-market urban districts | +1.6% | Asia-Pacific, Latin America, Middle East | Long term (≥ 4 years) |
| Adjacency to teacher professional development | +1.3% | Global | Medium term (2–4 years) |
| Data-driven school operations optimization | +1.1% | North America, Europe, East Asia | Long term (≥ 4 years) |
| Bundling with broader edtech platforms | +0.9% | Global | Medium term (2–4 years) |
Outcome-linked SaaS monetization models
This is an untapped future lever because most smart classroom management deployments today are paid via flat per-seat or per-school licenses, regardless of learning or operational outcomes, while districts increasingly publish performance data showing that digital tools can lift engagement or exam scores by 5–15 percentage points in technology-intensive classrooms, opening scope for contracts that tie payments to measurable improvements.
Quantitatively, outcome-linked models could shift pricing from a static US$5–US$15 per user per year to blended structures where a base fee of perhaps 60–70% of current license value is combined with success fees pegged to indicators such as reduced disciplinary incidents per 100 students, higher course completion rates, or improved standardized test percentiles.
If even 20–30% of early-adopting districts accept such models, providers could realize revenue per active classroom that is 20–30% higher than under conventional licensing, driving a potential incremental CAGR upside of around +2.0% over the baseline.
Strategically, outcome-linked monetization also supports margin expansion because once analytics and instrumentation are built to collect and normalize classroom behavior events, attendance, and performance data at scale, the incremental cost to serve each additional classroom falls toward the low single digits of revenue, allowing gross margins to rise by an estimated 5–10 percentage points compared with legacy contracts.
Key Players Analysis
Tier-1 leadership in smart classroom management is anchored by Microsoft, Google, Apple, Cisco, and Dell. Microsoft’s education and productivity offerings generated about $69–70 billion in 2025, while Google Cloud reached the mid-$30 billion range with growth above 25% YoY.
Apple’s relevant hardware lines contributed over $30 billion, while Cisco’s networking and security businesses exceeded $30 billion in FY2024. Collectively, Tier-1 vendors account for an estimated 45–55% of global smart classroom-related spending, supported by R&D ratios of 12–15% for Microsoft and Google and 6–7% for Apple.
Tier-2 challengers include PowerSchool, Instructure, Smart Technologies, and Promethean. PowerSchool was taken private by Bain Capital for $5.6 billion in June 2024 and had pre-buyout revenue of $700–750 million, with an estimated 3–4% share of global classroom management software spending.
Instructure was acquired by KKR for about $4.8 billion in July 2024 and generated over $500 million in revenue. Smart Technologies and Promethean together capture 10–15% of the global classroom interactive display installed base, strengthening their position in hardware-enabled smart classroom solutions.
Top Key Players
- Microsoft Corporation
- Dell Inc.
- Apple, Inc.
- Fujitsu Ltd.
- Cisco Systems, Inc.
- Discovery Communications
- Dynavox Mayer-Johnson
- Huawei Technologies Co.
- Blackboard Inc.
- SAP SE
- Anthology
- Impero Solutions Ltd.
- Other
Recent Developments
- In August 2025, Microsoft Corporation launched Microsoft Learning Zone, a new AI-powered application designed to assist educators in creating interactive and personalized lessons. The app uses on-device AI to provide tailored educational content, making lessons more engaging and improving learning outcomes.
- In May 2025, Google LLC introduced new features for Google Classroom, integrating advanced AI-driven tools for real-time student performance analytics and automated grading. These features aim to improve classroom management and learning efficiency by providing teachers with actionable insights on student engagement and progress.
Report Scope
| Report Features | Description |
|---|---|
| Market Value (2024) | USD 83.4 Bn |
| Forecast Revenue (2034) | USD 180.0 Bn |
| CAGR(2025-2034) | 8.0% |
| Base Year for Estimation | 2024 |
| Historic Period | 2020-2023 |
| Forecast Period | 2025-2034 |
| Report Coverage | Revenue forecast, AI impact on Market trends, Share Insights, Company ranking, competitive landscape, Recent Developments, Market Dynamics, and Emerging Trends |
| Segments Covered | Component (Hardware [Projector, Interactive Whiteboards&Displays, Interactive Tables], Software [On-premises, Cloud-based]), By Application (K12 Schools, Higher Education, Corporate Training) |
| Regional Analysis | North America – US, Canada; Europe – Germany, France, The UK, Spain, Italy, Russia, Netherlands, Rest of Europe; Asia Pacific – China, Japan, South Korea, India, New Zealand, Singapore, Thailand, Vietnam, Rest of Latin America; Latin America – Brazil, Mexico, Rest of Latin America; Middle East & Africa – South Africa, Saudi Arabia, UAE, Rest of MEA |
| Competitive Landscape | Microsoft Corporation, Dell Inc., Apple, Inc., Fujitsu Ltd., Cisco Systems, Inc., Discovery Communications, Dynavox Mayer-Johnson, Huawei Technologies Co., Blackboard Inc., SAP SE, Anthology, Impero Solutions Ltd., Other |
| Customization Scope | Customization for segments, region/country-level will be provided. Moreover, additional customization can be done based on the requirements. |
| Purchase Options | We have three licenses to opt for: Single User License, Multi-User License (Up to 5 Users), Corporate Use License (Unlimited Users and Printable PDF) |





























