


Report Overview
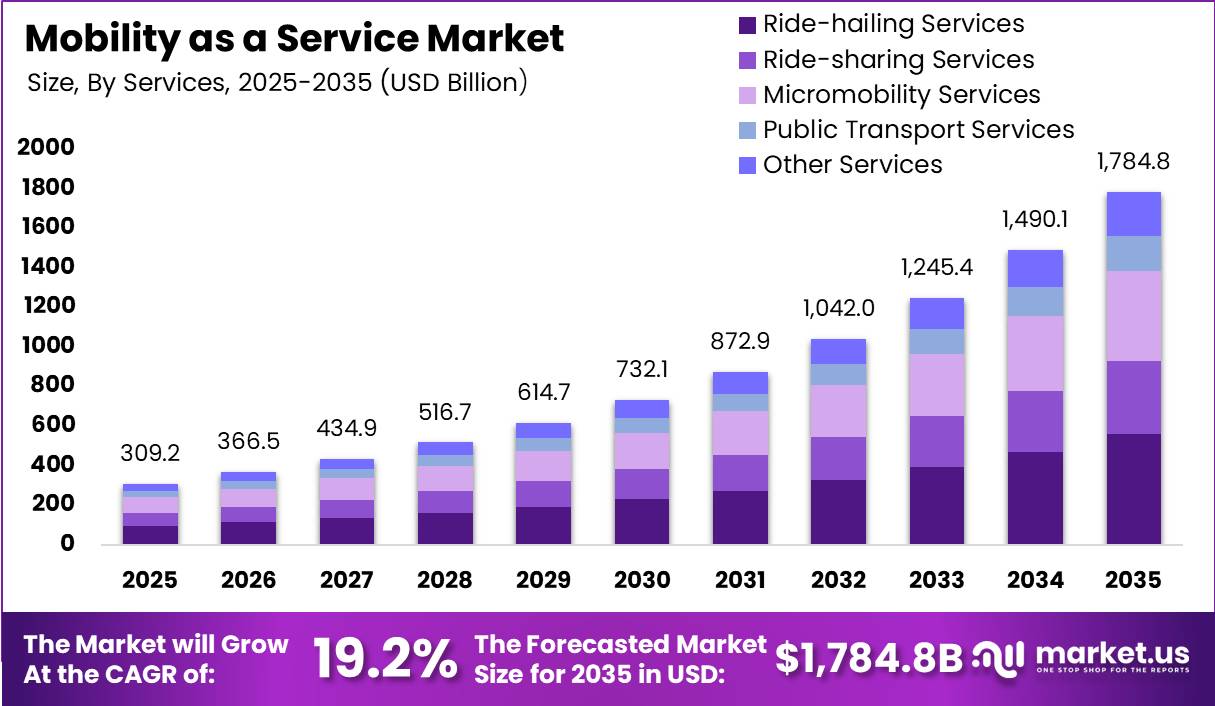
In 2025, the Mobility as a Service Market was valued at USD 309.2 billion. The market is projected to grow at a CAGR of 19.2% during 2026–2035, reaching approximately USD 1784.8 billion by 2035. North America dominated the global market in 2025, accounting for more than 37.45% of the total market share and generating approximately USD 115.8 billion in revenue.
Rapid urbanization remains the main factor supporting market growth. According to the United Nations Department of Economic and Social Affairs, urban areas currently accommodate 45% of the global population of 8.2 billion, compared with only 20% in 1950. By 2050, nearly two-thirds of the world’s population is expected to live in cities, adding around 2.5 billion urban residents.
This expansion will increase traffic congestion and demand for convenient, shared, and app-based transport services. Strong mobile connectivity is also supporting MaaS adoption. The International Telecommunication Union reported that four out of five people aged 10 years and above owned a mobile phone in 2024, while mobile broadband subscriptions reached 95 per 100 inhabitants globally. Transport electrification is creating further growth opportunities.
Global electric vehicle sales reached 17 million units in 2024 and were expected to exceed 20 million in 2025. Electric fleets can lower operating costs for ride-hailing and vehicle-sharing providers. In addition, U.S. public transit systems recorded 7.67 billion passenger trips in 2024, up around 9% from 2023, highlighting the continued recovery of shared and multimodal urban transport demand.
Key Takeaway
- The Global Mobility as a Service Market was valued at USD 309.2 billion in 2025 and is projected to reach USD 1784.8 billion by 2035, growing at a CAGR of 19.2%.
- Ride-hailing services dominated the services segment with a 31.34% share in 2025.
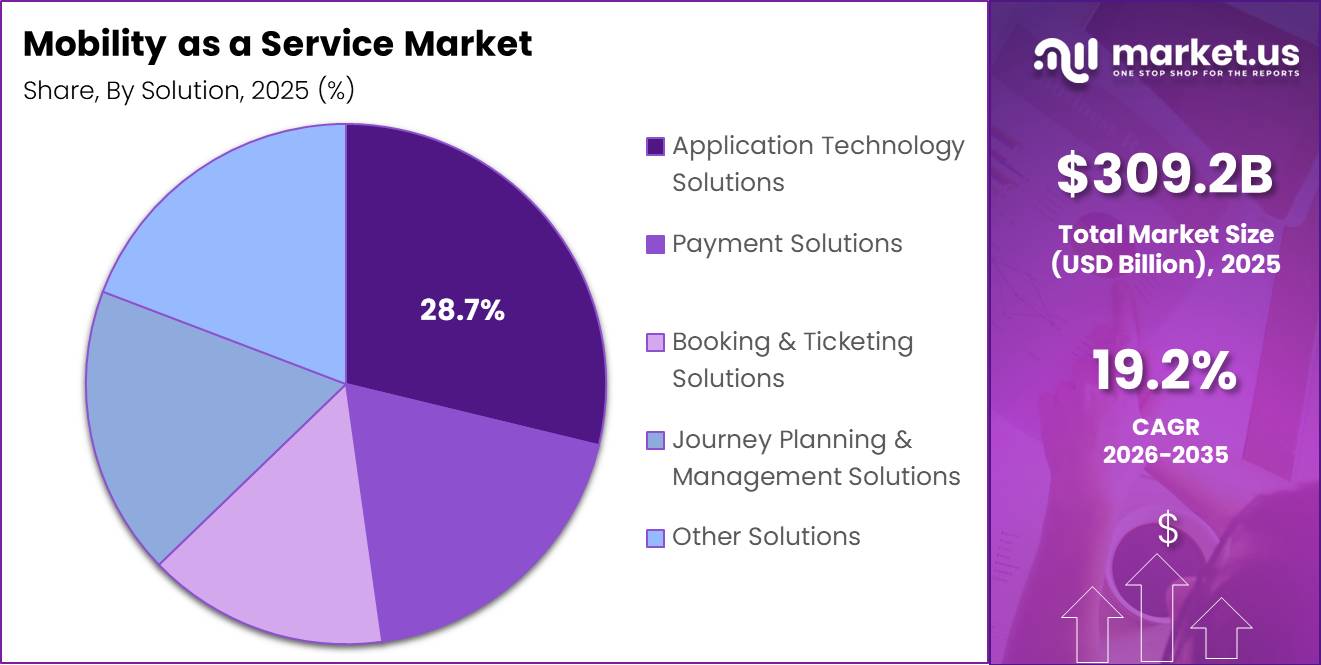
- Application technology solutions led the solution segment with a 28.78% share in 2025.
- The Business-to-Consumer model held the largest share of the business model segment at 40.23% in 2025.
- Private transportation dominated the transportation type segment with a 67.34% share in 2025.
- Internal combustion engine vehicles led the propulsion type segment with a 47.83% share, while electric vehicles were the fastest-growing segment.
- Android held a 40.67% share of the operating system segment, with iOS emerging as the fastest-growing segment.
- The Daily commute segment accounted for 78.54% of total market share.
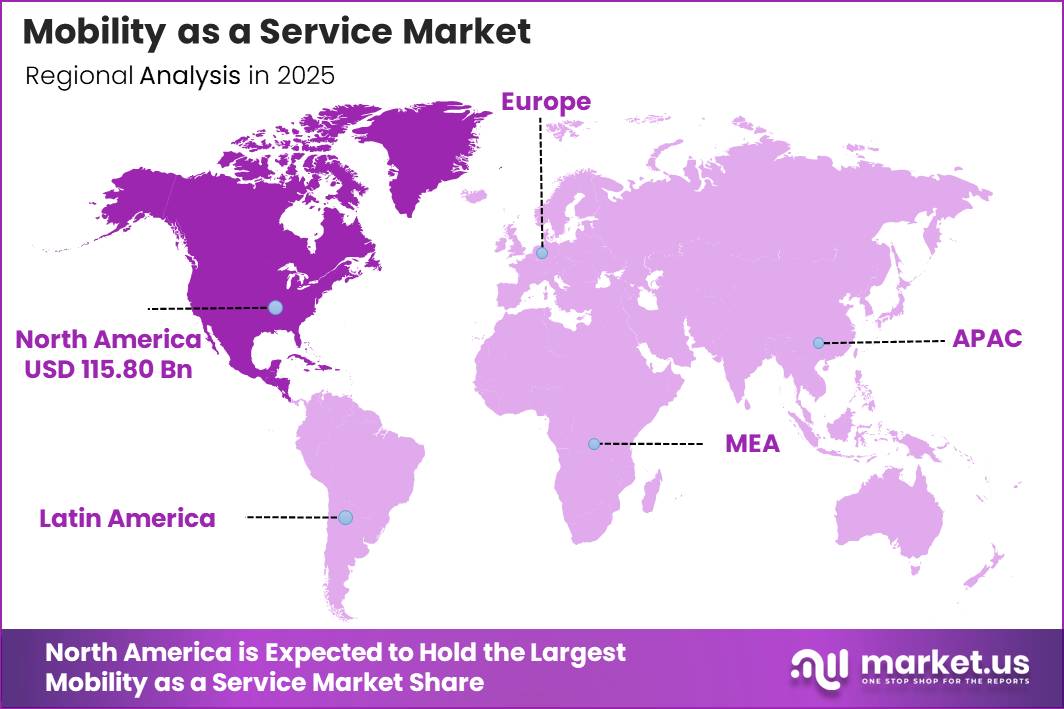
- North America led the market in 2025 with a 37.45% share, generating approximately USD 115.8 billion in revenue.
By Services
In 2025, Ride-hailing services held a dominant position in the Mobility as a Service market, capturing a 31.34% share. The segment’s leadership is supported by its asset-light business model, wide consumer acceptance, and ability to expand rapidly across urban markets.
According to Uber Technologies’ 2024 annual report filed with the U.S. Securities and Exchange Commission, the company completed 11.27 billion trips during 2024, representing a 19% increase from 2023. Gross bookings reached USD 162.8 billion, rising by 18% year over year.
Uber’s Mobility division also generated USD 6.9 billion in revenue during the fourth quarter of 2024, with a mobility revenue margin of 30.3%. These figures highlight the strong transaction volumes and earning potential of app-based transport services. Ride-hailing platforms also provide quick booking, cashless payment, real-time vehicle tracking, and flexible travel options, making them suitable for daily urban journeys.
By Solution
In 2025, Application technology solutions held a dominant position in the Mobility as a Service market, capturing a 28.78% share. This segment includes mobile applications, application programming interfaces, digital payment systems, route-planning tools, and multimodal booking platforms that connect users with different transport services.
According to the GSMA’s State of Mobile Internet Connectivity 2024 report, around 4.6 billion people were using mobile internet by the end of 2023, while approximately 200 million additional users gained access during 2024. This expanding digital population is creating a wider customer base for mobile transport platforms. Consumer engagement with travel applications also remained strong. Google Maps recorded 126.83 million global downloads in 2024, while the Uber application reached 119.54 million downloads.
Total travel application downloads across major mobile platforms increased to 4.2 billion during the year, rising by 3% from 2023. Users also spent more than 20 billion hours on travel applications for the first time. Every route search, ticket purchase, ride booking, and digital payment passes through the application layer, supporting frequent transactions and recurring software revenue.
By Business Model
In 2025, the Business-to-Consumer model held a dominant position in the Mobility as a Service market, capturing a 40.23% share. This model enables individual users to directly search, book, and pay for ride-hailing, public transport, vehicle-sharing, and micromobility services through digital platforms.
Its leading position is closely linked to the rapid growth of financial inclusion and digital payment adoption. According to the World Bank’s Global Findex 2025 report, 79% of adults worldwide held a financial account in 2024, compared with 51% in 2011.
In addition, 62% of adults globally made or received a digital payment during 2024. Across low- and middle-income economies, 61% of adults, representing more than 2 billion people, used digital payment services. This expanding payment infrastructure supports instant fare collection, mobile wallet payments, contactless ticketing, and automatic subscription billing.
By Transportation Type
In 2025, Private transportation held a dominant position in the Mobility as a Service market, capturing a 67.3% share. The segment includes ride-hailing through privately operated cars, car-sharing services, taxis, and chauffeur-driven vehicles. Its strong market position is supported by the large global base of passenger cars and the growing use of privately owned vehicles for shared mobility services.
According to the International Organization of Motor Vehicle Manufacturers, global passenger car production reached 67.67 million units in 2024, while total vehicle sales across all categories increased to 95.3 million units. The European Automobile Manufacturers’ Association also reported that global car registrations reached 74.6 million units in 2024, representing a 2.5% increase from 2023.
By Propulsion Type
In 2025, Internal combustion engine vehicles held a dominant position in the Mobility as a Service market, capturing a 47.8% share, while electric vehicles emerged as the fastest-growing propulsion segment. According to the International Energy Agency’s 2025 global electric vehicle database, electric cars accounted for only 4.5% of the worldwide car fleet at the end of 2024.
This indicates that more than 95% of passenger cars operating globally still relied on conventional fuel-based engines. With the global car fleet estimated at nearly 1.4 billion vehicles, ICE models remain the main source of supply for MaaS operators. However, electric vehicles are gaining strong momentum as fleet owners seek lower energy and maintenance costs.
The International Energy Agency reported that global electric vehicle sales reached 17.5 million units in 2024, representing 22% of all new car sales, compared with only 4% in 2020. Stricter emission rules, expanding charging infrastructure, and corporate sustainability targets are encouraging MaaS providers to electrify their fleets.
By Operating System
In 2025, Android held a dominant position in the Mobility as a Service market, capturing a 40.6% share, while iOS emerged as the fastest-growing operating system segment. Android’s leadership is mainly supported by its large global smartphone user base and wide availability across low-, mid-, and premium-priced devices. According to GSMA Intelligence, Android accounts for nearly 80% of active smartphone connections worldwide, compared with around 17% for iOS.
Counterpoint Research also reported that Android represented approximately 77% to 80% of global smartphone shipments during the first three quarters of 2024. In India, Android reached nearly 95% of smartphone shipments in the second quarter of 2024. This broad market reach allows MaaS providers to connect with a larger number of ride-hailing, vehicle-sharing, and multimodal transport users.
Google Play recorded around 102.4 billion application downloads in 2024, compared with 35.4 billion downloads on iOS, further supporting Android’s role as the main distribution platform. However, iOS is growing quickly due to stronger in-app spending among users in North America and Western Europe.
By Commute Type
The Daily commute segment leads the MaaS market with 78.5% share because recurring, work-related and education-related trips represent the bulk of predictable urban mobility demand, and they happen every single weekday. Daily commuting is a high-frequency, non-discretionary behaviour: people must travel to work or study regardless of weather, mood, or season, which makes it the most reliable source of MaaS trip volume and revenue.
OECD’s Time Use Database shows that in OECD-26 countries, adults aged 15–64 spend on average 28 minutes per day travelling to and from work or study, with peaks above 30 minutes in large metropolitan areas. The U.S. Census Bureau’s 2024 American Community Survey similarly reports that a majority of American workers who do not work from home have one-way commute times between 15 and 44 minutes, implying roughly 30–90 minutes of daily travel time that is ripe for MaaS substitution instead of private car use.
Key Market Segments
By Services
- Ride-hailing
- Ride-sharing
- Micromobility
- Public Transport
- Other
By Solution
- Journey Planning & Management
- Payment
- Booking & Ticketing
- Application Technology
- Other
By Business Model
- Business-To-Business
- Business-To-Consumers
- Peer-To-Peer
By Transportation Type
- Private
- Public
By Propulsion Type
- Internal Combustion Engine (ICE) Vehicle
- Electric Vehicle (EV)
- Compressed Natural Gas (CNG)/Liquefied Petroleum Gas (LPG) Vehicle
By Operating System
- Android
- iOS
- Others
By Commute Type
- Daily
- Occasionally
Geopolitical Impact Analysis
Geopolitical tensions are increasing costs and operational risks across the Mobility as a Service value chain. According to the World Trade Organization, global merchandise trade declined by 1.2% in 2023, while shipping disruptions and trade fragmentation weakened the outlook for 2024. In February 2024, the United Nations Conference on Trade and Development reported that vessel traffic through the Suez and Panama canals had fallen by more than 40% from peak levels, with Panama Canal transits declining by almost 50%.
These disruptions forced ships carrying vehicles, batteries, electronic systems, and spare parts to use longer routes, raising delivery times and freight expenses. UNCTAD estimated that higher transport costs could increase global consumer prices by 0.6% by the end of 2025. For MaaS operators, this may result in higher vehicle acquisition, maintenance, telematics, and battery replacement costs. Fuel price volatility creates additional pressure, particularly for fleets that continue to depend on internal combustion engine vehicles.
Oil markets remained sensitive to wars, supply risks, and OPEC+ production decisions during 2022 to 2024, affecting petrol and diesel expenses for ride-hailing and taxi operators. Trade tariffs also increased the cost of imported transport equipment, electronics, smartphones, and replacement components. In response, MaaS companies are adjusting dynamic fares, sourcing vehicles and parts from nearby production centres, diversifying suppliers, and improving route-planning systems.
Regional Analysis
In 2025, North America held a dominant position in the global Mobility as a Service market, accounting for 37.45% of total revenue and generating approximately USD 115.8 billion. The region’s leadership is supported by high smartphone use, strong digital payment adoption, and the wide availability of ride-hailing, micromobility, car-sharing, and subscription-based transport services.
MaaS platforms are also well connected with mapping tools, payment systems, and public transport networks in major cities such as New York, Toronto, and Los Angeles. These integrations support frequent bookings for daily commuting, airport travel, and leisure journeys. Europe represents another important market, supported by dense cities, developed public transport systems, and government support for integrated ticketing and low-emission mobility.
Asia-Pacific is expected to record the fastest growth due to rapid urbanization, rising incomes, and increasing smartphone adoption. Large cities across China, India, Indonesia, and Southeast Asia are using MaaS solutions to reduce congestion and connect buses, rail services, ride-hailing, and two- and three-wheeler transport.
Key Regions and Countries
North America
- US
- Canada
Europe
- Germany
- France
- The UK
- Spain
- Italy
- Rest of Europe
Asia Pacific
- China
- Japan
- South Korea
- India
- Australia
- Rest of APAC
Latin America
- Brazil
- Mexico
- Rest of Latin America
Middle East & Africa
- GCC
- South Africa
- Rest of MEA
Market Dynamics
Drivers
| Driver | (~) % CAGR | Geographic Relevance | Impact Timeline |
|---|---|---|---|
| Accelerating Urban Congestion & Transit Demand | +3.8% | Global — highest density impact in Asia Pacific & Europe | Short term (≤ 2 years) |
| Government Smart Mobility & Transit-Oriented Policy | +3.1% | India, EU, Southeast Asia, Middle East | Short term (≤ 2 years) |
| Smartphone Penetration & Super-App Ecosystem Maturity | +2.4% | Global — fastest acceleration in South & Southeast Asia | Short term (≤ 2 years) |
| ESG Mandates & Corporate Sustainability Commitments | +1.9% | EU, North America, Japan, Australia | Medium term (2–4 years) |
| Declining Cost of Platform Infrastructure & Cloud APIs | +1.5% | Global | Short term (≤ 2 years) |
| Real-Time Data & AI-Driven Route Optimization | +1.3% | North America, EU, China | Medium term (2–4 years) |
Accelerating Urban Congestion & Transit Demand
More than 56% of the global population lived in urban areas in 2024, increasing congestion pressure across major cities. Asia Pacific cities are adding transit demand equivalent to a mid-sized European city approximately every 18 months.
In tier-1 Indian cities such as Mumbai and Bengaluru, and Southeast Asian megacities such as Jakarta and Manila, commuters lose around 45–90 minutes per day in unproductive travel. This supports MaaS adoption by increasing demand for integrated mobility subscriptions that offer better convenience and higher average revenue per user than single-mode transport services.
Multimodal MaaS platforms combining buses, metro systems, micro-mobility, and ride-hailing can generate 4–6x higher transaction frequency than single-mode applications. This can reduce blended customer acquisition cost-to-lifetime value ratios by an estimated 30–40%.
In India, the Union Budget 2024–25 allocated ₹3,000 crore for public transport expansion in Tier-2 and Tier-3 cities. In addition, 94% of the 8,067 projects under the Smart Cities Mission had been completed by May 2025, allowing MaaS operators to reduce market-entry infrastructure timelines from 3–5 years to approximately 12–18 months.
Restraints
| Restraint | (~) % Impact on CAGR | Geographic Relevance | Impact Timeline |
|---|---|---|---|
| Fragmented Regulatory Frameworks & Licensing Restrictions | -3.2% | Global — most acute in South Asia, Latin America, Sub-Saharan Africa | Short term (≤ 2 years) |
| High Platform Build & Integration CapEx Burden | -2.6% | Emerging markets — India, Southeast Asia, Africa | Short term (≤ 2 years) |
| Data Privacy & Cross-Jurisdictional Compliance Costs | -1.8% | EU, UK, India (DPDP Act), California (CCPA) | Short term (≤ 2 years) |
| Venture Capital Scarcity & Elevated Cost of Capital | -1.5% | Global — most severe in South & Southeast Asia | Short term (≤ 2 years) |
| Incumbent Public Transport Operator Resistance | -1.1% | EU, India, Japan, Brazil | Medium term (2–4 years) |
Fragmented Regulatory Frameworks & Licensing Restrictions
The MaaS business model, by definition, is an aggregator that layers commercial services atop public infrastructure, sits at the intersection of at least three to five distinct regulatory jurisdictions in any single city deployment: urban transport licensing, digital payments authorization, data localization statutes, ride-hailing operator permits, and, in EV-integrated platforms, charging infrastructure concession frameworks.
In India alone, MaaS operators must navigate licensing under the Motor Vehicles Act (amended 2019), state-level aggregator permits issued by 28 different state transport authorities with non-uniform compliance calendars, and digital payment intermediary registration under RBI’s Payment Aggregator framework (final guidelines issued January 2023, with a mandatory re-authorization cycle for existing operators by September 2025).
This multi-layer regulatory stack imposes a compliance overhead that market-entry cost modeling based on the disclosed regulatory expenditure schedules of publicly listed aggregators and SEBI-filed DRHPs from Indian mobility startups suggests can consume between 12–18% of early-stage operational EBITDA and delay commercial launch in a new city by an average of 9–14 months.
Challenges
| Challenge | (~) % CAGR | Geographic Relevance | Mitigation Horizon |
|---|---|---|---|
| Multimodal Interoperability & API Standardization | -2.9% | Global — acute in EU, India, ASEAN | Medium term (2–4 years) |
| Digital Literacy & Rural Access Gap | -2.1% | South Asia, Sub-Saharan Africa, Southeast Asia | Long term (≥ 4 years) |
| Platform Cybersecurity & Data Breach Risk | -1.7% | Global | Medium term (2–4 years) |
| Tech Talent Deficit in Mobility Verticals | -1.5% | Global — most acute in India, Southeast Asia | Medium term (2–4 years) |
| EV Charging Infrastructure Readiness Gap | -1.2% | Emerging markets — India, ASEAN, Latin America | Long term (≥ 4 years) |
| Public-Private Integration Coordination Friction | -0.9% | India, Brazil, EU periphery | Medium term (2–4 years) |
Multimodal Interoperability & API Standardization
The core MaaS model, which connects metro rail, bus rapid transit, micro-mobility, ride-hailing, and intercity coach services through one platform, is limited by the lack of a universal API standard. Integrating 6–8 transport modes in a single metropolitan area often requires separate bilateral data agreements and custom middleware for each operator, consuming approximately 800–1,200 engineering hours per integration.
In India and ASEAN, the challenge is compounded by the co-existence of legacy magnetic-stripe ticketing systems, newer NFC/QR-code validators, and entirely non-digitized informal paratransit networks. UITP (Union Internationale des Transports Publics) estimates that fewer than 35% of bus operators in South and Southeast Asia have digitized their scheduling and real-time vehicle location data to a standard that can be consumed by a third-party API.
Until a regulatory mandate similar to the EU’s Delegated Regulation on multimodal travel information services is replicated in high-growth emerging markets, MaaS platforms will be structurally forced to trade breadth of integration for depth of reliability, limiting the total addressable trip occasions they can serve to an estimated 40–55% of the full multimodal journey universe in any given city, directly constraining revenue-per-platform scaling.
Opportunities
| Opportunity | (~) % CAGR | Geographic Relevance | Execution Window |
|---|---|---|---|
| Corporate MaaS Subscription & B2B Mobility Benefits | +3.5% | North America, EU, India, Japan | Short term (≤ 2 years) |
| Autonomous Vehicle Fleet Integration | +2.8% | North America, China, EU | Long term (≥ 4 years) |
| Tier-2 & Tier-3 City Market Penetration | +2.3% | India, Southeast Asia, Africa | Medium term (2–4 years) |
| EV Fleet Monetization within MaaS Platforms | +1.9% | India, China, EU, Southeast Asia | Medium term (2–4 years) |
| In-Platform Fintech & Ancillary Revenue Stacking | +1.6% | South Asia, Southeast Asia, Latin America | Medium term (2–4 years) |
| MaaS-as-Infrastructure for Smart City Concessions | +1.2% | Middle East, India, Southeast Asia | Long term (≥ 4 years) |
Corporate MaaS Subscription & B2B Mobility Benefits
The corporate mobility benefits segment represents the largest near-term white space in the MaaS revenue architecture because it remains almost entirely unmonetized today: the vast majority of enterprise employers globally still provide mobility benefits in the form of company car allowances, fixed fuel reimbursements, or static annual transit passes, none of which generate platform-level data.
The post-2023 normalization of hybrid work across North America, the EU, and India’s IT corridor cities has made fixed employee transport fleets less efficient, as weekly commuting patterns can vary by 3–5x. Corporate MaaS subscriptions allow employers to purchase pooled mobility credits at rates typically 15–25% below retail prices, while employees can use these credits across integrated transport modes.
Corporate MaaS accounts can generate average contract values approximately 8–12x higher than individual subscriptions, with enterprise agreements lasting 12–36 months compared with month-to-month consumer plans. These accounts can also improve asset utilization for fleet and infrastructure partners by an estimated 20–30%. Juniper Research projected that by 2027, up to 65% of global MaaS revenue could be generated through subscription models.
Key Players Analysis
Uber Technologies Inc. and Lyft Inc. are the leading Tier-1 companies in the Mobility as a Service market due to their large revenue base and strong platform reach. Uber reported USD 44.0 billion in total revenue in FY2024, up 18% from 2023. Its Mobility business contributed more than USD 25 billion, while Delivery generated around USD 13.75 billion.
In Q4 2024, Mobility revenue reached USD 6.91 billion, rising 25% year over year, supported by USD 22.8 billion in gross bookings. Lyft generated USD 5.79 billion in full-year 2024 revenue, up 31%, and recorded USD 22.8 million in net income compared with a loss of more than USD 340 million in 2023. Uber is estimated to account for around 35% to 40% of MaaS platform revenue, while Lyft holds approximately 5% to 10%.
Tier-2 companies include Moovit, Citymapper, MaaS Global, uBIgO, SkedGo, Moovel, and Communauto. Intel acquired Moovit in 2020 for about USD 915 million, including USD 638 million in goodwill and USD 331 million in intangible assets. These companies likely hold less than 10% of market revenue but remain important providers of journey planning, ticketing, billing, mobility data, and white-label MaaS software.
Top Key Players in the Market
- Lyft Inc.
- Moovit Inc.
- Uber Technologies Inc
- Communauto Inc.
- Citymapper Ltd
- MaaS Global Oy
- uBIgO Innovation AB
- SkedGo Pty Ltd.
- Moovel Group GmbH
- Other Key Players
Recent Developments
- In February 2026, Uber Technologies Inc. reported Q4 2025 revenue of USD 14.4 billion, up 20% year over year. Gross bookings increased by 22% to USD 54.1 billion, while the platform completed 3.8 billion trips during the quarter. Operating income also rose by 130% to USD 1.8 billion, strengthening Uber’s ability to invest in platform expansion, autonomous mobility, and new MaaS services.
- In February 2025, Uber reported FY2024 revenue of USD 43.98 billion, representing an 18% annual increase. Q4 revenue reached USD 11.96 billion, while total gross bookings rose by 18% to USD 44.20 billion. The company completed 11.27 billion trips during 2024, highlighting the scale and growing use of its global mobility platform.
- In February 2025, Lyft reported FY2024 revenue of USD 5.79 billion, compared with USD 4.40 billion in 2023. Q4 gross bookings reached approximately USD 4.3 billion, while annual net income improved to USD 22.8 million from a USD 340.3 million loss in 2023. This improvement strengthened Lyft’s position in the North American MaaS market.
Report Scope
| Report Features | Description |
|---|---|
| Market Value (2025) | USD 309.20 Billion |
| Forecast Revenue (2035) | USD 1784.80 Billion |
| CAGR (2026-2035) | 19.2% |
| Base Year for Estimation | 2025 |
| Historic Period | 2020-2024 |
| Forecast Period | 2026-2035 |
| Report Coverage | Revenue Forecast, Market Dynamics, Competitive Landscape, Recent Developments |
| Segments Covered | By Services (Ride-hailing, Ride-sharing, Micromobility, Public Transport, Other); By Solution (Journey Planning & Management, Payment, Booking & Ticketing, Application Technology, Other); By Business Model (Business-To-Business, Business-To-Consumers, Peer-To-Peer); By Transportation Type (Private, Public); By Propulsion Type (Internal Combustion Engine (ICE) Vehicle, Electric Vehicle (EV), Compressed Natural Gas (CNG)/Liquefied Petroleum Gas (LPG) Vehicle); By Operating System (Android, iOS, Others); By Commute Type (Daily, Occasionally) |
| Regional Analysis | North America – US, Canada; Europe – Germany, France, The UK, Spain, Italy, Rest of Europe; Asia Pacific – China, Japan, South Korea, India, Australia, Singapore, Rest of APAC; Latin America – Brazil, Mexico, Rest of Latin America; Middle East & Africa – GCC, South Africa, Rest of MEA |
| Competitive Landscape | Lyft Inc., Moovit Inc., Uber Technologies Inc, Communauto Inc., Citymapper Ltd, MaaS Global Oy, uBIgO Innovation AB, SkedGo Pty Ltd., Moovel Group GmbH, Other Key Players |
| Customization Scope | Customization for segments and region/country-level will be provided. Moreover, additional customization can be done based on the requirements. |
| Purchase Options | We have three licenses to opt for: Single User License, Multi-User License (Up to 5 Users), Corporate Use License (Unlimited Users and Printable PDF) |





























