


Report Overview
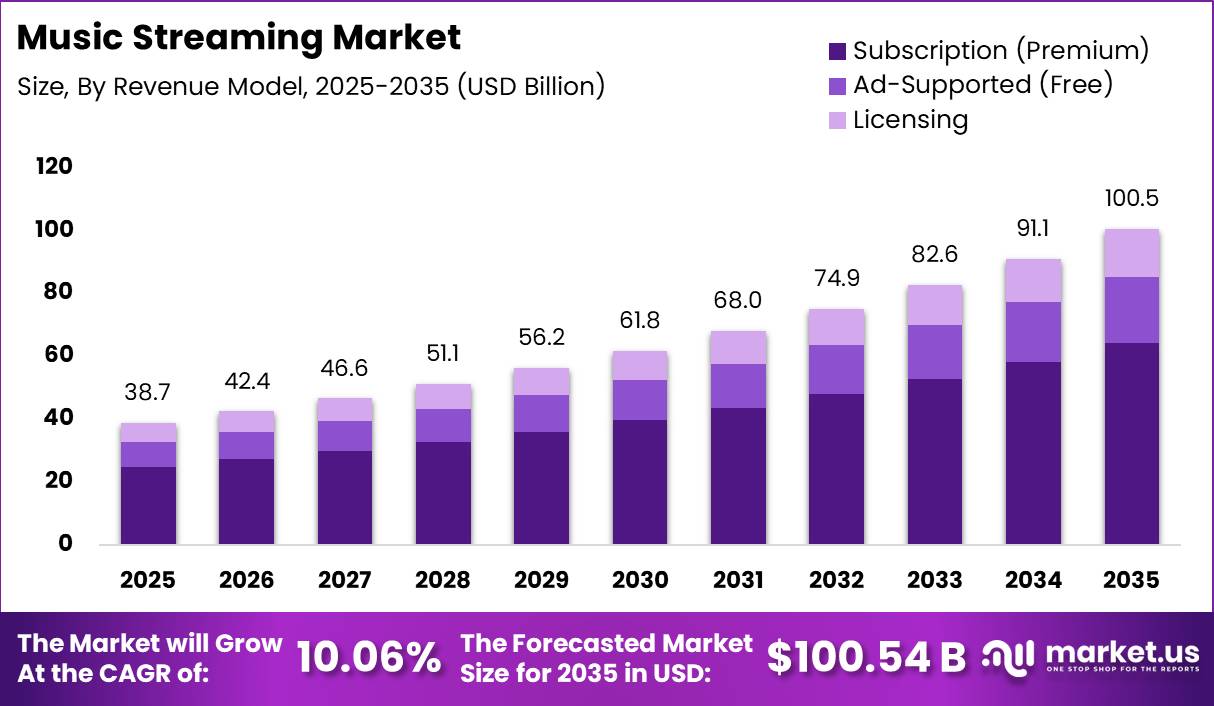
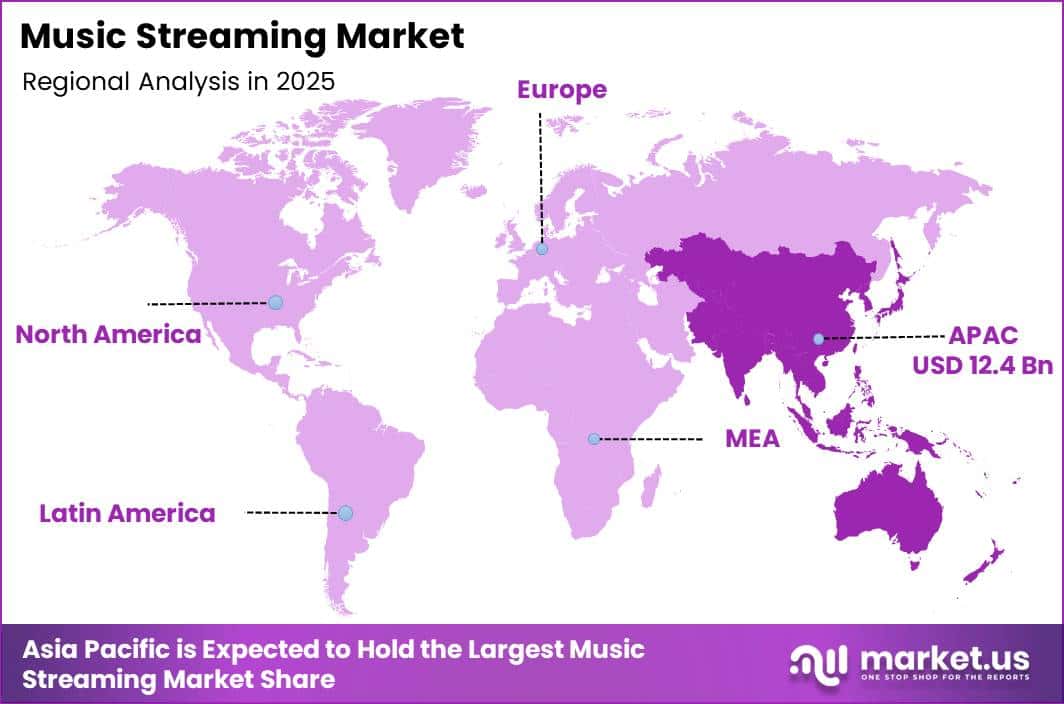
In 2025, the Global Music Streaming Market was valued at USD 38.6 billion. The market is projected to grow at a CAGR of 10.0% during 2026–2035, reaching approximately USD 100.5 billion by 2035. Asia Pacific dominated the global market in 2025, accounting for more than 32.0% of the total market share and generating approximately USD 12.4 billion in revenue.
Paid subscription streaming revenue increased by 8.8%, while the number of paid streaming accounts rose to 837 million. These figures show that subscription-based digital listening has become a major revenue source for the global music industry. According to the International Telecommunication Union, approximately 6 billion people, representing 74% of the global population, used the internet in 2025.
Internet penetration in Asia Pacific reached 77%, creating a large consumer base for mobile and on-demand music services. Supported by these trends. Asia Pacific region benefits from a large young population, increasing smartphone ownership, improving internet connectivity, affordable mobile data, and rising demand for digital entertainment.
Key Takeaway
- The Global Music Streaming Market is valued at USD 38.6 billion in 2025, projected to reach USD 100.5 billion by 2035 at a CAGR of 10.06%.
- The Subscription (Premium) model led revenue with approximately a 64.0% share.
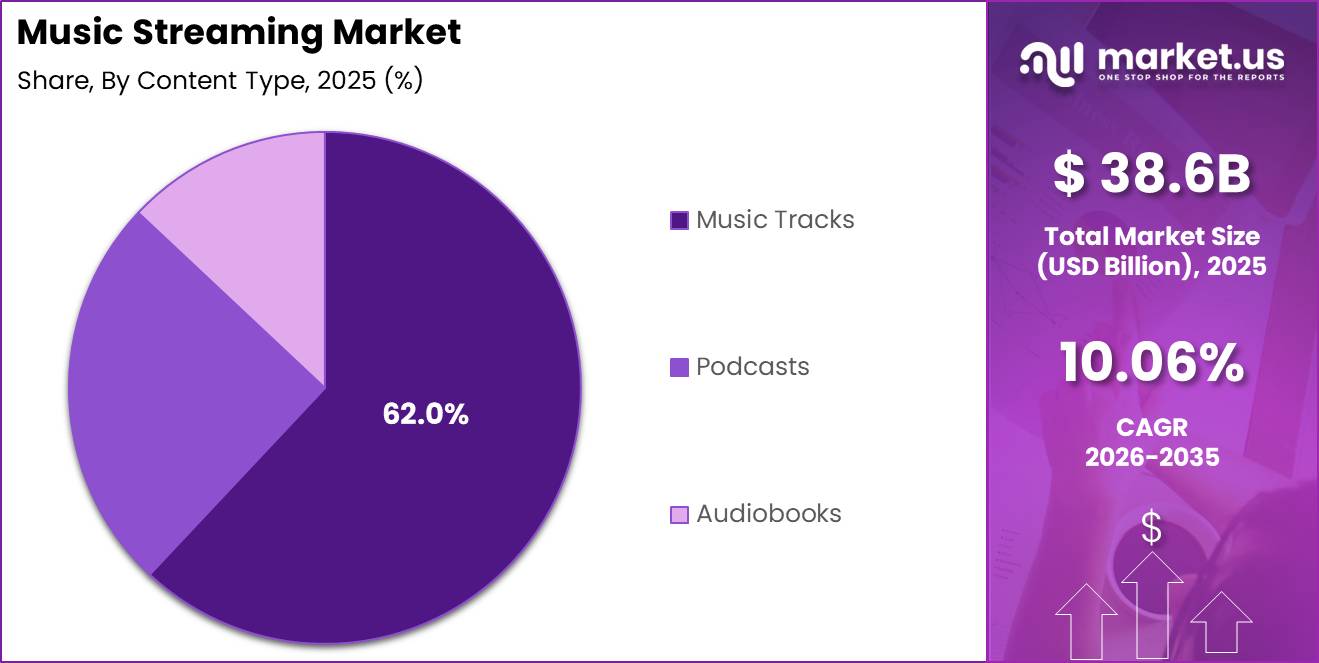
- Music tracks dominated content type with approximately a 62.0% share, while podcasts emerged as the fastest-growing category.
- Smartphones led the device segment with approximately 62.0% of usage; smart speakers are the fastest-growing device type.
- Individual consumers accounted for approximately 72.0% of demand, with Gen Z as the fastest-growing user group.
- Asia Pacific led the market in 2025 with more than a 32.0% share and USD 12.4 billion in revenue.
By Revenue Model
The Subscription or Premium model leads the music streaming market, accounting for approximately 64.0% of total revenue. Its strong position is supported by the music industry’s shift from physical sales and digital downloads toward recurring online access.
Premium subscriptions are also gaining faster adoption across smartphones, smart televisions, connected speakers, and in-car entertainment systems. Major device manufacturers distribute hundreds of millions of connected products each year, many of which include pre-installed music applications, promotional plans, or free trial periods.
By Content Type
Music tracks are the leading content type in the music streaming market, accounting for approximately 62.0% of total streaming content. Their strong position is supported by frequent and repeated listening across smartphones, smart speakers, televisions, cars, gyms, workplaces, retail stores, and hospitality locations.
Podcasts are emerging as the fastest-growing content category across connected devices. According to the Interactive Advertising Bureau, podcast advertising revenue reached approximately USD 2.9 billion in 2025, increasing by 17.6% year over year. In comparison, broader digital audio advertising revenue reached USD 8.4 billion and grew by 10.2%. This stronger growth highlights the rising commercial value of podcast content.
By Device
Smartphones are the leading device segment in the music streaming market, accounting for approximately 62.0% of total usage. Their strong position is supported by widespread ownership, continuous mobile internet access, and easy availability of streaming applications.
In 2025, the International Telecommunication Union estimated that global mobile cellular subscriptions reached 9.2 billion, equal to 112 subscriptions per 100 people. Mobile broadband subscriptions also reached nearly 99 per 100 people, allowing users to stream music wherever reliable network coverage is available.
In addition, global smartphone shipments reached approximately 1.2 billion units in 2025, according to IDC. This large supply of updated and app-ready devices supports high-quality audio, background playback, offline listening, and subscription activation.
By End User
Individual consumers are the leading end-user segment in the music streaming market, accounting for approximately 72.0% of total demand. This strong position reflects the personal nature of music streaming, as users mainly listen through smartphones, computers, headphones, smart speakers, and other connected devices.
According to the United Nations, the global population aged 15–24 is approximately 1.2 billion, representing nearly 16% of the world’s population. Gen Z, broadly covering users aged 15–25, is expected to be the fastest-growing consumer group. Online formats such as streaming music, podcasts, and music video services already account for more than half of total audio time among many younger listeners.
Key Market Segments
By Revenue Model
- Subscription (Premium)
- Individual Plans
- Family / Duo Plans
- Student Plans
- Ad-Supported (Free)
- Audio Ads
- Video Ads
- Licensing
By Content Type
- Music Tracks
- Pop / Rock
- Hip-Hop / R&B
- Classical / Jazz
- Regional Music
- Podcasts
- Talk Shows
- True Crime / News
- Audiobooks
By Device
- Smartphones
- Android Devices
- iOS Devices
- Smart Speakers
- PCs / Laptops
- Smart TVs
- Wearables
By End User
- Individual Consumers
- Millennials (26–41)
- Gen Z (15–25)
- Gen X & Boomers
- Commercial / Business
- In-Store / Retail
- Fitness / Wellness
- Hospitality
Geopolitical Impact Analysis
Geopolitical tensions are increasing operating and infrastructure costs across the music streaming ecosystem. According to the WTO, global trade in goods and commercial services reached USD 32.2 trillion in 2025, rising by 4% after declining by 2% in 2023. However, higher tariffs and trade restrictions have increased the cost of smartphones, smart speakers, servers, storage systems, and network equipment used to deliver streaming services.
UNCTAD reported that ships redirected from the Red Sea and Suez Canal around the Cape of Good Hope faced an additional 10–14 days of travel. By late 2024, container freight rates increased by approximately 276% on Far East to Northern Europe routes and by 167% on Far East to Mediterranean routes. Insurance costs for ships passing through Bab al-Mandab also increased from around 0.07% of vessel value to between 0.5% and 0.7%.
These changes raise equipment prices, delay device launches, and slow network and data-center expansion. Energy price volatility creates further pressure because music streaming depends on power-intensive data centers and telecommunications networks. Since 2022, changing gas and electricity prices have increased operating costs for infrastructure providers.
UNCTAD also estimated that longer shipping routes increased average fuel costs by about 40% on major maritime routes. For streaming platforms, these pressures increase operating expenditure per streamed hour and capital expenditure per new subscriber. Higher costs can reduce the ability of platforms to offer discounted plans in emerging markets and may delay expansion, device partnerships, or promotional bundles.
Regional Analysis
Asia Pacific leads the global music streaming market with a 32.0% share, representing approximately USD 12.4 billion in revenue. Its strong position is supported by a large young consumer base, increasing smartphone use, affordable mobile data, and wider access to digital payment services. In 2025, internet penetration across Asia Pacific reached 77%, while mobile network coverage extended to approximately 99.1% of the regional population.
Regional content investment is also supporting market expansion. Streaming providers are adding local-language catalogs, personalized playlists, telecom bundles, and links with super apps and short-video platforms. IFPI reported that recorded music revenue in Asia increased by 10.9% in 2025. China recorded growth of 20.1%, while Japan expanded by 8.9%, highlighting strong consumer spending across major Asian music markets.
The region’s digital infrastructure will continue to strengthen future streaming demand. GSMA expects Asia Pacific to reach 1.8 billion mobile internet users by 2030, while 5G is projected to represent 50% of regional mobile connections. These developments are expected to improve audio quality, increase listening time, and support premium subscription growth, reinforcing Asia Pacific’s position as a major revenue and subscriber growth centre.
Key Regions and Countries
North America
- US
- Canada
Europe
- Germany
- France
- The UK
- Spain
- Italy
- Rest of Europe
Asia Pacific
- China
- Japan
- South Korea
- India
- Australia
- Rest of APAC
Latin America
- Brazil
- Mexico
- Rest of Latin America
Middle East & Africa
- GCC
- South Africa
- Rest of MEA
Market Dynamics
Drivers
| Driver | (~) % CAGR | Geographic Relevance | Impact Timeline |
|---|---|---|---|
| Smartphone Proliferation & Mobile-First Internet Access | +2.8% | Asia-Pacific, Sub-Saharan Africa, Latin America | Short term (≤ 2 years) |
| Paid Subscription Base Expansion & ARPU Uplift | +2.2% | North America, Western Europe, Australia | Short term (≤ 2 years) |
| AI-Driven Personalization & Recommendation Engines | +1.8% | Global | Medium term (2–4 years) |
| Lossless & Spatial Audio Premium Tier Adoption | +1.4% | North America, East Asia, Western Europe | Short term (≤ 2 years) |
| Creator Economy Integration & Direct Artist Monetization | +1.0% | Global, led by North America & Southeast Asia | Medium term (2–4 years) |
| Ad-Supported Free Tier Growth Fueled by Digital Ad Spend | +0.86% | Emerging Markets, South & Southeast Asia | Short term (≤ 2 years) |
Smartphone Proliferation & Mobile-First Internet Access
The single most structurally powerful driver of music streaming growth is the ongoing convergence of affordable smartphones and mobile broadband rollout across previously underpenetrated geographies. As of 2025, mobile broadband accounts for the dominant share of internet access in lower-income economies.
Paid streaming subscriptions grew globally by 10.6% in 2024, with the majority of incremental subscriber additions sourced from Asia-Pacific, Latin America, and the Middle East & Africa markets where mobile is the primary (often sole) access channel. By 2026, the majority of global streaming platform users are concentrated in emerging markets, up from a minority in 2020, fundamentally altering platform economics.
Platforms able to price-tier their subscriptions to local purchasing power parity, deploying micro-bundle models at sub-$3/month price points are compressing payback periods to under 18 months per net-new subscriber, meaningfully improving unit economics relative to developed-market cohorts where blended ARPU growth is driven primarily by price hikes rather than volume.
Restraints
| Restraint | (~) % CAGR | Geographic Relevance | Impact Timeline |
|---|---|---|---|
| Royalty Rate Escalation & Label Licensing Cost Pressure | -2.4% | Global, concentrated in US & EU | Short term (≤ 2 years) |
| Subscription Fatigue & Elevated Monthly Churn | -1.6% | North America, Western Europe | Short term (≤ 2 years) |
| Regulatory Scrutiny on Platform Market Concentration | -1.0% | European Union, United Kingdom | Medium term (2–4 years) |
| Currency Volatility Compressing Emerging Market Revenue Repatriation | -0.7% | Latin America, South Asia, Sub-Saharan Africa | Short term (≤ 2 years) |
| Data Localization & Content Licensing Fragmentation Laws | -0.5% | India, Indonesia, Brazil, Russia | Medium term (2–4 years) |
Royalty Rate Escalation & Label Licensing Cost Pressure
The most acute structural restraint on music streaming margin and reinvestment capacity is the persistent escalation of mechanical and performance royalty obligations enforced through legislative, judicial, and negotiated channels. The Copyright Royalty Board’s Phonorecords IV determination covering the 2018–2022 period mandated a mechanical royalty rate increase of approximately 44% over five years for interactive streaming, rising from 10.5% to 15.1% of service revenue or a per-stream rate.
In the European Union, the 2025 European Parliament resolution on fairer music streaming revenue distribution has tightened the regulatory lens on label-to-artist pass-through ratios with available data from 2020–2024 showing streaming services retaining approximately 30% of proceeds, major labels capturing roughly 42%, publishers 5%, and artists collectively pocketing around 23% creating legislative momentum for rebalancing that would shift licensing cost burdens upward for platforms.
For mid-scale and challenger platforms operating on gross margins already compressed below 25%, any incremental royalty rate increase of 1–2 percentage points on the revenue share base translates directly into delayed infrastructure CapEx and reduced catalog licensing budgets for independent and regional content.
Challenges
| Challenge | (~) % CAGR | Geographic Relevance | Mitigation Horizon |
|---|---|---|---|
| AI-Generated Content Integrity & Royalty Fraud | -1.8% | Global | Medium term (2–4 years) |
| Last-Mile Connectivity Gaps in Tier-3 Markets | -1.2% | Sub-Saharan Africa, South Asia, Rural Southeast Asia | Long term (≥ 4 years) |
| Music Rights Metadata Fragmentation | -0.9% | Global, acute in Latin America & Southeast Asia | Long term (≥ 4 years) |
| Audio Piracy & Unauthorized Stream-Ripping | -0.7% | Eastern Europe, Southeast Asia, MENA | Medium term (2–4 years) |
| Talent Scarcity in AI & Audio Engineering | -0.5% | Global, concentrated in North America & Western Europe | Medium term (2–4 years) |
AI-Generated Content Integrity & Royalty Fraud
AI-generated audio has moved from a small experiment to a major content-integrity challenge for music streaming platforms. By mid-2026, AI-created tracks represented approximately one-third of daily uploads to major services but generated only around 0.5% of total streams.
Streaming companies must now invest heavily in AI detection, content labeling, and separate royalty-tracking systems. Detection tools capable of reviewing millions of uploads each day with false-negative rates below 5% may require teams of around 50–150 specialist machine-learning engineers. For large platforms, this could create annual capital expenditure of approximately USD 30–80 million.
Opportunities
| Opportunity | (~) % CAGR | Geographic Relevance | Execution Window |
|---|---|---|---|
| Audio Super-App Bundling (Podcasts, Audiobooks, Live Radio) | +2.6% | North America, Western Europe, East Asia | Short term (≤ 2 years) |
| Untapped Commercial & B2B Licensing Vertical | +1.5% | Global, led by Asia-Pacific & North America | Medium term (2–4 years) |
| Virtual & Immersive Concert Streaming Integration | +1.2% | North America, South Korea, Japan | Medium term (2–4 years) |
| Hyperlocal Regional Language Content Monetization | +1.0% | India, Southeast Asia, Africa, MENA | Medium term (2–4 years) |
| In-Car & Connected Device Ecosystem Expansion | +0.8% | North America, Western Europe, China | Long term (≥ 4 years) |
| Blockchain-Enabled Direct Artist-to-Fan Royalty Channels | +0.6% | Global, early adoption in North America & Western Europe | Long term (≥ 4 years) |
Audio Super-App Bundling (Podcasts, Audiobooks, Live Radio)
The music streaming market still has an untapped opportunity because most platforms treat music as the main service, while podcasts, audiobooks, and live radio operate as separate features. A unified audio platform could combine all formats under one subscription, search system, and personalization engine.
Multi-format platforms also offer stronger customer retention. Services that release content regularly across several audio formats record around 18–22% lower monthly churn than single-format platforms. This is increasingly important because monthly music streaming churn increased from 2% in 2019 to 5.5% by early 2025, while annual audio streaming churn reached approximately 12%.
The financial benefit is also significant. Retaining one subscriber for an additional 6 months at an average revenue per user of USD 11–14 per month can generate an additional USD 66–84 in customer lifetime value. The delivery cost remains near-zero once content rights are secured. Building a complete audio super-app will require content licensing, acquisitions, unified platform design, cross-format recommendation technology, and new agreements with publishers and podcast networks.
Key Players Analysis
Tier-1 companies in the music streaming market include Spotify, Apple Music, YouTube Music, and Amazon Music. Spotify generated €15.67 billion, or approximately USD 17 billion, in 2024. Premium subscriptions contributed €13.82 billion, representing 88% of revenue, supported by more than 260 million subscribers across 184 markets.
Spotify held an estimated 30–35% share of global paid music subscriptions. Apple’s Services revenue increased from USD 78.1 billion in 2023 to USD 85.2 billion in FY 2024. Apple also reported more than 1 billion paid subscriptions across its services, while Apple Music’s subscriber base is estimated in the high tens of millions. Alphabet’s YouTube business generated more than USD 40 billion in 2024, while YouTube Premium and YouTube Music exceeded 100 million subscribers in early 2024.
Amazon recorded USD 44.9 billion in subscription-services revenue and benefits from a Prime membership base of more than 200 million. Tier-2 platforms include Tencent Music Entertainment, Pandora, Deezer, SoundCloud, Tidal, iHeartRadio, Anghami and Gaana. Tencent Music generated RMB 21.7 billion, approximately USD 3.0 billion, from online music services in 2024.
Subscription revenue reached RMB 15.2 billion, or nearly USD 2.1 billion, supported by 121 million paying users. SiriusXM generated USD 8.7 billion, including around USD 2.1 billion from Pandora and off-platform streaming. Tier-2 companies generally hold low- to mid-single-digit global shares and collectively represent about 20–25% of revenue, while tier-1 platforms control nearly 70–75%.
Top Key Players in the Market
- Spotify Technology
- Apple Music
- Amazon Music
- YouTube Music (Google)
- Tencent Music
- Deezer
- SoundCloud
- Tidal
- Pandora (SiriusXM)
- iHeartRadio
- Anghami
- Gaana (Times Internet)
Recent Developments
- In 2026, IFPI reported that global recorded music revenue reached USD 31.7 billion in 2025, increasing by 6.4% year on year. Streaming services, including paid subscriptions and advertising-supported platforms, contributed nearly 70% of total industry revenue. Paid subscription streaming alone accounted for 52.4%, equivalent to approximately USD 16.6 billion.
- In 2025, Spotify generated more than EUR 17 billion, approximately USD 18–19 billion, in annual revenue. Its monthly active user base reached around 750 million, while paid subscribers increased to approximately 263 million.
Report Scope
| Report Features | Description |
|---|---|
| Market Value (2025) | USD 38.6 Billion |
| Forecast Revenue (2035) | USD 100.5 Billion |
| CAGR (2026-2035) | 10.06% |
| Base Year for Estimation | 2025 |
| Historic Period | 2020-2024 |
| Forecast Period | 2026-2035 |
| Report Coverage | Revenue Forecast, Market Dynamics, Competitive Landscape, Recent Developments |
| Segments Covered | By Revenue Model (Subscription/Premium, Ad-Supported/Free, Licensing), By Content Type (Music Tracks, Podcasts, Audiobooks), By Device (Smartphones, Smart Speakers, PCs/Laptops, Smart TVs, Wearables), By End User (Individual Consumers, Commercial/Business) |
| Regional Analysis | North America – US, Canada; Europe – Germany, France, The UK, Spain, Italy, Rest of Europe; Asia Pacific – China, Japan, South Korea, India, Australia, Singapore, Rest of APAC; Latin America – Brazil, Mexico, Rest of Latin America; Middle East & Africa – GCC, South Africa, Rest of MEA |
| Competitive Landscape | Spotify Technology, Apple Music, Amazon Music, YouTube Music (Google), Tencent Music, Deezer, SoundCloud, Tidal, Pandora (SiriusXM), iHeartRadio, Anghami, Gaana (Times Internet) |
| Customization Scope | Customization for segments, region/country-level will be provided. Moreover, additional customization can be done based on the requirements. |
| Purchase Options | We have three licenses to opt for: Single User License, Multi-User License (Up to 5 Users), Corporate Use License (Unlimited Users and Printable PDF) |





























