


Report Overview
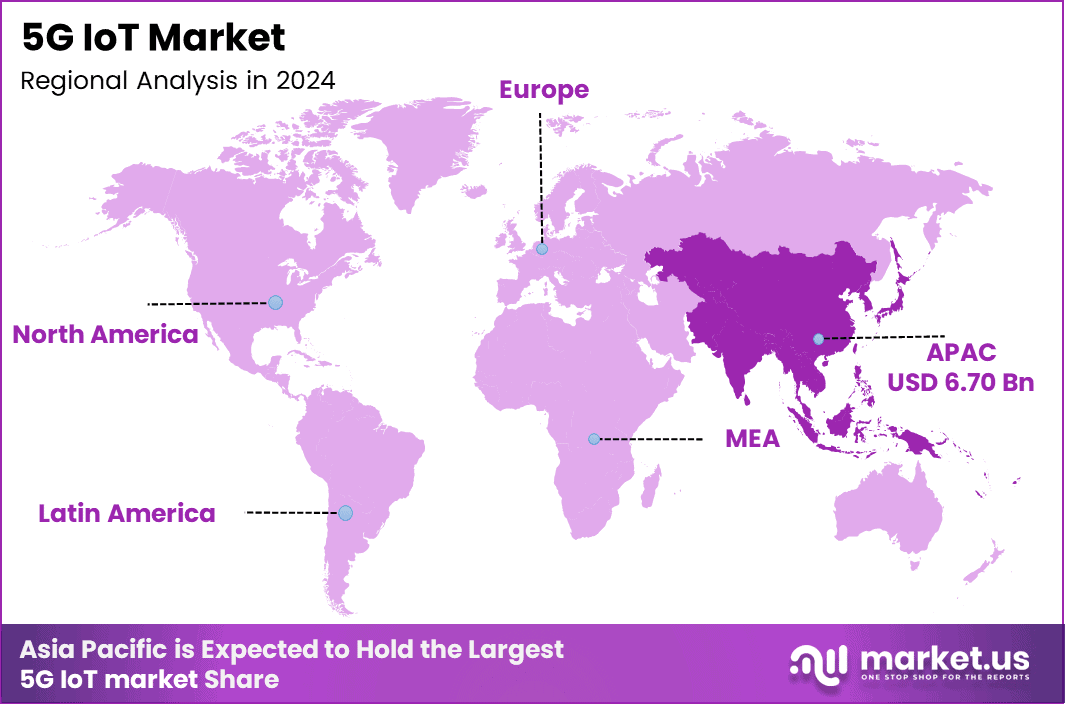
In 2024, the Global 5G IoT Market was valued at USD 14.9 billion. The market is projected to grow at a CAGR of 39.2% during 2025–2034, reaching approximately USD 406.7 billion by 2034. Asia Pacific dominated the global market in 2024, accounting for a significant share of the total market and generating approximately USD 6.7 billion in revenue.
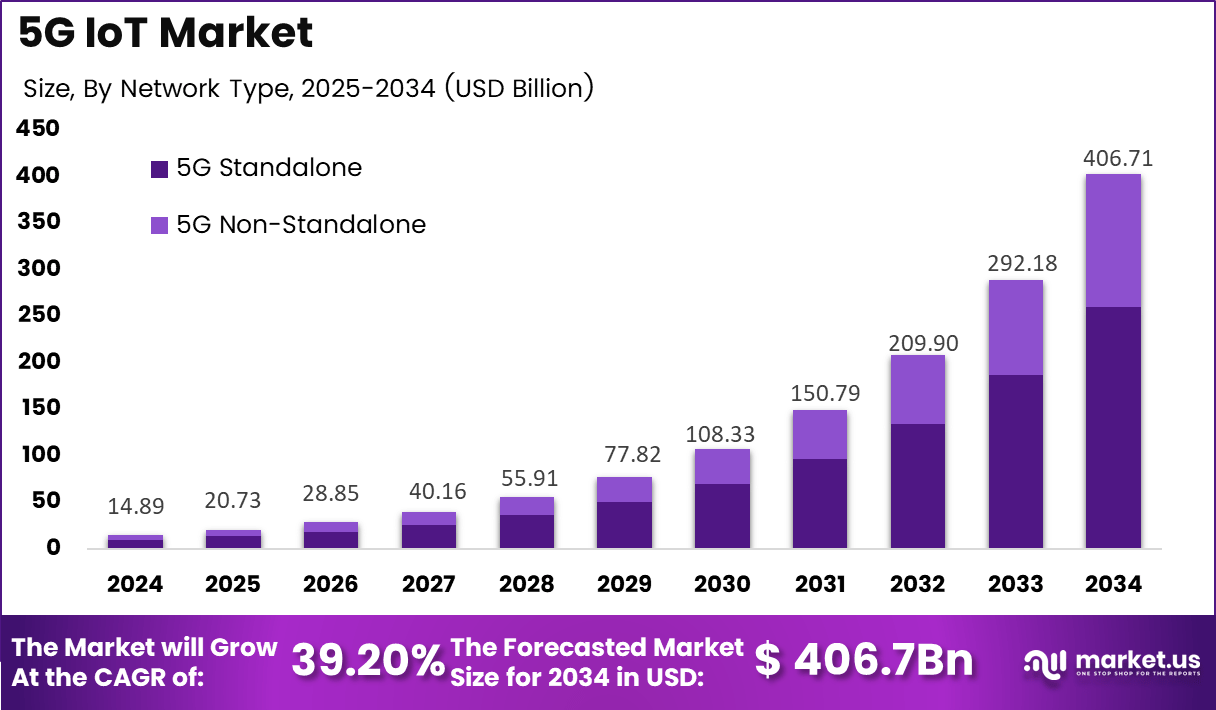
The market’s expansion is attributed to the rapid proliferation of connected devices across various sectors, such as manufacturing, healthcare, smart cities, and transportation. The shift toward 5G Standalone networks, which offer superior performance compared to non-standalone versions, is expected to enhance the efficiency of IoT applications.
The 5G IoT Market brings together advanced wireless networks and connected devices to enable seamless data exchange across industries. It focuses on leveraging the speed and low latency of 5G technology to power everything from smart sensors in factories to remote monitoring in healthcare. This market thrives on the integration of billions of devices that communicate in real time, transforming how businesses operate and cities function.
Key Takeaways
- The global 5G IoT Market was valued at USD 14.89 billion in 2024.
- The global 5G IoT Market is projected to grow at a CAGR of 39.2% and is estimated to reach USD 406.7 billion by 2034.
- On the basis of component, the hardware segment dominated the market, accounting for 52% of the total market share.
- Based on network type, the 5G Non-Standalone segment dominated the market, accounting for 64% of the total market share.
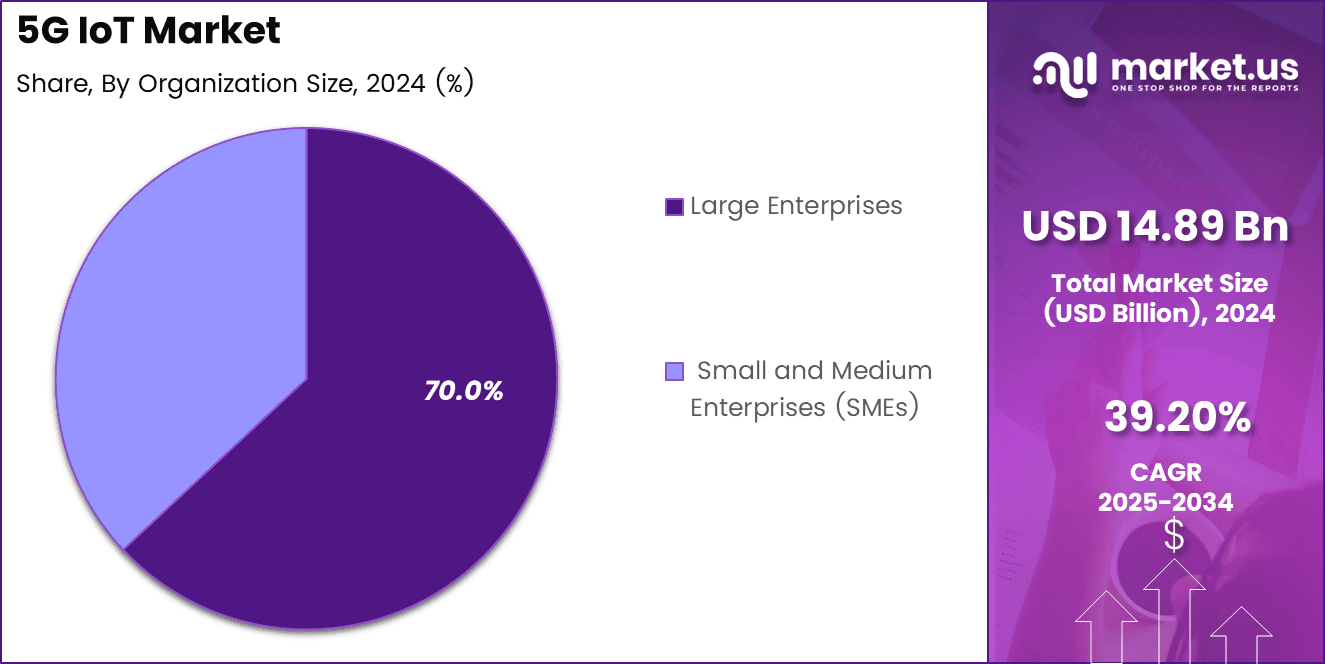
- By organization size, the large enterprises segment dominated the market, accounting for 70% of the total market share.
- On the basis of type, the wide-range IoT devices segment dominated the market, accounting for 57% of the total market share.
- By end-user, the manufacturing segment dominated the market, accounting for 30% of the total market share.
- In 2024, Asia Pacific was the most dominant region in the 5G IoT Market, generating approximately USD 6.7 billion in revenue.
Analysts’ Viewpoint
The 5G IoT market is expected to evolve rapidly in the coming decade, with several key trends shaping its growth. 5G Standalone networks are predicted to dominate, accounting for 60% of the total market by 2034, driven by their ability to support advanced IoT use cases such as autonomous vehicles, smart cities, and real-time industrial monitoring. Furthermore, hardware remains the largest component, expected to hold 45% of the market share by 2034, driven by the demand for IoT devices across industries.
While large enterprises currently account for the majority of the market share, there is a significant opportunity for SMEs to capture a larger share as IoT solutions become more affordable and scalable. The healthcare sector is also predicted to experience substantial growth, reaching 20% of the total IoT market by 2034 as demand for remote monitoring and connected devices increases. Edge computing is another key enabler of this growth, with expected adoption rates of 28% by 2029.
The US market will continue to lead, but the APAC region will see the fastest growth due to substantial investments in smart cities and manufacturing IoT applications. With the market projected to reach USD 6.7 billion in APAC by 2024, this region is anticipated to contribute heavily to the global market expansion.
Regional Analysis
In the APAC region, the market for 5G IoT in 2024 is valued at approximately USD 6.7 billion. This market is expected to experience strong growth, driven by the rapid digital transformation in countries like China, Japan, and South Korea. With the expansion of 5G networks and IoT applications across various industries, such as manufacturing, healthcare, and smart cities, APAC is positioned to maintain a dominant role in the global 5G IoT market.
The rapid adoption of IoT technologies, coupled with the ongoing rollout of 5G infrastructure, is expected to propel the region’s market size further in the coming years. China is the largest market within APAC, leading the way in terms of investment and technological advancement in 5G IoT solutions.
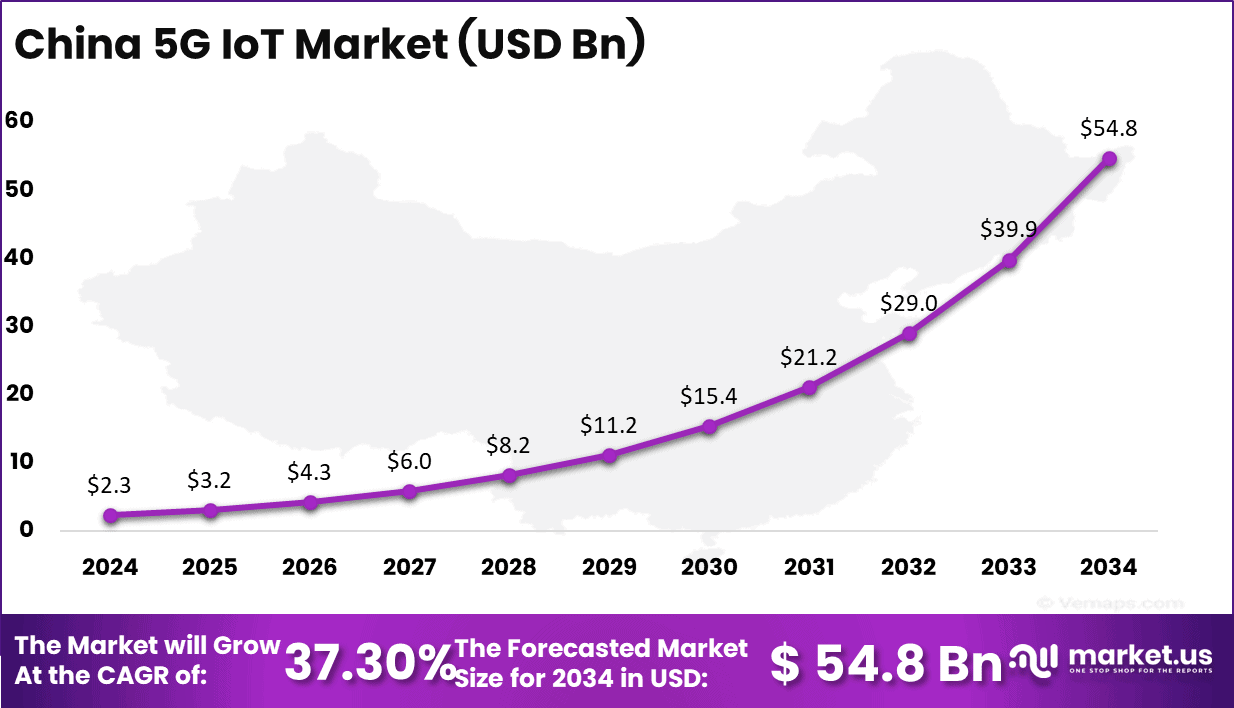
The combination of the China 5G IoT market and the broader APAC region highlights a significant growth trajectory, with the expected CAGR of 37.3% in China contributing to a major portion of the regional expansion. As the region becomes more connected and innovative, this market is likely to see continued investment and technological breakthroughs.
China Market Size
The growth trajectory is notable, with the market expanding rapidly each year, from USD 2.3 billion in 2024 to USD 54.8 billion by 2034. By 2030, it is expected to cross USD 15 billion, reflecting strong adoption across sectors. The forecasted size of the market for 2034 is USD 54.8 billion, showcasing the immense potential of 5G IoT applications in China.
Key Regions and Countries
North America
- US
- Canada
Europe
- Germany
- France
- The UK
- Spain
- Italy
- Rest of Europe
Asia Pacific
- China
- Japan
- South Korea
- India
- Australia
- Rest of APAC
Latin America
- Brazil
- Mexico
- Rest of Latin America
Middle East & Africa
- GCC
- South Africa
- Rest of MEA
By Component
In 2025, Hardware held a dominant market position, capturing more than a 52% share. This strength traces back to the sheer physical footprint of 5G IoT deployment, since every connected sensor, gateway, module, and antenna needs a physical unit before any software layer can even function.
Global cellular IoT module shipments climbed 15% year-over-year through 2025, with volumes tied closely to component-level demand across chipsets, PCBs, and RF front-end parts. Momentum picked up sharply in the second quarter of 2025, when shipments grew 17% year-over-year, marking the sector’s sixth straight quarter of growth.
China and India kept extending that streak, while Latin America posted 32% year-over-year growth in the same quarter, showing that hardware demand is no longer concentrated in a single region. Within that mix, 5G-specific shipments jumped 57% year-over-year, led by routers, CPEs, laptops, and automotive units.
By Network Type
In 2025, 5G Non-Standalone held a dominant market position, capturing more than a 64% share. Operators favor this architecture because it lets them light up 5G radio access on top of existing 4G core infrastructure, cutting both cost and rollout time considerably.
By December 2025, GSA had tracked 181 operators across 73 countries actively investing in standalone 5G networks, yet only 89 had actually gone live with public standalone service, underlining how many carriers still lean on non-standalone setups for day-to-day traffic.
By Organization Size
In 2025, Large Enterprises held a dominant market position, capturing more than a 70% share. Bigger organizations have the budgets, IT staff, and long-term infrastructure plans needed to justify dedicated 5G rollouts across sprawling facilities, warehouses, and supply chains. A June 2025 industry survey found that 88% of U.S. businesses now consider 5G “critical” to running AI workloads effectively inside their operations.
Separately, 76% of enterprises piloting private 5G networks reported a 45% improvement in operational efficiency alongside a 60% cut in network latency, results that mainly showed up among firms with the scale to run full pilot programs. In manufacturing specifically, 68% of enterprises had already deployed private 5G by 2025, cutting production downtime by roughly 40% while enabling real-time video-based quality checks on the factory floor.
By Type
In 2025, Wide-Range IoT Devices held a dominant market position, capturing more than a 57% share. These devices, which span broadband-capable sensors, cameras, and industrial terminals rather than narrow single-function gadgets, are benefiting from a broader connected-device boom.
Total connected IoT devices worldwide grew 14% year-over-year to reach 21.1 billion by the end of 2025, up from 18.5 billion the year before. Analysts expect that figure to climb to 39 billion by 2030, reflecting sustained double-digit annual growth. A big driver has been LTE Cat.1 bis, which expanded to cover 63% of total cellular IoT module shipments in 2025 as legacy 2G and 3G networks shut down across several regions.
By End-User
In 2025, Manufacturing held a dominant market position, capturing more than a 30% share. Factories have become the proving ground for industrial 5G because they combine dense sensor networks, heavy machinery, and a genuine need for real-time data that older wireless standards simply can’t deliver reliably.
The global smart factory market reached roughly USD 132 billion in 2025, with penetration of smart factory technology surpassing 58% across large-scale manufacturing sites, particularly in automotive and electronics production lines. Automotive manufacturing specifically leaned on automation-intensive assembly lines, EV production expansion, and demand for digital twins to justify continued 5G-linked investment through the year.
China’s regulators reinforced this trend in 2025 by setting targets for RedCap coverage across county-level cities, aiming for industrial and logistics applications to each reach one million connections. As 2026 unfolds, expect manufacturing plants to keep pulling ahead of other end-user categories as robotics, predictive maintenance, and quality inspection systems scale further.
Key Market Segments
By Component
- Hardware
- Software
- Services
- Professional Services
- Consulting
- Deployment and Integration
- Support and Maintenance
- Managed Services
By Network Type
- 5G Standalone
- 5G Non-Standalone
By Organization Size
- Large Enterprises
- Small and Medium Enterprises (SMEs)
By Type
- Short-Range IOT Devices
- Wide-Range IOT Devices
By End-User
- Manufacturing
- Smart Cities
- Energy & Utilities
- Transportation & Logistics
- Enterprises/Corporates
- Healthcare
- Oil & Gas
- Others
Market Dynamics
Drivers
| Driver | (~) % CAGR | Geographic Relevance | Impact Timeline |
|---|---|---|---|
| Massive device densification in smart infrastructure | +3.0% | North America, Europe, East Asia | Short term (≤ 2 years) |
| Industrial automation with ultra‑reliable 5G IoT | +2.2% | Global manufacturing hubs | Medium term (2–4 years) |
| Expansion of private 5G campuses | +1.5% | Developed markets | Medium term (2–4 years) |
| Low‑cost sensor and module availability | +1.0% | Global | Short term (≤ 2 years) |
| Policy support for digital and smart cities | +0.8% | Asia, Middle East, Europe | Medium term (2–4 years) |
Massive device densification in smart infrastructure
Root cause for this driver is the sharp increase in connected endpoints in smart infrastructure projects between 2022 and 2024, with city‑level deployments moving from roughly 0.2–0.3 million connected meters and cameras per metro area to upwards of 1–1.5 million devices, and grid operators reporting node densities approaching 10,000 sensors per square kilometer in pilot districts.
This device densification forces a shift from legacy LTE and wired telemetry to 5G IoT, as operators can no longer economically sustain per‑site backhaul and manual maintenance for fleets that often exceed 500,000 edge nodes per project; average data generation per device has risen from about 50–100 MB/day to 500 MB–1 GB/day for video and high‑frequency telemetry, which in turn drives demand for higher throughput and sub‑20 millisecond latency on the access network.
Commercially, this alters business models from one‑off equipment sales to recurring connectivity and device‑management contracts, with operators bundling connectivity, device lifecycle services, and analytics into per‑device subscriptions in the range of $0.30–$1.50 per month, improving recurring revenue visibility but also requiring upfront 5G radio and edge‑compute CapEx that can exceed 15–20% of annual infrastructure budgets.
The net effect is a meaningful lift to the baseline 8.0% CAGR while compressing margins on hardware but expanding blended EBITDA margins by roughly 2–3 percentage points on multi‑year service contracts.
Restraints
| Restraint | (~) % CAGR | Geographic Relevance | Impact Timeline |
|---|---|---|---|
| High 5G IoT deployment and spectrum costs | -2.8% | Global, especially emerging markets | Short term (≤ 2 years) |
| Fragmented regulatory and licensing regimes | -1.6% | Europe, Asia, Latin America | Medium term (2–4 years) |
| Enterprise risk aversion to mission‑critical migration | -1.4% | Global | Short term (≤ 2 years) |
| Persistent macro interest‑rate pressure on CapEx | -1.2% | North America, Europe | Short term (≤ 2 years) |
| Legacy infrastructure lock‑in in utilities | -0.8% | Developed markets | Medium term (2–4 years) |
High 5G IoT deployment and spectrum costs
The core restraint is the capital‑intensive nature of 5G IoT deployment, with national spectrum auctions in multiple regions between 2022 and 2024 clearing mid‑band licenses at effective costs of $0.10–$0.30 per MHz‑pop and private industrial licenses often requiring minimum commitments of 40–100 MHz over 10–15 years, pushing upfront obligations for operators and large enterprises into the hundreds of millions even before radio access equipment is procured.
On the network side, dense IoT rollouts in factories, ports, and campuses frequently demand small‑cell counts in the range of 200–500 sites per 10 square kilometers, with per‑site deployment costs (hardware, installation, integration) typically in the $8,000–$15,000 band, resulting in site‑level CapEx envelopes that can exceed $2–5 million for a single large facility. Quantitatively, this raises weighted average cost of capital by roughly 100–200 basis points for teleco
m and industrial issuers heavily exposed to 5G build‑outs, compressing project IRRs below internal hurdle rates of around 12–15% and delaying green‑lighting of IoT modernization programs; strategically, the combination of spectrum obligations and radio CapEx drives margin compression of 2–4 percentage points on connectivity offerings in the early years, forces deferral of broader 5G IoT launches into later budget cycles, and directly subtracts an estimated 2.8% from the market’s realizable CAGR relative to the baseline.
Challenges
| Challenge | (~) % CAGR | Geographic Relevance | Mitigation Horizon |
|---|---|---|---|
| Complex multi‑vendor interoperability | -2.4% | Global | Medium term (2–4 years) |
| Advanced cybersecurity and privacy exposure | -2.0% | Global | Long term (≥ 4 years) |
| Shortage of 5G IoT integration talent | -1.7% | North America, Europe, Asia | Medium term (2–4 years) |
| Edge computing orchestration complexity | -1.3% | Global | Long term (≥ 4 years) |
| Uncertain long‑term device lifecycle economics | -1.0% | Global | Long term (≥ 4 years) |
Complex multi‑vendor interoperability
This challenge stems from structural fragmentation in 5G IoT stacks, where enterprises often combine radio equipment, core network software, device modules, and management platforms from 4–7 distinct vendors, leading to integration projects that routinely exceed 12–18 months and require 20–40% more engineering hours than initially budgeted.
At the operational level, interoperability issues such as differing implementations of device management protocols, inconsistent support for network slicing, and proprietary APIs translate into failure rates of 3–5% per 10,000 devices during onboarding and average firmware update rollouts that take 4–6 weeks instead of the 1–2 weeks targeted, which depresses achievable device utilization and forces conservative scaling assumptions.
Quantitatively, these frictions add $20–$50 per device in integration and testing overhead on deployments that might otherwise target hardware BOMs below $15–$20, eroding project margins by 5–8 percentage points and pushing enterprises to cap the number of concurrently active IoT programs.
In response, corporates are investing in in‑house platform teams and standardized reference architectures, but these adjustments take multiple budget cycles to fully implement, leaving a persistent drag of around 2.4% on the market’s maximum growth potential relative to the technical ceiling.
Opportunities
| Opportunity | (~) % CAGR | Geographic Relevance | Execution Window |
|---|---|---|---|
| Monetized differentiated connectivity via 5G network slicing | +3.2% | Global | Medium term (2–4 years) |
| Vertical‑specific 5G IoT platforms for industries | +2.4% | Global | Long term (≥ 4 years) |
| Adjacency into AI‑driven analytics services | +1.8% | Global | Medium term (2–4 years) |
| Expansion into underserved emerging‑market enterprises | +1.5% | Asia, Africa, Latin America | Long term (≥ 4 years) |
| Lifecycle management and circular hardware models | +1.1% | Global | Long term (≥ 4 years) |
Monetized differentiated connectivity via 5G network slicing
This opportunity is untapped because most commercial 5G IoT deployments as of 2024 still rely on generic best‑effort connectivity, even though network slicing technology allows operators to carve out dedicated logical networks with guaranteed latency (often sub‑10 milliseconds), throughput (peak rates above 1 Gbps), and reliability profiles tailored to specific industrial or automotive workloads.
As operators move from flat per‑SIM tariffs of roughly $0.20–$0.80 per month to tiered slice‑based pricing where mission‑critical slices can command 30–70% premiums and ultra‑reliable slices for robotics or automated ports can exceed $2–$3 per device per month, unit economics shift markedly: effective ARPU per connected asset can rise by 40–60% while incremental opex for orchestration and monitoring adds only 5–10%, supporting margin expansion of 4–6 percentage points on connectivity lines.
Strategically, firms that invest in slice design, SLA enforcement, and vertical go‑to‑market can capture a sizable portion of unmet demand from customers currently over‑provisioning generic connectivity or maintaining redundant networks; the transition from commodity bandwidth to differentiated connectivity services thus adds an estimated upside of around 3.2% to the baseline 8.0% CAGR, without relying on new spectrum but rather on better monetization of existing infrastructure and software control planes.
Key Players Analysis
The 5G IoT market is divided between Tier-1 infrastructure and chipset leaders with large-scale advantages and Tier-2 specialists focused on modules and vertical platforms. Qualcomm leads the connectivity-silicon segment, reporting fiscal 2025 revenue of $44.3 billion, up 14% YoY, while QCT segment revenue reached $38.4 billion.
Qualcomm’s IoT business generated $6.6 billion in revenue, increasing 22% YoY. The company is also targeting combined Automotive and IoT revenue of $22 billion by FY29, reflecting its strategy to reduce dependence on the handset market.
Ericsson reported full-year 2025 sales of SEK 236.7 billion, equivalent to approximately $22 billion. Its adjusted EBITA margin increased to 18.1% from 11.0%, while R&D spending remained close to SEK 50 billion, supporting continued investment in AI-native and autonomous 5G networks.
Nokia’s Network Infrastructure sales increased 19% in Q4 2025 to EUR 2.407 billion, while full-year R&D expenditure rose 8% YoY to EUR 4.855 billion. Nokia is targeting a 6–8% net sales CAGR through 2028, with its Optical and IP Networks businesses expected to grow at 10–12% CAGR. Qualcomm therefore leads in IoT-specific silicon revenue, while Ericsson and Nokia, with infrastructure revenues of approximately $22 billion and $20 billion, remain central to the carrier-network layer.
Top Key Players
- Nokia Corporation
- TELEFONAKTIEBOLAGET LM ERICSSON
- ZTE Corporation
- AT&T INC.
- Huawei Technologies Co., Ltd.
- Verizon Communications Inc.
- Thales Group
- Vodafone Group Plc.
- China Mobile Limited
- Microsoft Corporation
- Samsung
- Cisco
- NEC Corporation
- Others
Recent Development
- In January 2025, Ericsson launched a new 5G IoT platform for industrial automation, enhancing edge processing that supports 30% faster device syncing in factories. This evolution targets Massive and Broadband IoT segments, enabling real-time operations at scale, reducing manual interventions by up to 40%, and boosting overall productivity through precise, sustainable automation.
- In March 2025, Nokia acquired a startup specializing in AI-driven IoT security, bolstering defenses against breaches and covering 40% more vulnerability types. Focused on OT and IoT for private 5G environments, it enhances real-time asset visibility and predictive maintenance, helping CSPs automate security while minimizing cyber risks in industrial settings by 35%, fostering resilient operations across complex infrastructures.
Report Scope
| Report Features | Description |
|---|---|
| Market Value (2024) | USD 14.9 Bn |
| Forecast Revenue (2034) | USD 406.7 Bn |
| CAGR (2025-2034) | 39.2% |
| Base Year for Estimation | 2024 |
| Historic Period | 2020-2023 |
| Forecast Period | 2025-2034 |
| Report Coverage | Revenue Forecast, Market Dynamics, Competitive Landscape, Recent Developments |
| Segments Covered | By Component (Hardware, Software, Services [Professional Services, Consulting, Deployment and Integration, Support and Maintenance, Managed Services]), By Network Type (5G Standalone, 5G Non-Standalone), By Organization Size (Large Enterprises, Small and Medium Enterprises (SMEs)), By Type (Short-Range IOT Devices, Wide-Range IOT Devices, By End-User, Manufacturing, Smart Cities, Energy & Utilities, Transportation & Logistics, Enterprises/Corporates, Healthcare, Oil & Gas, Others) |
| Regional Analysis | North America – US, Canada; Europe – Germany, France, The UK, Spain, Italy, Rest of Europe; Asia Pacific – China, Japan, South Korea, India, Australia, Singapore, Rest of APAC; Latin America – Brazil, Mexico, Rest of Latin America; Middle East & Africa – GCC, South Africa, Rest of MEA |
| Competitive Landscape | Nokia Corporation, TELEFONAKTIEBOLAGET LM ERICSSON, ZTE Corporation, AT&T INC., Huawei Technologies Co., Ltd., Verizon Communications Inc., Thales Group, Vodafone Group Plc., China Mobile Limited, Microsoft Corporation, Samsung, Cisco, NEC Corporation, Others |
| Customization Scope | Customization for segments, region/country-level will be provided. Moreover, additional customization can be done based on the requirements. |
| Purchase Options | We have three licenses to opt for: Single User License, Multi-User License (Up to 5 Users), Corporate Use License (Unlimited Users and Printable PDF) |





























