


Report Overview
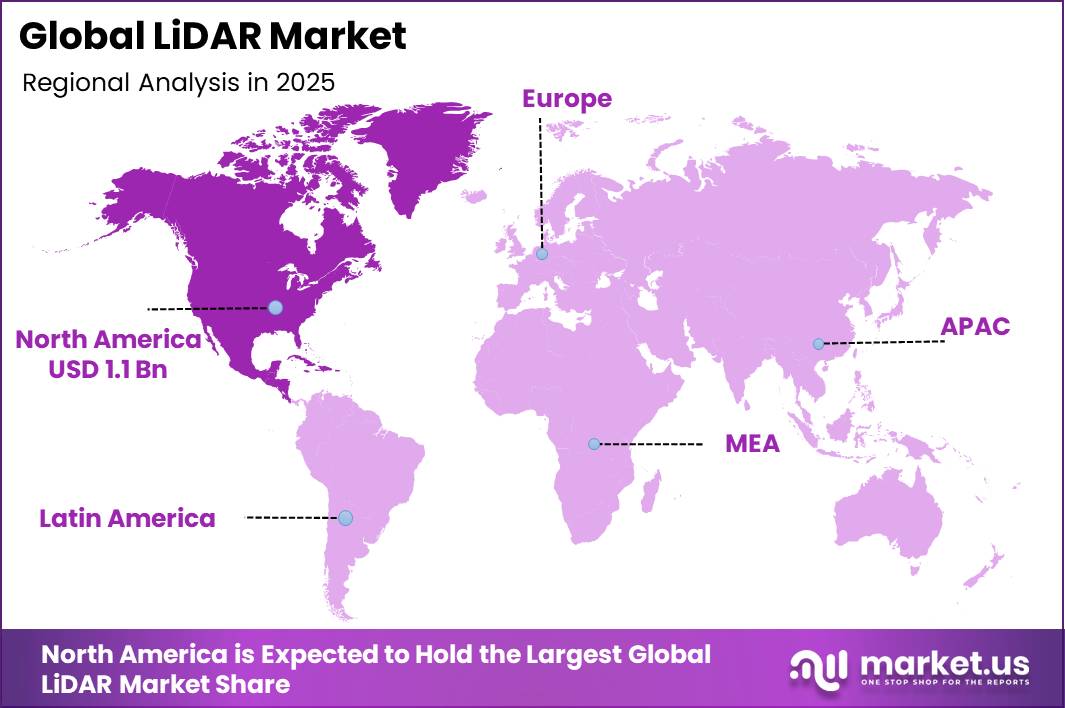
In 2025, the LiDAR Market was valued at USD 3.0 billion. The market is projected to grow at a CAGR of 24.1% during 2026–2035, reaching approximately USD 25.7 billion by 2035. North America dominated the global market in 2025, accounting for more than 35.2% of the total market share and generating approximately USD 1.1 billion in revenue.
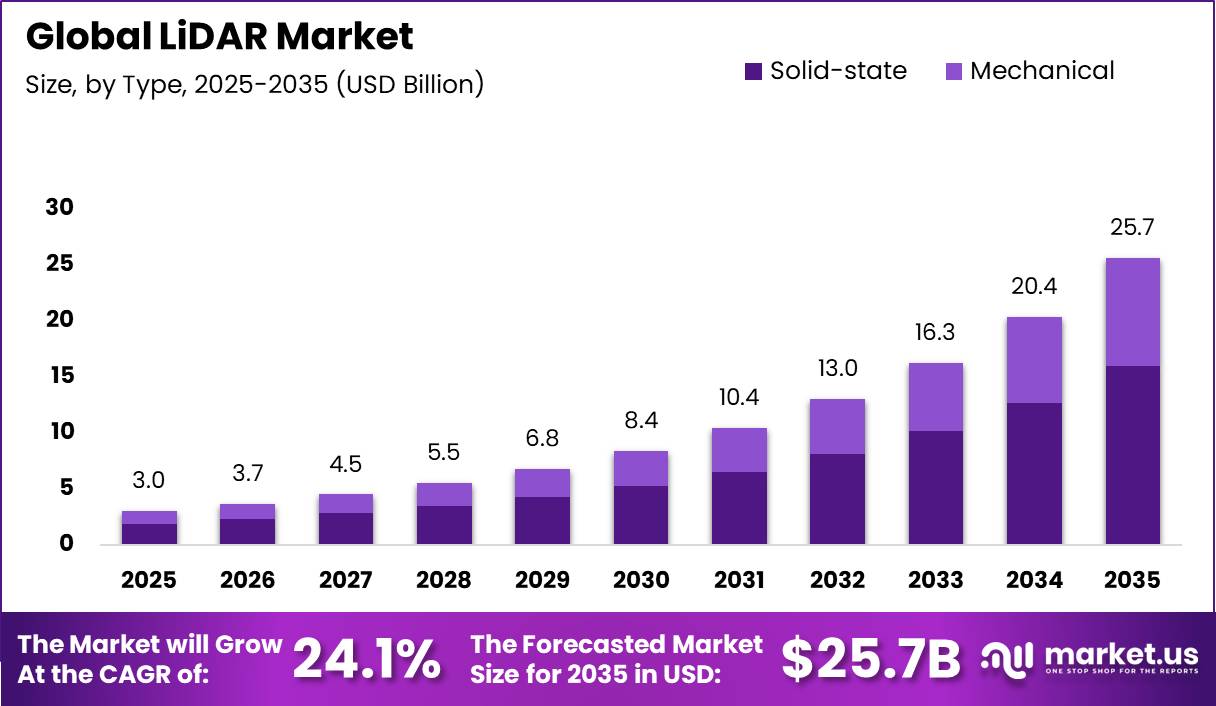
The growth of the LiDAR market is mainly being driven by the automotive industry’s fast shift toward ADAS and autonomous vehicles. Global vehicle production increased from 92.7 million units in 2024 to 96.4 million units in 2025, showing 3.9% year-on-year growth. At the same time, safety rules are making ADAS features more common in new vehicles. From July 2024, EU Regulation 2019/2144 made several driver assistance features mandatory in new cars.
UNECE’s WP.29 approved the first global framework allowing fully autonomous driving systems across key markets such as the US, China, EU, and Japan. More than 50 countries are also developing or enforcing autonomous vehicle laws. In Europe’s five largest markets, Level 2-capable vehicle penetration rose from 22% in 2022 to 35% in 2025, strengthening demand for LiDAR, which supports real-time 3D mapping and safer vehicle navigation.
Beyond automotive, industrial robotics and smart city development are also creating strong demand. In 2024, around 542,000 industrial robots were installed globally, while the operational robot stock reached 4.664 million units. Urbanization is another key factor, as 68% of the global population is expected to live in cities by 2050, adding nearly 2.5 billion urban residents. These trends, along with infrastructure needs of up to USD 2.7 trillion per year and defense investments of over USD 53.6 billion, are creating long-term demand for LiDAR.
Key Takeaways
- The global LiDAR market was valued at USD 3.0 billion in 2025 and is projected to reach USD 25.7 billion by 2035.
- The market is forecast to grow at a CAGR of 24.1% from 2026 to 2035.
- By Type, Solid-state LiDAR leads with 62.3% share, while Mechanical LiDAR is the fastest-growing sub-segment.
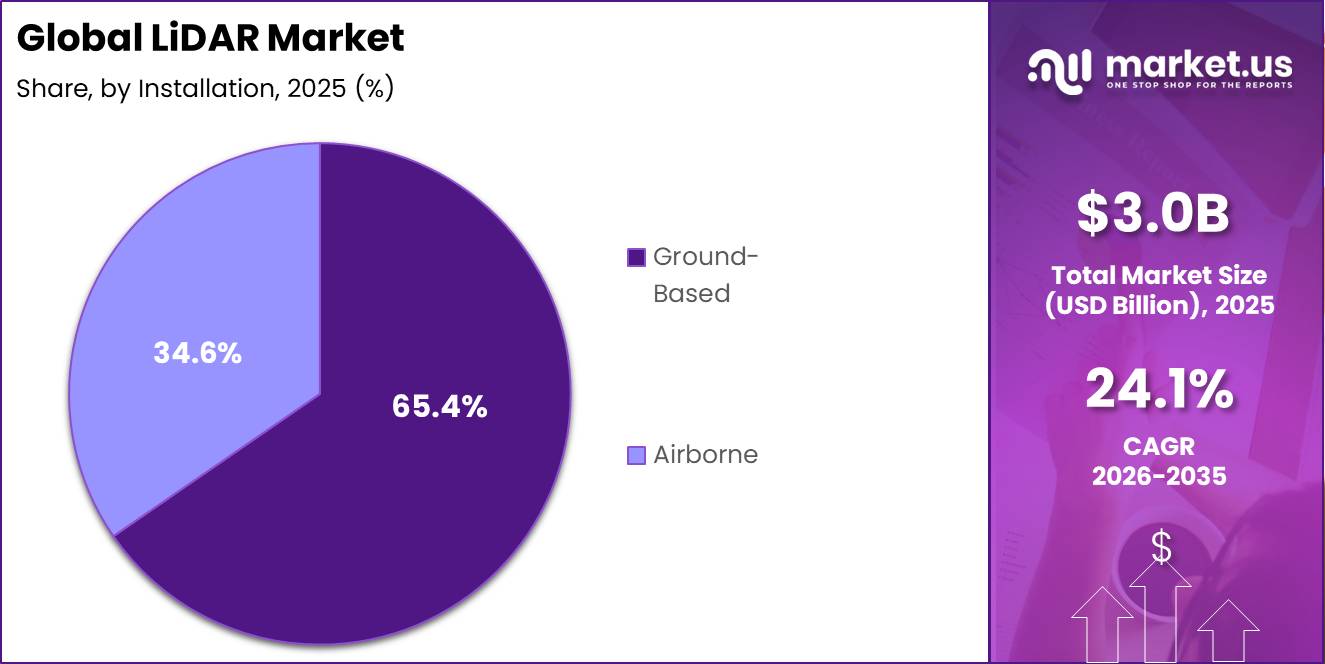
- By Installation, Ground-Based leads with 65.4% share, while Airborne is the fastest-growing sub-segment.
- By Service, Aerial Surveying dominates with 29.5% share, while Ground-based Surveying is the fastest-growing sub-segment.
- By Range, Medium range holds 43.2% share and is also the fastest-growing sub-segment across the range category.
- By Applications, Corridor Mapping is the leading segment with 37.4% share, while ADAS and Driverless Cars are the fastest-growing application.
- North America dominates the market, holding a 35.2% share and generating USD 1.1 billion in revenue in 2025.
By Type
Solid-state dominates with 62.3% due to no moving parts lowering unit cost.
The solid-state LiDAR segment held a dominant market share of around 62.3%, mainly due to its strong fit for large-scale automotive production. Unlike mechanical LiDAR systems that depend on rotating parts, solid-state LiDAR uses technologies such as MEMS mirrors, OPA arrays, or flash projection to control laser beams electronically.
The growth opportunity is also large, as global vehicle production is expected to increase, with China producing 34.53 million units, including 16.626 million NEVs, up 29% year-on-year. In September 2025, China’s MIIT included LiDAR in the national standard framework for Combined Driving Assistance Systems, making the technology more important for intelligent connected vehicles.
This is expected to support high-volume integration by automakers. Solid-state LiDAR is better positioned for this scale because it can be produced through semiconductor-grade silicon photonics processes. The semiconductor industry is projected to reach nearly USD 697 billion in 2025, while automotive semiconductor demand is expected to grow at 8–9% CAGR through 2030.
Hesai Technology also crossed 1 million units in annual LiDAR production in 2025, with ADAS LiDAR deliveries exceeding 1.38 million units. These developments show that solid-state designs can reduce cost by 60–70% compared with mechanical alternatives, making them the preferred architecture for future automotive LiDAR adoption.
By Installation
Ground-Based dominates with 65.4% due to lower cost and simpler regulatory approval.
Ground-based LiDAR leads the installation segment because it does not require aviation permits, flight scheduling, or airspace coordination. Operators can deploy mobile terrestrial scanners directly on vehicles, tripods, or rail-mounted platforms, allowing continuous data collection along roads, tunnels, and construction corridors. This operational simplicity translates into lower total project costs, especially for urban and industrial settings where precision close-range capture is a priority.
Airborne LiDAR, while holding a smaller share at present, is now the fastest-growing installation category. Drone LiDAR surveys, typically covering 5 to 50 acres per flight at costs starting from approximately USD 3,000 per deployment, are becoming the default tool for power line inspection, watershed mapping, and forest canopy analysis. Autonomous-ready vehicle production globally reached approximately 7.61 million units in 2024, a 39% rise from 2023.
By Service
Aerial Surveying dominates with 29.5% due to wide-area coverage in single missions.
Aerial surveying leads the LiDAR services segment because airborne platforms — fixed-wing aircraft and drones can capture massive land areas in one continuous flight path. A single aircraft-mounted LiDAR pass can cover hundreds of kilometres of coastline, forest, or pipeline corridor within hours, a task that would require weeks using any ground-based method.
Government geological agencies, national mapping bodies, and large civil engineering contractors favour aerial LiDAR for base-map creation and topographic data renewal. The global aerial survey services market exceeded USD 5.3 billion in 2023 and is projected to grow at a 14% CAGR through 2032, with LiDAR-equipped platforms representing a growing share of total service revenue. Ground-based surveying is now the fastest-growing service sub-segment.
Rising capital expenditure in rail networks, highway expansion, and urban transit infrastructure is creating intense demand for high-resolution corridor scans that only mobile ground LiDAR can deliver at the millimetre accuracy levels engineers require. In India alone, the National Infrastructure Pipeline has allocated funding across more than 7,000 projects in roads, railways, and urban development, each of which needs precise ground-truth survey data, driving procurement of ground-based LiDAR services at a national scale.
By Range
Medium range dominates with 43.2% due to balanced detection for urban vehicle use.
Medium-range LiDAR sensors, generally covering detection distances between 30 and 250 metres, hold the largest share in the range segment because they satisfy the most common real-world sensing requirement: urban and suburban autonomous vehicle operation. In city environments, obstacles, pedestrians, intersections, and lane boundaries all fall within this distance band, making medium-range units the default choice for ADAS stacks, autonomous mobile robots, and smart intersection monitoring systems.
As many as 36 million LiDAR units were expected to ship globally in 2025, and the majority of those shipments targeted mid-range automotive and robotic applications where 30-to-250-metre performance is the standard specification. The medium-range category also benefits from cost-efficiency: shorter optical paths require less laser power, which reduces unit bills of material. Medium range is simultaneously the fastest-growing sub-segment, driven by the rapid move of LiDAR from premium cars into mainstream passenger vehicles.
By Application
Corridor Mapping dominates with 37.4% due to power line and railway inspection demand.
Corridor mapping leads all LiDAR application categories because linear infrastructure assets power lines, railways, pipelines, and highways represent the single largest and most consistent source of LiDAR survey contracts worldwide. These assets stretch across thousands of kilometres and require periodic inspection to detect encroachments, structural deterioration, and vegetation overgrowth.
LiDAR is uniquely suited to this task because it generates dense point clouds along narrow linear paths at high speed, data that traditional aerial photography or ground survey teams cannot produce at comparable accuracy or scale. Precedence Research places the corridor mapping application at a 39% revenue share of the total LiDAR market as of 2025. National grid operators, railway ministries, and oil and gas pipeline companies are all active buyers of corridor mapping LiDAR services globally.
ADAS and driverless cars are now the fastest-growing application sub-segment. The SAE Level 3 and Level 4 autonomous vehicle segment alone is projected by IDTechEx to expand at a 37% CAGR between 2025 and 2045. Vehicle models in China equipped with LiDAR grew sharply in 2024, with regulatory frameworks like UNECE R157 and China NCAP 2026 requiring higher-resolution perception stacks that mandate LiDAR integration, pulling demand for automotive-grade sensors higher at an accelerating pace each model year.
Key Market Segments
By Type
- Solid-state
- Mechanical
By Installation
- Ground-Based
- Airborne
By Service
- Aerial Surveying
- Ground-based Surveying
- Asset Management
- Geographic Information Systems
- Others
By Range
- Short
- Medium
- Large
By Application
- Corridor Mapping
- ADAS and Driverless Cars
- Cartography
- Engineering
- Environment
- Exploration
- Meteorology
- Urban Planning
- Others
Geopolitical Impact Analysis
Escalating trade tensions between the United States and key LiDAR component suppliers are creating measurable cost pressure across the supply chain. According to WTO trade data and institutional analysis, LiDAR systems rely heavily on semiconductor components, photonic chips, and precision optics, many of which originate from China, Vietnam, and the European Union.
Tariff regimes introduced in 2025 imposed a baseline 10% duty on all imported goods, compounded by a 34% levy on Chinese-origin components and a 46% surcharge on Vietnamese imports. For a technology like LiDAR that depends on MEMS chips, InGaAs photodetectors, and high-precision optical assemblies, these tariff structures translate directly into elevated unit costs.
The U.S. Commerce Department was set to report on Phase 2 semiconductor tariffs by July 2026, with a 25% tariff already in place on a select range of chips, raising procurement costs for domestic integrators who source critical components from Asia. The WTO reported that world merchandise trade volume growth is expected to slow to just 0.5% in 2026, down from 2.4% in 2025, reflecting significant supply chain friction across technology sectors.
Regional Analysis
North America Leads the Global LiDAR Market
North America dominates the LiDAR market, holding a 35.2% share and generating USD 1.1 billion in revenue in 2025. The United States drives this leadership through a convergence of regulatory mandates, technology investment, and strong end-user demand across automotive, defense, and geospatial sectors. Federal legislative momentum, including the Autonomous Vehicle Acceleration Act of 2025 and the SELF DRIVE Act of 2026, gives commercial operators clear frameworks for deploying LiDAR-equipped autonomous systems at scale.
Asia Pacific is the fastest-growing region in the global LiDAR market, propelled by China’s dominant domestic production base, India’s expanding smart cities programs, and Japan’s advanced robotics industry. China’s Hesai Group, the global leader in LiDAR, and Japan and South Korea are investing in autonomous logistics and industrial robotics, where LiDAR serves as a primary navigation sensor.
Key Regions and Countries
North America
- US
- Canada
Europe
- Germany
- France
- The UK
- Spain
- Italy
- Rest of Europe
Asia Pacific
- China
- Japan
- South Korea
- India
- Australia
- Rest of APAC
Latin America
- Brazil
- Mexico
- Rest of Latin America
Middle East and Africa
- GCC
- South Africa
- Rest of MEA
Market Dynamics
Challenge
Laser and optics supply strain highlights a structural constraint in LiDAR supply chains because capacity for semiconductor laser diodes, VCSELs, and high-reliability optical components is concentrated among a small number of manufacturers in East Asia and Europe.
This creates a persistent 5-10% gap between peak demand and available automotive and industrial-grade emitter supply during ramp cycles. As a result, lead times for critical components extend from 8-10 weeks to 18-24 weeks during demand surges, forcing OEMs to either overstock inventory or delay product launches by 3-6 months, which slows volume scaling.
At the system level, while LiDAR ASPs are trending toward the USD 200-300 range with long-term targets near USD 100 by approximately 2029, laser and optics inputs remain volatile, with 8-15% annual swings in wafer and epitaxy pricing. These constraints can reduce attainable industry CAGR by approximately 1.2 percentage points, as deployment timelines slip and ramps become more gradual, even as suppliers pursue multi-sourcing and vertical integration strategies with a typical 24-36 month lag before benefits fully materialize.
| Challenge | (~) % CAGR | Geographic Relevance | Mitigation Horizon |
|---|---|---|---|
| Laser & optics supply strain | -1.2% | North America, EU, East Asia fabs | Medium term (2–4 years) |
| Automotive cost-down squeeze | -1.0% | North America OEMs, EU premium, China NEV | Long term (≥ 4 years) |
| Integration & calibration complexity | -0.8% | Global ADAS, industrial, mapping | Medium term (2–4 years) |
| Data, compute & power constraints | -0.9% | AV/ADAS corridors, smart cities | Long term (≥ 4 years) |
| Regulatory & safety validation drag | -1.1% | EU regulatory hubs, US, China pilots | Long term (≥ 4 years) |
| Talent & ecosystem fragmentation | -0.7% | Global LiDAR & AV clusters | Medium term (2–4 years) |
Opportunity
Most current LiDAR market models still treat mapping, surveying, and asset inspection (utilities, pipelines, rail, forestry, construction) as primarily capital equipment sales. This creates lumpy revenues and limits recurring monetization, since customers typically purchase airborne, mobile, or terrestrial LiDAR units upfront rather than consuming them as a service.
LiDAR-as-a-Service (LaaS) shifts this structure by converting capex into subscription or outcome-based pricing models, expanding adoption to mid-tier asset owners who cannot justify high upfront costs. If LaaS captures even 5-7% of the global geospatial and asset management market by 2035, it could create an additional USD 1.5-2.5 billion annual services TAM, layered on top of hardware sales.
Drone-based corridor inspection for utilities, pipelines, and rail is a key use case, where LiDAR-enabled services can reduce inspection costs by 20-30% and lower unplanned outages by 10-20%, supporting long-term contracts with 10-15 percentage point higher margins than hardware-only models. As utilization rises to 2-3x more survey activity per sensor, service revenue could grow from under 10% today to 20-30% of total LiDAR revenues by 2035, contributing an estimated 1.5 percentage point uplift to CAGR through improved asset utilization and recurring revenue conversion.
| Opportunity | (~) % Potential CAGR | Geographic Relevance | Execution Window |
|---|---|---|---|
| Verticalized Perception Platforms for Industrial & Robotics | +2.5% | North America, EU, APAC developed | Medium term (2-4 years) |
| Non-Automotive Mobility & Smart Infrastructure Monetization | +2.0% | North America core, EU, GCC, APAC emerging | Medium term (2-4 years) |
| Sub-USD 100 Solid-State LiDAR & Edge Fusion ASICs | +2.8% | China, broader APAC, global OEMs | Long term (≥ 4 years) |
| LiDAR-as-a-Service (LaaS) for Mapping & Asset Management | +1.5% | North America, EU, LATAM, APAC | Short term (≤ 2 years) |
| Safety & Regulatory-Triggered Retrofit Programs | +1.3% | EU, China, North America, selected APAC | Medium term (2-4 years) |
| Strategic M&A Roll-Up & IP Aggregation | +1.0% | Global (platform consolidators) | Medium term (2-4 years) |
Driver
LiDAR cost-down and solid-state migration are central to automotive adoption because scaling depends on moving from mechanically complex systems to compact, solid-state architectures with fewer moving parts and lower assembly costs, improving both reliability and manufacturability.
The automotive LiDAR segment is expected to scale toward multi-billion-dollar levels by the early 2030s, with industry targets increasingly focused on achieving sub-USD 200 sensors as a key threshold for mass-market penetration. This price compression is critical for shifting LiDAR from premium vehicles into broader mid-segment adoption.
This transition also changes vendor economics, moving value capture away from high-margin, low-volume hardware toward platform supply agreements, integrated SoC-based solutions, and recurring software or processing revenue. Adoption momentum is strongest in APAC manufacturing ecosystems due to aggressive cost-down cycles, while North America and Europe drive stringent automotive-grade qualification requirements that shape design and scaling pathways.
| Driver | (~) % Impact on CAGR | Geographic Relevance | Impact Timeline |
|---|---|---|---|
| ADAS and autonomy content expansion in passenger vehicles | +4.0% | China core, North America core, EU core, Japan/Korea spill-over | Medium term |
| Regulatory tightening for AV safety and Euro NCAP active safety scoring | +2.3% | EU core, North America core, China spill-over | Short term |
| LiDAR cost-down and solid-state migration | +3.1% | APAC manufacturing core, North America design core, EU industrial adoption | Medium term |
| Robotics, drones, and surveying automation | +1.8% | North America, EU, APAC corridors | Short term |
| Smart infrastructure, mapping, and digital twin deployment | +1.5% | EU core, North America core, GCC and APAC urban corridors | Medium term |
| Defense, security, and industrial autonomy spending | +1.7% | North America core, EU core, Israel/GCC, APAC spill-over | Long term |
Restraint
Fragmented standards and interoperability gaps remain a structural constraint in the LiDAR ecosystem because there is still no globally harmonized framework for safety classifications, performance metrics, interface protocols, or system-level validation.
Although China’s GB/T 45500-2025 standard and emerging European working groups are improving structure in automotive LiDAR regulation, they are also driving regional divergence. This forces manufacturers to maintain multiple hardware and firmware variants and run parallel validation programs, increasing non-recurring engineering (NRE) costs by an estimated 20-40% and extending development cycles by 9-18 months compared with a unified global standard environment.
Integration complexity is also rising. Variations in CAN and Ethernet interfaces, point-cloud formats, and OTA update frameworks require bespoke middleware for each LiDAR SKU, increasing integration costs by 10-20% and discouraging multi-sourcing by OEMs. In industrial and infrastructure markets, the lack of standardized benchmarks further slows procurement and limits large-scale deployment. Overall, these interoperability frictions are estimated to reduce LiDAR market growth by about 1.0 percentage point, as they delay adoption and prevent full conversion of latent demand into scalable volume.
| Restraint | (~) % Impact on CAGR | Geographic Relevance | Impact Timeline |
|---|---|---|---|
| High LiDAR unit economics and integration cost | -2.3% | North America core, EU, APAC auto hubs | Medium term (2-4 years) |
| Automotive ADAS / AV regulatory and liability overhang | -1.9% | North America core, EU, China urban corridors | Medium term (2-4 years) |
| Semiconductor, laser and optics supply tightness | -1.5% | APAC manufacturing belt, EU, North America | Short term (≤ 2 years) |
| Price pressure from camera-radar sensor stacks | -1.7% | Global OEM platforms, especially cost-sensitive APAC | Long term (≥ 4 years) |
| Public infrastructure and smart-city CapEx cyclicality | -1.2% | EU, Middle East, Asia metro corridors, emerging markets | Medium term (2-4 years) |
| Fragmented standards and interoperability gaps | -1.0% | Global, with higher friction in EU and China | Long term (≥ 4 years) |
Key Players Analysis
The global LiDAR market features a clear two-tier competitive structure. Hesai Group leads the Tier 1 group as the global market leader, achieving full-year 2025 net revenues of USD 432.9 million, a 45.8% increase year over year, while shipping 1.62 million LiDAR units during the same period, representing a tripling of shipment volumes.
Hesai posted industry-first full-year GAAP net income of USD 62.3 million in 2025, and committed to doubling production capacity to over 4 million units in 2026 in response to accelerating ADAS and robotics demand, as announced at CES 2026. Trimble Navigation Limited, another Tier 1 player, reported full-year 2024 revenue of USD 983.4 million for Q4 alone and guided for 2025 revenue between USD 3.37 billion and USD 3.47 billion across its geospatial, construction, and transportation segments.
Trimble’s annualized recurring revenue reached USD 2,257.8 million in 2024, growing 14% year on year, underscoring its shift toward software-driven geospatial services where LiDAR data forms a core input. Ouster, the combined entity of the former Velodyne and Ouster companies following their 2023 merger, delivered full-year 2025 Q4 revenue of USD 62 million, up 107% year over year, driven by growth in industrial robotics, warehouse automation, and robotaxi applications.
Q1 2025 revenue reached USD 33 million, up 26% year over year, with GAAP gross margins of 41%. FARO Technologies reported Q1 2025 total sales of USD 82.9 million with a non-GAAP gross margin of 57.7%, the strongest in recent company history, while its adjusted EBITDA grew 124% year over year to USD 12.5 million.
Top Key Players in the Market
- Velodyne LiDAR, Inc.
- Trimble Navigation Limited
- Teledyne Optech Incorporated
- Sick AG
- RIEGL USA, Inc.
- Quantum Spatial, Inc.
- Leica Geosystem Holdings AG
- Innoviz Technologies Ltd.
- Hesai Group
- GeoDigital
- Faro Technologies, Inc.
- YellowScan
Recent Developments
- In January 2026, Hesai Group announced at CES 2026 in Las Vegas a plan to double its annual LiDAR production capacity from 2 million units to over 4 million units in 2026, driven by accelerating demand from ADAS and robotics customers across multiple leading automakers.
- In May 2026, Innoviz Technologies reported Q1 2026 revenues of USD 7.1 million and disclosed an advanced development program agreement combining LiDAR hardware with on-sensor perception software with a leading global automotive OEM, as detailed in its May 2026 earnings release.
- In September 2025, RIEGL unveiled new LiDAR sensor technologies at INTERGEO Frankfurt 2025, including systems achieving measurement ranges of up to 1,800 meters at a 300 kHz measurement rate, setting new performance benchmarks for long-range airborne and ground-based surveying applications.
Report Scope
| Report Features | Description |
|---|---|
| Market Value (2025) | USD 3.0 Billion |
| Forecast Revenue (2035) | USD 25.7 Billion |
| CAGR (2026-2035) | 24.1% |
| Base Year for Estimation | 2025 |
| Historic Period | 2020-2024 |
| Forecast Period | 2026-2035 |
| Report Coverage | Revenue Forecast, Market Dynamics, Competitive Landscape, Recent Developments |
| Segments Covered | By Type (Solid-state, Mechanical); By Installation (Ground-Based, Airborne); By Service (Aerial Surveying, Ground-based Surveying, Asset Management, Geographic Information Systems, Others); By Range (Short, Medium, Large); By Applications (Corridor Mapping, ADAS and Driverless Cars, Cartography, Engineering, Environment, Exploration, Meteorology, Urban Planning, Others) |
| Regional Analysis | North America – US, Canada; Europe – Germany, France, The UK, Spain, Italy, Rest of Europe; Asia Pacific – China, Japan, South Korea, India, Australia, Singapore, Rest of APAC; Latin America – Brazil, Mexico, Rest of Latin America; Middle East & Africa – GCC, South Africa, Rest of MEA |
| Competitive Landscape | Velodyne LiDAR, Inc., Trimble Navigation Limited, Teledyne Optech Incorporated, Sick AG, RIEGL USA, Inc., Quantum Spatial, Inc., Leica Geosystem Holdings AG, Innoviz Technologies Ltd., Hesai Group, GeoDigital, Faro Technologies, Inc., YellowScan |
| Customization Scope | Customization for segments and region/country levels will be provided. Moreover, customization can be tailored to the requirements. |
| Purchase Options | We have three licenses to opt for: Single User License, Multi-User License (Up to 5 Users), Corporate Use License (Unlimited Users and Printable PDF) |





































