


Report Overview
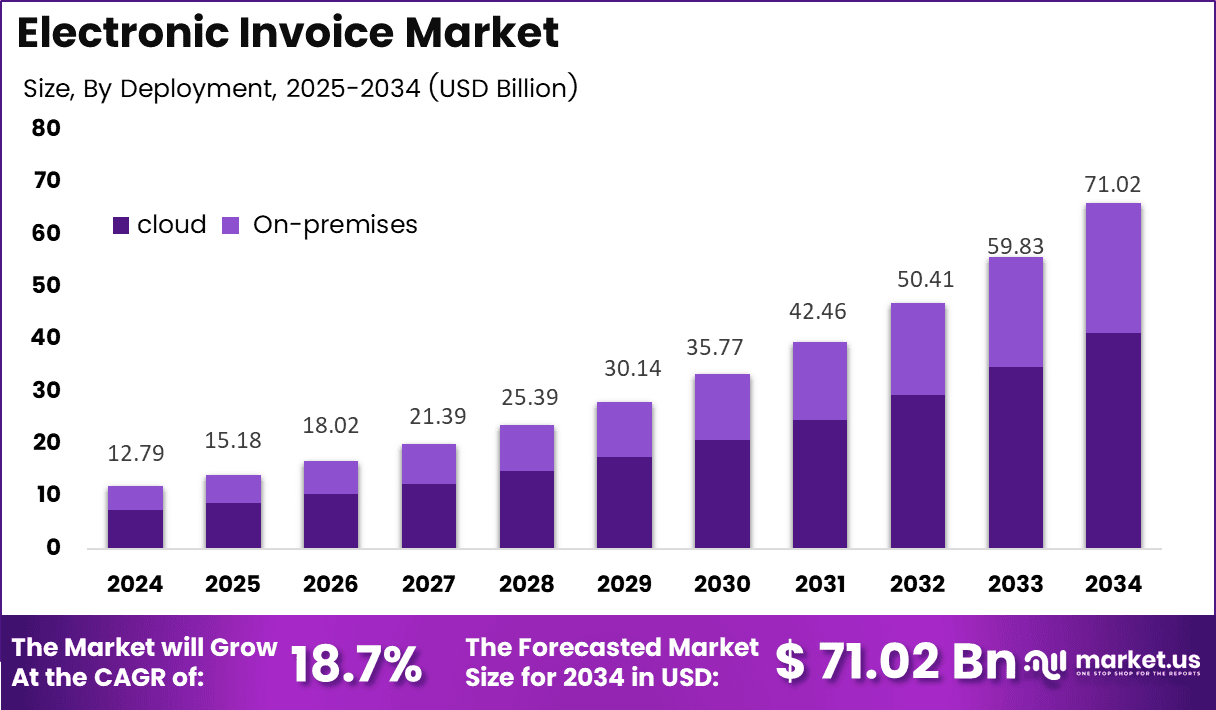
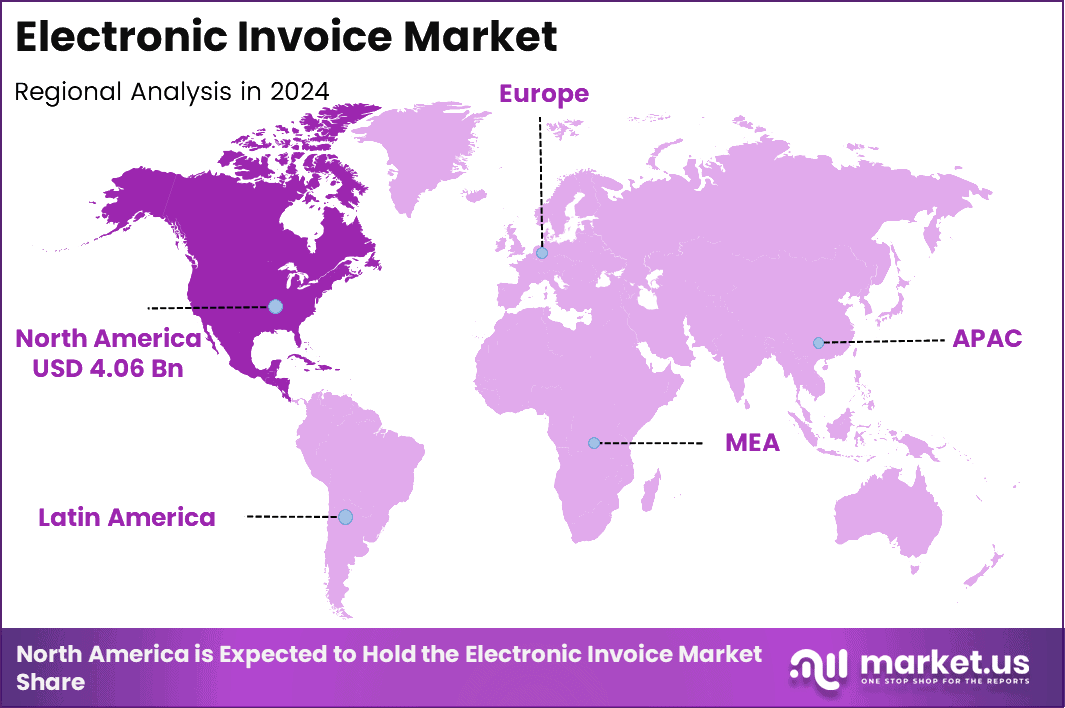
In 2024, the Global Electronic Invoice Market was valued at USD 12.79 billion. The market is projected to grow at a CAGR of 18.7% during 2025–2034, reaching approximately USD 71.02 billion by 2034. North America dominated the global market in 2024, accounting for 31.8% of the total market share and generating approximately USD 4.06 billion in revenue.
This trajectory is supported by hard regulatory and adoption data from public bodies. A UN/UN DESA VAT technology review finds that 36.8% of tax administrations worldwide already run mandatory e‑invoicing systems for some or all taxpayers, with adoption highest in Latin America where regional group CIAT reports about 50% of tax authorities using e‑invoicing as a core compliance tool.
The World Bank’s analysis of electronic tax invoicing in Latin America shows that once e‑invoicing is mandated, adoption can quickly reach over 99% of transaction value, dramatically lifting reported VAT and shrinking the shadow economy.
EU country factsheets from the European Commission show that by 2025 most Member States have mandatory business‑to‑government (B2G) e‑invoicing and are phasing in business‑to‑business (B2B) mandates, so that around 50% of European businesses were using e‑invoicing by early 2024.
Key Takeaways
- The global Electronic Invoice Market was valued at USD 12.79 billion in 2024.
- The global Electronic Invoice Market is projected to grow at a CAGR of 18.7% and is estimated to reach USD 71.02 billion by 2034.
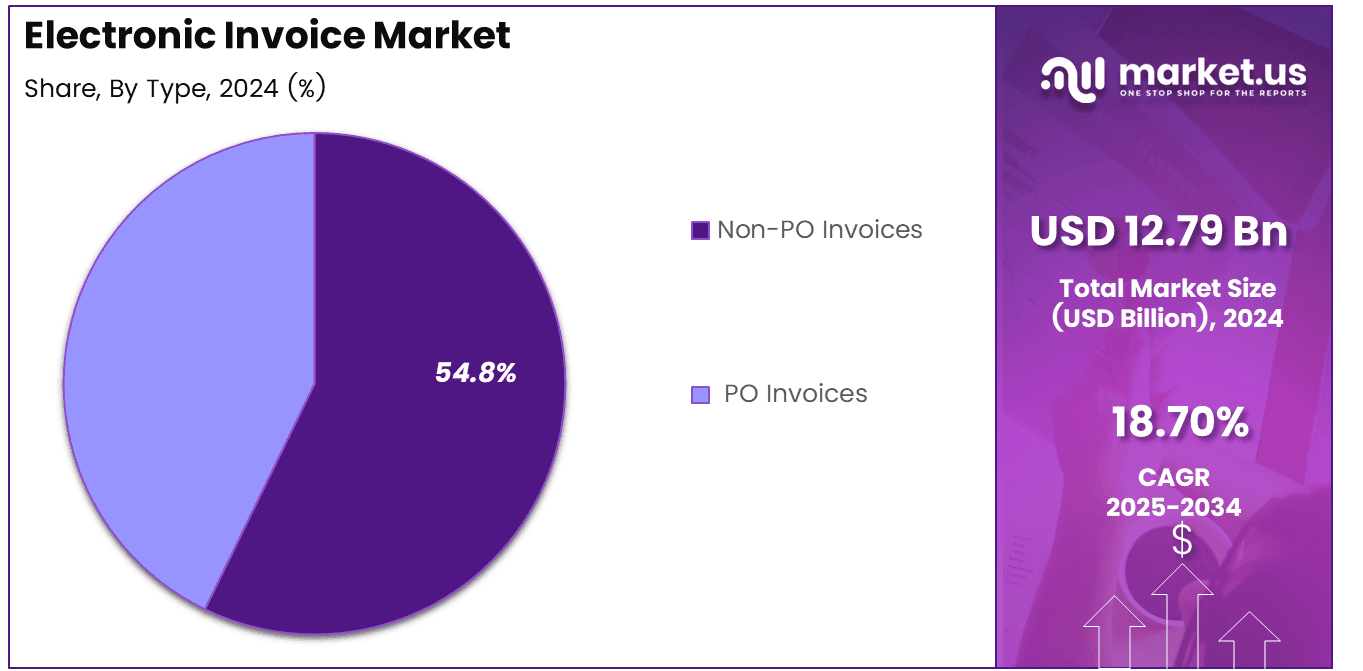
- On the basis of type, the Non-PO Invoices segment dominated the market, accounting for 54.8% of the total market share.
- Based on deployment, the On-Premise segment dominated the market, accounting for 58.14% of the total market share.
- By end-user, the Retail and E-Commerce segment dominated the market, accounting for 32.4% of the total market share.
- On the basis of application, the B2B segment dominated the market, accounting for 84.7% of the total market share.
- In 2024, North America was the most dominant region in the Electronic Invoice Market, accounting for 31.8% of the total market share, equivalent to approximately USD 4.06 billion.
By Type
In 2025, Non-PO Invoices held a dominant market position, capturing more than a 54.8% share. This leadership is supported by the large volume of invoices processed in the U.S., where an estimated 25 billion invoices are generated annually, and roughly 38% were expected to be exchanged electronically by 2024.
Non-PO formats are widely used in professional services and healthcare, where recurring and low-value bills do not require purchase orders but still demand fast processing. Structured e-invoicing can reduce processing costs by $4 to $8 per paper invoice, while over 90% of electronic invoices are paid on time compared with about 45% for paper invoices.
By Deployment
On-premises deployment held a significant market share in 2025, supported by organizations that prefer local control of financial data and invoicing workflows. In North America, e-invoicing adoption reached about 24% of invoices in 2014 and was projected to reach 38% by 2024. Many organizations continue using on-premise accounting and ERP systems, particularly in regulated industries such as manufacturing and utilities.
These environments support customized integrations, legacy formats, and strict internal security policies. During 2025, many businesses focused on upgrading existing on-premise invoice modules rather than replacing them completely, while digital connections to external e-invoicing networks enabled gradual modernization without disrupting established infrastructure.
By End-user
The Retail and E-Commerce segment is emerging as a fast-growing segment in 2025, driven by the rapid expansion of online sales. U.S. e-commerce revenue reached approximately $1.234 trillion in 2025, increasing 5.4% from 2024, while online purchases represented roughly 23.1% of total retail sales. This growth has encouraged retailers to automate order-to-cash processes, integrating e-invoices with inventory, tax, and payment systems.
E-invoicing can accelerate invoice processing by more than 30%, creating significant efficiency benefits for merchants managing large transaction volumes. Retailers are increasingly using structured billing for returns, subscriptions, and marketplace transactions, while invoice data also supports pricing, payment reconciliation, fraud monitoring, and customer service.
By Application
The B2B segment held a significant market share in 2025, reflecting the large volume of invoices exchanged between businesses and institutions. Globally, approximately 500 billion invoices are generated each year, while only around 42 billion, or 8.4%, are exchanged electronically, highlighting substantial growth potential.
Full e-invoicing adoption could generate more than $116 billion in economic gains in the U.S., with 83% of these benefits linked to improved productivity and cash-flow management. During 2025, businesses increasingly expanded electronic invoicing across suppliers and subcontractors to reduce disputes, strengthen audit trails, and improve supply-chain efficiency.
Key Market Segments
By Type
- Non-PO Invoices
- PO Invoices
By Deployment
- On-Premise
- Cloud-Based
By End-user
- Retail and E-Commerce
- Government
- IT and Telecom
- BFSI
- Others
By Application
- B2B
- B2C
Regional Analysis
North America currently dominates the global electronic invoice market, accounting for 31.8% of total revenues, equivalent to about USD 4.06 billion. This leadership is underpinned by strong regulatory support for digital financial processes, rapid adoption of cloud-based accounting and ERP platforms, and high digital maturity across enterprises, particularly in the US and Canada.
Organizations in the region are leveraging e‑invoicing to streamline accounts payable and receivable, enhance tax compliance, and reduce operational costs through automation. The presence of leading fintech vendors, advanced payment infrastructure, and widespread use of real‑time data analytics further reinforce North America’s position as the key revenue-generating hub in the market.
Asia Pacific is emerging as the fastest-growing region in the electronic invoicing landscape, supported by rapid urbanization, expanding SME sectors, and government‑led digitization programs in countries such as China, India, South Korea, and Australia. Growing cross‑border trade, increasing penetration of cloud solutions, and mandates around GST/e‑invoice reporting in major markets are accelerating adoption.
U.S. Market Size
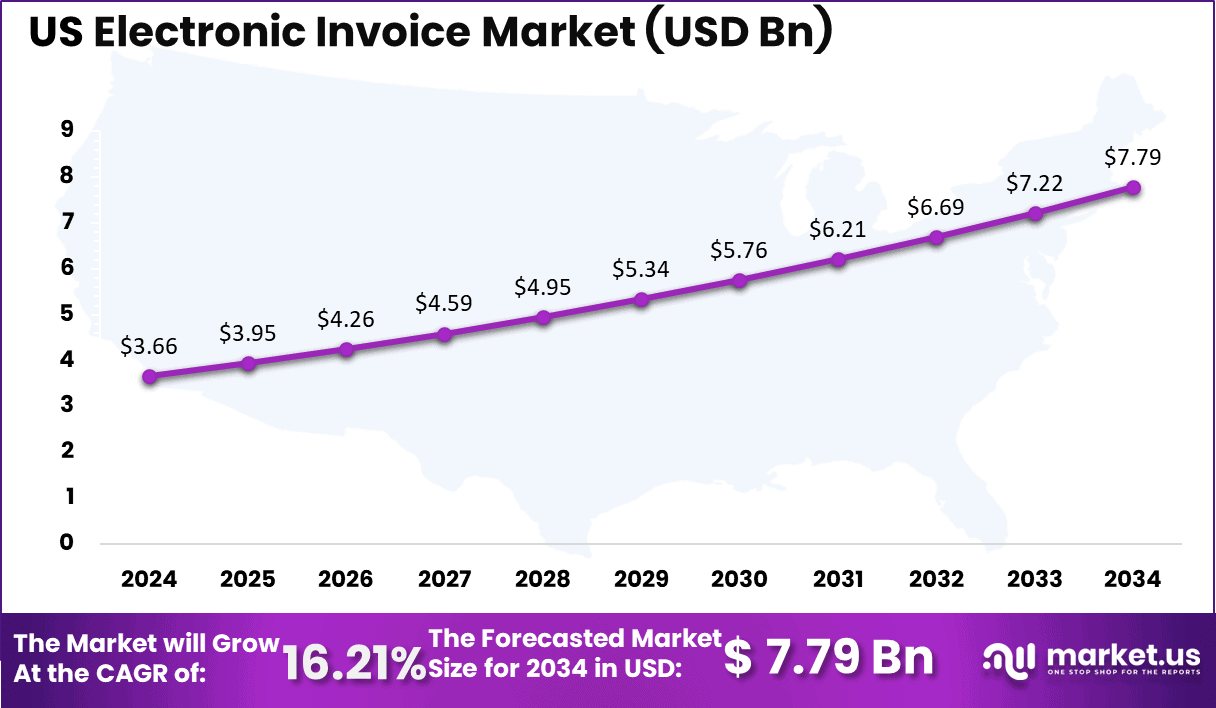
The U.S. Electronic Invoice Market is projected to reach USD 3.66 billion in 2024, with steady growth expected over the forecast period. This growth is largely driven by the increasing regulatory requirements for electronic invoicing in key sectors, including government procurement, healthcare, and manufacturing.
These industries are adopting digital invoicing solutions to improve efficiency, reduce errors, and ensure compliance with evolving regulations. The U.S. market will continue to expand as businesses increasingly prioritize automation in financial management systems.
Key Regions and Countries
North America
- US
- Canada
Europe
- Germany
- France
- The UK
- Spain
- Italy
- Rest of Europe
Asia Pacific
- China
- Japan
- South Korea
- India
- Australia
- Rest of APAC
Latin America
- Brazil
- Mexico
- Rest of Latin America
Middle East & Africa
- GCC
- South Africa
- Rest of MEA
Drivers
| Driver | (~) % Impact on CAGR Forecast | Geographic Relevance | Impact Timeline |
|---|---|---|---|
| Mandated real-time tax e-invoicing | +3.3% | Europe, Latin America, India | Short term (≤ 2 years) |
| Public procurement digitalization | +2.4% | EU, UK, selected OECD members | Medium term (2–4 years) |
| Enterprise ERP cloud migration | +2.1% | North America, Western Europe, APAC metros | Medium term (2–4 years) |
| Cost-per-invoice reduction agenda | +1.8% | Global mid-market enterprises | Short term (≤ 2 years) |
| VAT/GST anti-fraud programs | +1.6% | EU, Brazil, Mexico, India | Medium term (2–4 years) |
| Cross-border trade platform integration | +1.5% | Global trade corridors | Long term (≥ 4 years) |
Mandated real-time tax e-invoicing
Over the 2022–2024 window, successive tax reforms in Europe, Latin America, and India have shifted electronic invoicing from voluntary efficiency tooling into a legally mandated, real-time tax reporting infrastructure, with governments requiring authenticated e-invoices submitted to clearance platforms before goods or services can be recognized for VAT/GST purposes, often within seconds of issuance.
This regulatory shift compresses manual billing cycles that historically cost enterprises around USD 7–12 per paper invoice down to automated digital workflows closer to USD 1–3 per invoice, while simultaneously imposing statutory penalties that can reach 10–25% of invoice value or result in input VAT rejections if e-invoicing rules are not met, effectively forcing rapid migration to compliant solutions.
Strategically, real-time mandates are reconfiguring business models from license-plus-customization into recurring SaaS and platform-fee structures, with vendors monetizing per-transaction connectivity to government clearance systems, while enterprises reallocate 5–10% of finance-function OpEx from manual processing to integrated tax technology, accelerating adoption and contributing several percentage points of incremental CAGR on top of the baseline 18.7% growth trajectory by making compliant e-invoicing a non-negotiable prerequisite to revenue recognition in these jurisdictions.
Restraints
| Restraint | (~) % Impact on CAGR Forecast | Geographic Relevance | Impact Timeline |
|---|---|---|---|
| Fragmented national compliance schemas | -2.9% | Global multi-country operations | Short term (≤ 2 years) |
| SME capital intensity of rollout | -2.3% | Emerging markets, smaller EU firms | Short term (≤ 2 years) |
| Legacy ERP and billing lock-in | -2.0% | Global, especially manufacturing and public sector | Medium term (2–4 years) |
| Interoperability gaps across networks | -1.7% | Europe, cross-border trade corridors | Medium term (2–4 years) |
| Cybersecurity and data-sovereignty concerns | -1.5% | North America, EU, regulated industries | Medium term (2–4 years) |
| Government platform reliability risks | -1.3% | India, Latin America, selected EU states | Short term (≤ 2 years) |
Fragmented national compliance schemas
The most immediate structural restraint on electronic invoice adoption is the proliferation of country-specific mandates that define unique XML schemas, digital signature requirements, archiving periods of up to 10 years, and clearance versus post-audit models, forcing multinationals operating in 20–50 jurisdictions to maintain parallel invoicing formats and certification chains rather than a single harmonized standard.
This fragmentation drives IT and compliance costs materially above baseline, with global sellers reporting the need for 20–40% additional implementation budget per incremental jurisdiction and dedicating 5–8 full-time specialists solely to keep invoice templates, tax codes, and reporting schedules synchronized with frequent rule changes, directly freezing or postponing projects that would otherwise expand e-invoicing penetration.
Strategically, the complexity compresses margins by an estimated 150–250 basis points for high-volume cross-border traders as they absorb duplicated integration and testing cycles, slows vendor expansion into new markets, and subtracts several percentage points from the achievable CAGR relative to the baseline 18.7%, since some enterprises cap their adoption to a subset of countries or delay rollouts where compliance overhead would push internal hurdle rates above targeted returns.
Challenges
| Challenge | (~) % CAGR Friction Drag | Geographic Relevance | Mitigation Horizon |
|---|---|---|---|
| Complex multi-system integration | -2.6% | Global mid- to large enterprises | Medium term (2–4 years) |
| Continuous regulatory change monitoring | -2.2% | EU, Latin America, India | Long term (≥ 4 years) |
| Finance and IT talent constraints | -1.9% | Global, especially emerging markets | Long term (≥ 4 years) |
| Operational risk from platform downtime | -1.8% | India, Latin America | Short term (≤ 2 years) |
| Data quality and master-data management | -1.6% | Global enterprises | Medium term (2–4 years) |
| User adoption and change management | -1.4% | Global, all firm sizes | Medium term (2–4 years) |
Complex multi-system integration
Electronic invoicing rollouts typically require stitching together ERP, order management, tax engines, payment platforms, and government clearance or reporting interfaces, with many enterprises running 5–10 core financial systems and dozens of country-specific add-ons that were never architected for real-time API-based invoice validation.
Quantitatively, this integration burden translates into project timelines that extend from an ideal 3–6 months to 12–18 months in multi-country deployments, implementation costs that run 30–50% above initial budgets, and incremental per-invoice processing friction when data mapping errors generate rejection rates of 2–5%, requiring manual rework and delaying tax reporting and cash collection.
Strategically, the sustained integration drag forces corporates to rephase rollouts by geography, accept slower than potential adoption in complex business units, and commit long-term to platform consolidation and standardized data models, all of which dampens the realizable growth rate by several percentage points relative to the unconstrained trajectory implied by the baseline 18.7%, even though current sales continue and the market does not contract.
Opportunities
| Opportunity | (~) % Potential CAGR Upside | Geographic Relevance | Execution Window |
|---|---|---|---|
| Integrated AR, payments, and tax platforms | +3.1% | Global, especially large enterprises | Medium term (2–4 years) |
| SME-focused low-touch e-invoicing SaaS | +2.5% | Emerging markets, long-tail SMEs | Medium term (2–4 years) |
| Cross-border compliance-as-a-service | +2.2% | Global exporters and marketplaces | Long term (≥ 4 years) |
| AI-driven anomaly detection and audit analytics | +2.0% | Regulated industries, high-volume billers | Long term (≥ 4 years) |
| Embedded e-invoicing in industry platforms | +1.8% | Vertical ERPs and trade networks | Medium term (2–4 years) |
| Public-sector to B2B spillover adoption | +1.6% | EU, OECD public procurement ecosystems | Long term (≥ 4 years) |
Integrated AR, payments, and tax platforms
This opportunity reflects future white space beyond today’s compliance-centric implementations, where electronic invoicing becomes the transactional backbone for end-to-end accounts receivable, embedded payments, and tax settlement, allowing platforms to monetize incremental services such as dynamic discounting, automated cash application, and real-time VAT/GST calculation on top of basic invoice issuance.
From a unit-economics standpoint, integrating e-invoicing with payment rails and AR workflows can cut days sales outstanding by 3–7 days, lower end-to-end AR processing cost by roughly 25–40%, and generate incremental fee revenue per invoice of 0.5–1.5% of invoice value from financing or payment services, while further pushing cost-per-invoice down by another USD 0.5–1.0 versus standalone solutions.
Strategically, this transforms solutions from mandated cost centers into revenue-generating financial platforms, expanding the addressable market into adjacent AR automation and digital payments segments, and creating upside of several percentage points above the baseline 18.7% CAGR for vendors that can capture a meaningful share of this converged AR-payments-tax stack, with margin expansion potential of 300–500 basis points driven by higher-value services layered on existing e-invoicing infrastructure.
Key Players Analysis
The electronic invoicing market is led by large ERP and enterprise software vendors, whose scale, cloud infrastructure, and compliance capabilities give them strong influence over adoption. SAP SE generated €34.2 billion in total revenue in 2024, including €17.1 billion in cloud revenue and €29.8 billion in cloud & software revenue.
SAP invested €6.5 billion in R&D, equivalent to roughly 19% of revenue, supporting continued development of cloud ERP, tax-compliant invoicing, automation, and regulatory reporting. Its cloud backlog reached €63.3 billion, up 43% year-on-year, reinforcing long-term demand for integrated invoicing and compliance workflows.
Tier-2 competition is led by more specialized e-invoicing and accounts-payable platforms. Basware reported €152 million in 2020 net sales, with €110.3 million from cloud revenue, representing about 73% of total sales. By 2023, Basware was processing more than 220 million invoices and approximately $900 billion in invoice spend through its network, strengthening its position across European markets.
Coupa Software generated $725.3 million in FY2022 revenue, up 34% from $541.6 million in 2021, while R&D spending reached $166.5 million, or about 23% of revenue. Other significant challengers include Tradeshift, Tipalti, Esker, Comarch, Sage, Pagero, and OpenText. These providers typically hold around 2–5% each of global market revenues while investing heavily in automation, tax compliance, integrations, and regional e-invoicing networks.
Top Key Players
- Cegedim SA
- Sage Group Plc
- Comarch SA
- Nipendo Ltd
- Tradeshift
- Transcepta LLC
- Basware Corporation
- Coupa Software Inc
- IBM Corporation
- SAP SE
- Other Major Players
Recent Developments
- In 2024, SAP enhanced its invoicing solutions by integrating AI-powered automation, improving the system’s integration with financial processes. This upgrade helped boost invoicing accuracy by 15%, allowing businesses to reduce errors, streamline operations, and achieve greater efficiency in financial transactions, benefiting both large enterprises and SMBs.
- In 2025, Oracle launched new features in its cloud-based invoicing software, expanding its capabilities to meet growing demand for digital financial solutions. These improvements led to a 20% increase in Oracle’s customer base, reinforcing its position in the market as a key player in automating invoicing and financial workflows.
Report Scope
| Report Features | Description |
|---|---|
| Market Value (2024) | USD 12.79 Bn |
| Forecast Revenue (2034) | USD 71.02 Bn |
| CAGR (2025-2034) | 18.7% |
| Base Year for Estimation | 2024 |
| Historic Period | 2020-2023 |
| Forecast Period | 2025-2034 |
| Report Coverage | Revenue Forecast, Market Dynamics, Competitive Landscape, Recent Developments |
| Segments Covered | By Type (Non-PO Invoices, PO Invoices), By Deployment (On-Premise, Cloud-Based), By End-user (Retail and E-Commerce, Government, IT and Telecom, BFSI, Others), By Application (B2B, B2C) |
| Regional Analysis | North America – US, Canada; Europe – Germany, France, The UK, Spain, Italy, Rest of Europe; Asia Pacific – China, Japan, South Korea, India, Australia, Singapore, Rest of APAC; Latin America – Brazil, Mexico, Rest of Latin America; Middle East & Africa – GCC, South Africa, Rest of MEA |
| Competitive Landscape | Cegedim SA, Sage Group Plc, Comarch SA, Nipendo Ltd, Tradeshift, Transcepta LLC, Basware Corporation, Coupa Software Inc, IBM Corporation, SAP SE, Other Major Players |
| Customization Scope | Customization for segments, region/country-level will be provided. Moreover, additional customization can be done based on the requirements. |
| Purchase Options | We have three licenses to opt for: Single User License, Multi-User License (Up to 5 Users), Corporate Use License (Unlimited Users and Printable PDF) |





























