


Report Overview
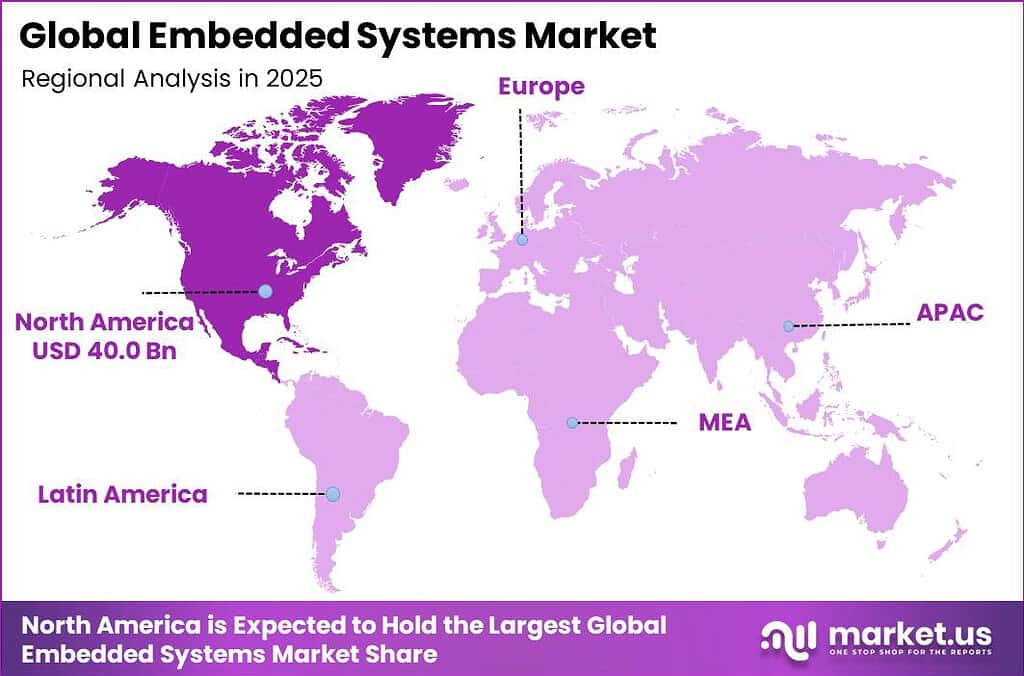
In 2025, the Global Embedded Systems Market was valued at USD 117.58 billion. The market is projected to grow at a CAGR of 7.07% during 2026–2035, reaching approximately USD 232.74 billion by 2035. North America dominated the global market in 2025, accounting for more than 34.0% of the total market share and generating approximately USD 40.0 billion in revenue.
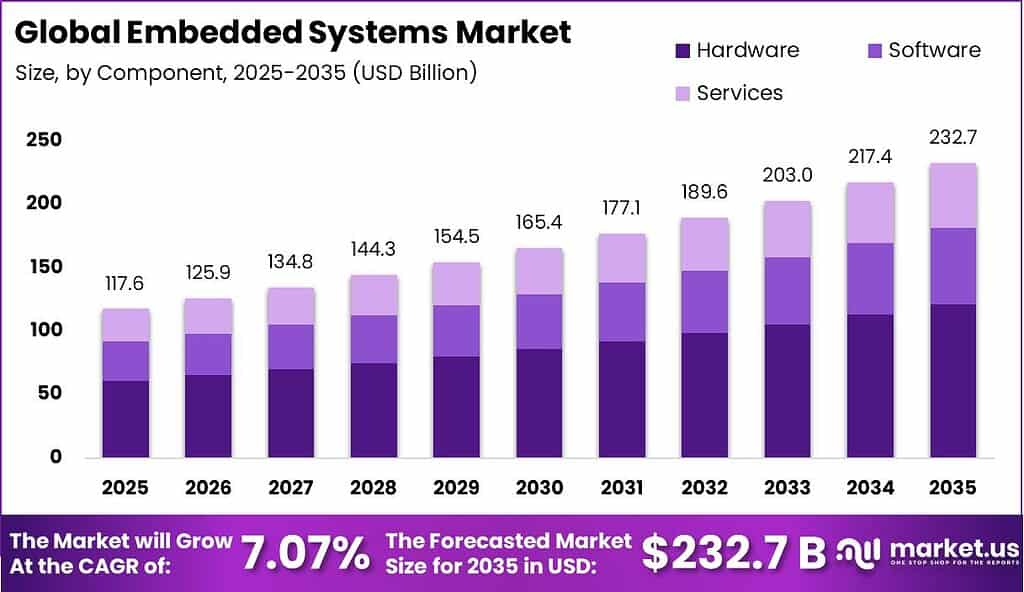
This growth trajectory is firmly rooted in hard industry numbers rather than speculation. According to the Semiconductor Industry Association (SIA), global chip sales hit a record USD 791.7 billion in 2025, up 25.6% from USD 630.5 billion in 2024, and since embedded systems are built entirely around semiconductors, this surge feeds straight into embedded hardware demand. GSMA data shows global IoT connections reached 24.6 billion in 2025.
The automotive sector adds further weight: OICA reports global vehicle production climbed from 92.7 million units in 2024 to 96.4 million units in 2025, a 3.9% rise, and every modern vehicle now carries dozens of embedded control units for braking, steering, engine management, and infotainment. China’s new-energy vehicle output alone reached 16.626 million units in 2025, up 29% year-on-year.
North America’s revenue base tracks closely with the region’s chip industry strength, since GSMA notes mobile technologies generated USD 7.6 trillion in global economic value in 2025, equal to 6.4% of world GDP, with North America hosting a large share of chip design, cloud infrastructure, and industrial automation activity that consumes embedded systems at scale.
Key Takeaway
- The global embedded systems market was valued at USD 117.58 billion in 2025.
- The global embedded systems market is projected to grow at a CAGR of 7.07% and is estimated to reach USD 232.74 billion by 2035.
- On the basis of component, the hardware segment dominated the market, constituting 52.0% of the total market share.
- Based on system size, the small-scale embedded systems segment dominated the market, accounting for 44.0% of the total market share.
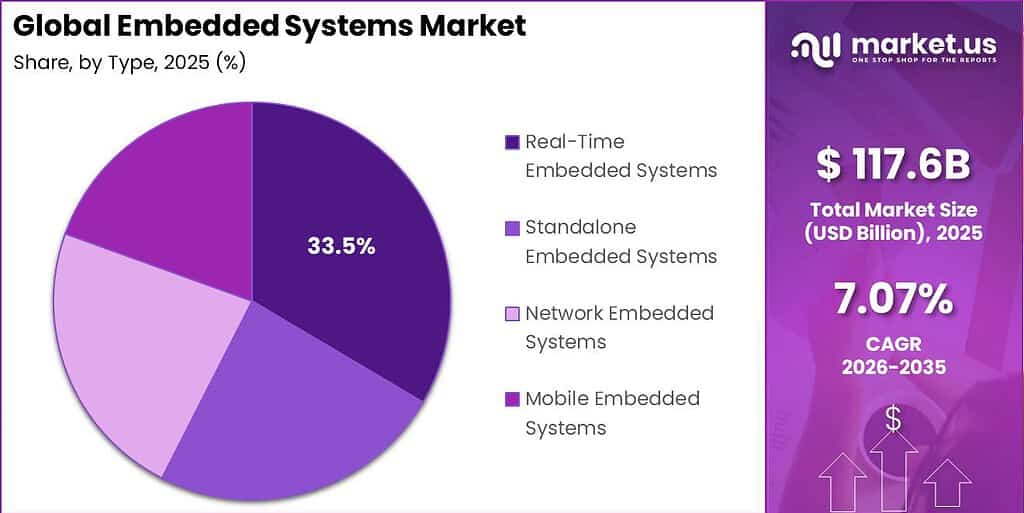
- By type, the real-time embedded systems segment dominated the market, accounting for 34.0% of the total market share.
- On the basis of application, the automotive systems segment dominated the market, accounting for 23.0% of the total market share.
- In 2025, North America was the most dominant region in the embedded systems market, accounting for 34.0% of the total market share.
By Component
In 2025, Hardware held a dominant market position, capturing more than a 52% share of the embedded systems market by component, and this lead has only strengthened through 2026 as chip demand keeps climbing.
That momentum carried into April 2026, when monthly global chip sales touched $110.5 billion, up 93.9% from April 2025, showing just how fast microcontrollers, sensors, and processors are being manufactured and deployed. Every embedded device, whether a factory sensor or a car’s control unit, still needs physical silicon before any software can run, which keeps hardware spend structurally ahead of other cost categories.
By System Size
Small-Scale Embedded Systems accounted for 44.0% of the market in 2025, and this segment continues to expand quickly as compact, low-power chips find their way into everyday gadgets. The scale of this shift shows up in the connected device numbers: global IoT connections climbed from 18.5 billion in 2024 to 21.1 billion by late 2025.
By 2030, that device count is projected to reach 39 billion, meaning the small footprint category will keep gaining ground as wearables, smart-home gadgets, and portable medical trackers proliferate. Cellular IoT connections, which include NB-IoT and LTE-M modules built for tiny embedded boards, grew 16% year-on-year through 2024 alone, pointing to sustained momentum into 2025 and 2026.
By Type
In 2025, Real-Time Embedded Systems held a dominant market position, capturing more than a 33.5% share of the market by type, and the segment kept that lead into 2026 as industries demand instant, predictable responses from their machines. Real-time processing matters most where delays cause real damage.
Global industrial robot installations, which rely heavily on real-time control loops for welding, palletizing, and heavy-payload tasks, are projected to grow 6% to 575,000 units in 2025 and surpass 700,000 units by 2028.
Electric car sales are expected to exceed 20 million worldwide in 2025, representing more than a quarter of total car sales, and these vehicles depend on real-time embedded controllers for battery management and motor control every millisecond.
By Application
Automotive Systems is emerging as a fast-growing segment in 2025, holding roughly a 23.0% share by application as vehicles pack in more electronics than ever before. Electric car sales are set to top 20 million globally in 2025, up 25% year-on-year, with first-quarter sales alone up 35% compared to the same period in 2024 across every major market.
Each of these electric vehicles typically carries 50 to 100 or more microcontrollers handling everything from battery management to infotainment and driver-assist functions, a scale of integration unmatched by traditional combustion vehicles. Industrial robot data shows automotive manufacturing remains a heavyweight customer too.
Key Market Segments
By Component
- Hardware
- Software
- Services
By System Size
- Small-scale Embedded Systems
- Medium-scale Embedded Systems
- Large-scale Embedded Systems
By Type
- Real-Time Embedded Systems
- Standalone Embedded Systems
- Network Embedded Systems
- Mobile Embedded Systems
By Application
- Automotive Systems
- Healthcare
- Consumer Electronics
- Industrial Automation
- Aerospace & Defense Technologies
- Telecommunications
- Smart Devices
- Others
Market Dynamics
Drivers
| Driver | (~) % CAGR Forecast | Geographic Relevance | Impact Timeline |
|---|---|---|---|
| Automotive electronics and ADAS content growth | +1.8% | Global, concentrated in Germany, Japan, South Korea, US | Short term (≤ 2 years) |
| Edge AI inferencing integration into MCUs/SoCs | +1.4% | North America, East Asia | Short term (≤ 2 years) |
| Industrial automation and smart manufacturing retrofits | +1.1% | China, Germany, US, India | Medium term (2–4 years) |
| Government-backed domestic semiconductor capacity expansion | +0.9% | United States, India, Taiwan | Medium term (2–4 years) |
| Proliferation of connected consumer IoT devices | +0.7% | Global, led by Asia-Pacific | Short term (≤ 2 years) |
| Healthcare device digitization and remote monitoring | +0.5% | North America, Western Europe | Medium term (2–4 years) |
Automotive Electronics and ADAS Content Growth
The root cause of this driver is the structural shift in vehicle bill-of-materials composition, where electronics content now accounts for roughly 35% to 40% of total vehicle cost as automakers embed additional microcontrollers per platform for ADAS, powertrain control, and in-vehicle infotainment; this trajectory accelerated visibly between 2024 and 2026 as tier-1 suppliers reported multi-year design-win backlogs tied to Level 2+ autonomy rollouts across mass-market vehicle segments.
Quantitatively, the average premium vehicle now integrates over 100 discrete embedded control units compared with roughly 70 just five years earlier, and semiconductor content per vehicle has risen at a compound rate exceeding 8% annually even as overall unit vehicle production growth has remained closer to 2% to 3% per the pattern reported in national automotive production and shipment data.
Strategically, this mechanism is shifting embedded suppliers’ commercial models toward long-term platform-level contracts with multi-year visibility, compressing customer acquisition costs for design wins but requiring qualification cycles of 18 to 24 months, which delays revenue recognition even as it raises gross margins by an estimated 200 to 300 basis points for suppliers who successfully transition from discrete component sales to integrated automotive-grade platform licensing.
Restraints
| Restraint | (~) % CAGR | Geographic Relevance | Impact Timeline |
|---|---|---|---|
| Legacy-node foundry capacity constraints | -1.2% | Taiwan, China, Global supply chain | Short term (≤ 2 years) |
| Elevated interest rates delaying industrial CapEx | -0.9% | North America, Europe | Short term (≤ 2 years) |
| Export control restrictions on advanced chip technology | -0.8% | China, United States, allied export-control jurisdictions | Short term (≤ 2 years) |
| Component price volatility from tariff escalation | -0.5% | United States, China, Southeast Asia | Short term (≤ 2 years) |
| Statutory cybersecurity compliance deadlines freezing shipments | -0.4% | European Union | Short term (≤ 2 years) |
Legacy-Node Foundry Capacity Constraints
The root cause of this restraint is that embedded microcontrollers overwhelmingly rely on mature process nodes of 28nm and above, and foundry capital allocation has disproportionately favored leading-edge nodes below 5nm for AI accelerators, leaving legacy-node utilization rates persistently above 90% and creating an active supply freeze rather than a mere slowdown.
The quantitative bottleneck manifests as automotive-grade microcontroller lead times still exceeding 12 months for specific part numbers as of the current window, with price increases of over 30% versus pre-shortage baselines documented across distributor and industry-association sourcing data, directly halting shipment schedules for OEMs unable to secure allocation.
The strategic business impact is twofold: embedded system designers are forced into costly board redesigns to substitute pin-incompatible parts, adding 4 to 8 weeks to product qualification cycles, while margin compression of approximately 150 to 250 basis points is being absorbed by manufacturers who cannot fully pass component cost inflation onto price-sensitive industrial and consumer customers.
Challenges
| Challenge | (~) % CAGR | Geographic Relevance | Mitigation Horizon |
|---|---|---|---|
| Embedded firmware talent deficit | -0.7% | Global, acute in North America, Europe | Long term (≥ 4 years) |
| Fragmented RTOS and toolchain ecosystem | -0.5% | Global | Medium term (2–4 years) |
| Rising cybersecurity attack surface | -0.6% | Global, critical infrastructure regions | Long term (≥ 4 years) |
| Multi-tier supplier logistics complexity | -0.4% | Southeast Asia, Eastern Europe | Medium term (2–4 years) |
| Functional safety certification bottlenecks | -0.3% | Europe, North America, Japan | Medium term (2–4 years) |
Embedded Firmware Talent Deficit
The structural vulnerability stems from embedded software engineering requiring a specialized blend of low-level C/C++ proficiency, real-time operating system expertise, and hardware-software co-design skills that university curricula have under-produced relative to demand, with industry association workforce surveys estimating a global shortfall exceeding 1 million qualified embedded engineers persisting through the current planning horizon.
The quantitative friction is evident in average time-to-fill for senior embedded firmware roles stretching to 4 to 6 months, roughly double the hiring velocity of general software roles, while salary inflation for embedded specialists has run at 8% to 12% annually in key innovation hubs, elevating R&D cost bases without proportionate output gains.
Long-term corporate adjustments required to navigate this include increased investment in low-code embedded development platforms and model-based design tools that can reduce required headcount-per-project by an estimated 15% to 20%, alongside nearshoring engineering functions to talent pools in Eastern Europe and India where comparable skills are available at 30% to 40% lower fully loaded cost, both of which require multi-year organizational restructuring rather than immediate fixes.
Opportunities
| Opportunity | (~) % CAGR | Geographic Relevance | Execution Window |
|---|---|---|---|
| Open-standard RISC-V architecture monetization | +1.6% | Global, led by China, India, Europe | Medium term (2–4 years) |
| Embedded-systems-as-a-service subscription models | +1.0% | North America, Western Europe | Medium term (2–4 years) |
| Adjacent expansion into agritech and precision farming | +0.8% | India, Brazil, United States | Long term (≥ 4 years) |
| M&A roll-up of fragmented regional design houses | +0.6% | Southeast Asia, Eastern Europe | Long term (≥ 4 years) |
| Retrofit embedded security modules for legacy industrial fleets | +0.5% | Global, critical infrastructure operators | Medium term (2–4 years) |
Open-Standard RISC-V Architecture Monetization
This is classified as untapped future white space rather than a current driver because, while RISC-V core adoption is technically underway, the commercial monetization layer around it- licensable IP blocks, verified toolchains, and certified security stacks- remains largely uncaptured.
The unit-economic shift is substantial: royalty-free instruction set licensing can reduce per-unit IP costs by 15% to 25% compared to proprietary ARM-based licensing structures, freeing gross margin that can be redirected into differentiated software and security tooling, an area where early movers are already reporting margin expansion potential in the range of 300 to 500 basis points on software-attached embedded platforms.
Geopolitical Impact Analysis
Geopolitical tensions are reshaping the Embedded Systems Market’s cost base and supply timelines through tariff escalation, mineral concentration, and maritime rerouting. Section 232 tariffs on advanced semiconductors and microcontrollers, core inputs for embedded systems, rose to 25% effective January 15, 2026, while Section 301 duties on Chinese-origin chips reached 50%.
These levies directly raise landed costs for microprocessors, memory modules, and sensor ICs that embedded system OEMs source globally, compressing hardware margins and forcing dual-sourcing strategies across Southeast Asia and Mexico under USMCA exemptions. Compounding this, the IEA’s Global Critical Minerals Outlook 2025 reports China controlled 91% of global refined rare earth output in 2024, with the top three refining nations’ average market share climbing from 82% in 2020 to 86% in 2024.
On logistics, the Red Sea crisis has cut Suez Canal container transits by up to 90% since December 2023, per World Bank analysis, forcing carriers onto the Cape of Good Hope route. This adds 10 to 14 days of transit time per voyage and sustains freight premiums of 25% to 35% on Asia-Europe lanes, directly delaying delivery of PCBs, connectors, and embedded modules manufactured in China, Taiwan, and Vietnam for European and Middle Eastern integrators.
Extended transit also raises in-transit inventory carrying costs, estimated at roughly $2.5 million in tied-up capital per shipment for large-volume electronics cargoes, pressuring embedded systems vendors to hold 10% to 15% additional safety stock on critical components, further inflating working capital requirements industry-wide.
Regional Analysis
The Embedded Systems Market exhibits a distinctly regionalized growth pattern, with North America commanding the dominant position in the global landscape. North America holds the largest revenue share, capturing a substantial 34.0% of the global market and generating a market value of USD 40.0 billion, reinforcing its status as the leading region in embedded systems adoption.
This dominance stems from robust demand for connected and smart devices, a strong manufacturer base, and accelerated adoption of Internet of Things (IoT) technologies across automotive, healthcare, industrial, and consumer electronics applications. The presence of major technology companies and favorable R&D infrastructure further consolidates North America’s competitive edge, particularly in sectors like automotive, aerospace, and connected devices.
Asia Pacific has emerged as the fastest-growing region in the embedded systems market, propelled by its position as a global semiconductor manufacturing hub and rapid digital transformation across emerging economies. Growth in this region is driven by rising demand for low-power embedded systems, expanding automotive and consumer electronics sectors, increasing IoT penetration, and growing automation initiatives in agriculture and industrial applications.
Key Regions and Countries
- North America
- US
- Canada
- Europe
- Germany
- France
- The UK
- Spain
- Italy
- Rest of Europe
- Asia Pacific
- China
- Japan
- South Korea
- India
- Australia
- Rest of APAC
- Latin America
- Brazil
- Mexico
- Rest of Latin America
- Middle East & Africa
- GCC
- South Africa
- Rest of MEA
Key Players Analysis
The embedded systems market exhibits a clear two-tier structure led by analog and microcontroller incumbents and diversified semiconductor companies. Tier 1 leaders include Qualcomm, with USD 44.28 billion in total revenue in FY2025; Texas Instruments, with USD 17.68 billion; Infineon Technologies, with USD 14.66 billion; NXP Semiconductors, with USD 12.27 billion; and STMicroelectronics, with USD 11.84 billion.
Texas Instruments generated USD 14.01 billion from its Analog segment and USD 2.70 billion from Embedded Processing in FY2025. These segments reported operating income of USD 5.41 billion and USD 0.30 billion, respectively, highlighting the stronger profitability contribution of the company’s analog business.
Tier 2 challengers include Analog Devices, with revenue of USD 11.02 billion and net income of USD 2.27 billion, and Microchip Technology, with revenue of USD 4.71 billion. These companies compete through specialization in mixed-signal technologies and microcontrollers rather than overall scale. Microchip recorded the highest research and development intensity among the peer group at 23.0% of revenue, equivalent to USD 1.09 billion.
This was followed by Qualcomm at 20.4%, or USD 9.04 billion; NXP at 19.2%, or USD 2.36 billion; Infineon at 16.4%, or USD 2.41 billion; Analog Devices at 16.0%, or USD 1.77 billion; and Texas Instruments at 11.8%, or USD 2.08 billion.
This R&D disparity signals divergent strategic postures: TI leverages manufacturing scale and 300mm fab efficiency to sustain margins with lower relative R&D spend, while Microchip and Qualcomm rely on aggressive product-cycle innovation to defend share in automotive MCU and connected-embedded segments, respectively.
Top Key Players in the Market
- Renesas Electronics Corporation
- NXP Semiconductors N.V.
- Intel Corporation
- Samsung
- Microchip Technology Inc.
- Qualcomm Incorporated
- Infineon Technologies AG
- Texas Instruments Incorporated
- STMicroelectronics N.V.
- Fujitsu
- Analog Devices, Inc.
- Advanced Micro Devices, Inc.
Recent Developments
- In September 2025, STMicroelectronics announced a USD 60 million investment in its Tours, France facility for an advanced embedded semiconductor pilot line, targeted for Q3 2026. The broader FY2025 to FY2027 manufacturing plan includes doubling Agrate’s 300mm capacity to 4,000 wafers per week and increasing Crolles’ capacity to 14,000 wafers per week by 2027.
- In February 2026, SiTime agreed to acquire Renesas Electronics’ timing business for USD 1.5 billion in cash plus approximately 4.13 million shares, supported by USD 900 million in debt financing. The unit was expected to generate USD 300 million in revenue within 12 months, with the acquisition completed in June 2026.
Report Scope
| Report Features | Description |
|---|---|
| Market Value (2025) | USD 117.58 Billion |
| Forecast Revenue (2035) | USD 232.74 Billion |
| CAGR (2026-2035) | 7.07% |
| Base Year for Estimation | 2025 |
| Historic Period | 2020-2024 |
| Forecast Period | 2026-2035 |
| Report Coverage | Revenue Forecast, Market Dynamics, Competitive Landscape, Recent Developments |
| Segments Covered | By Component (Hardware, Software, Services), By System Size (Small-scale Embedded Systems, Medium-scale Embedded Systems, Large-scale Embedded Systems), By Type (Standalone Embedded Systems, Real-Time Embedded Systems, Network Embedded Systems, Mobile Embedded Systems), By Application (Automotive Systems, Healthcare, Consumer Electronics, Industrial Automation, Aerospace & Defense Technologies, Telecommunications, Smart Devices, Others) |
| Regional Analysis | North America – US, Canada; Europe – Germany, France, The UK, Spain, Italy, Rest of Europe; Asia Pacific – China, Japan, South Korea, India, Australia, Singapore, Rest of APAC; Latin America – Brazil, Mexico, Rest of Latin America; Middle East & Africa – GCC, South Africa, Rest of MEA |
| Competitive Landscape | Renesas Electronics Corporation, NXP Semiconductors N.V., Intel Corporation, Samsung, Microchip Technology Inc., Qualcomm Incorporated, Infineon Technologies AG, Texas Instruments Incorporated, STMicroelectronics N.V., Fujitsu, Analog Devices, Inc., Advanced Micro Devices, Inc. |
| Customization Scope | Customization for segments, region/country-level will be provided. Moreover, additional customization can be done based on the requirements. |
| Purchase Options | We have three licenses to opt for: Single User License, Multi-User License (Up to 5 Users), Corporate Use License (Unlimited Users and Printable PDF) |





































