


Report Overview
In 2024, the Global Digital Braille Displays Market was valued at USD 41.5 billion. The market is projected to grow at a CAGR of 6.2% during 2025–2034, reaching approximately USD 75.7 billion by 2034. North America dominated the global market in 2024, accounting for 34.2% of the total market share and generating approximately USD 14.1 billion in revenue.
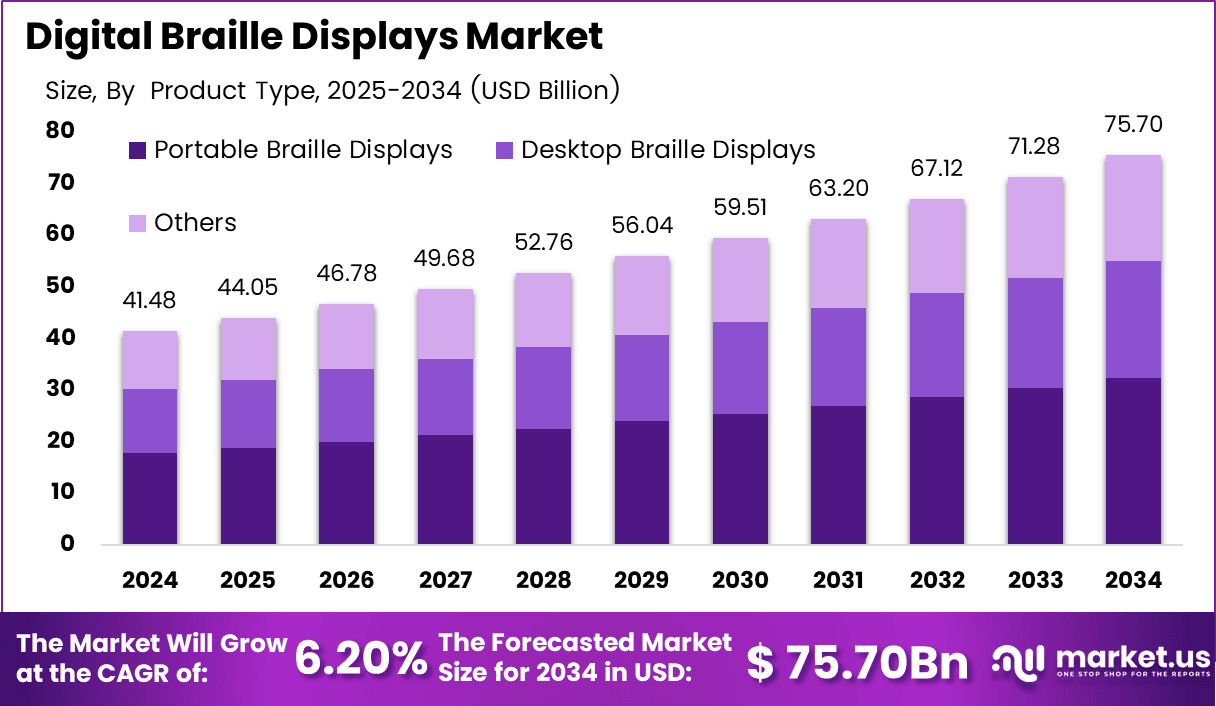
Digital Braille displays have seen significant advancements, offering greater accessibility for the visually impaired. These devices enable users to interact with digital content more effectively and efficiently, promoting inclusion in education, workplaces, and government services.
The market’s growth is further supported by the rise in portable display technology and government initiatives to improve accessibility standards globally. As technology continues to advance, digital Braille displays are expected to become even more prevalent, creating better opportunities for users with visual impairments to participate in daily life activities and employment.
Key Takeaways
- The Global Digital Braille Displays Market was valued at USD 41.5 billion in 2024 and is projected to reach approximately USD 75.7 billion by 2034, growing at a CAGR of 6.2% during 2025–2034.
- Portable Braille Displays dominated the US market with a 55% share in 2024, supported by their portability and compatibility with mobile devices, laptops, and tablets.
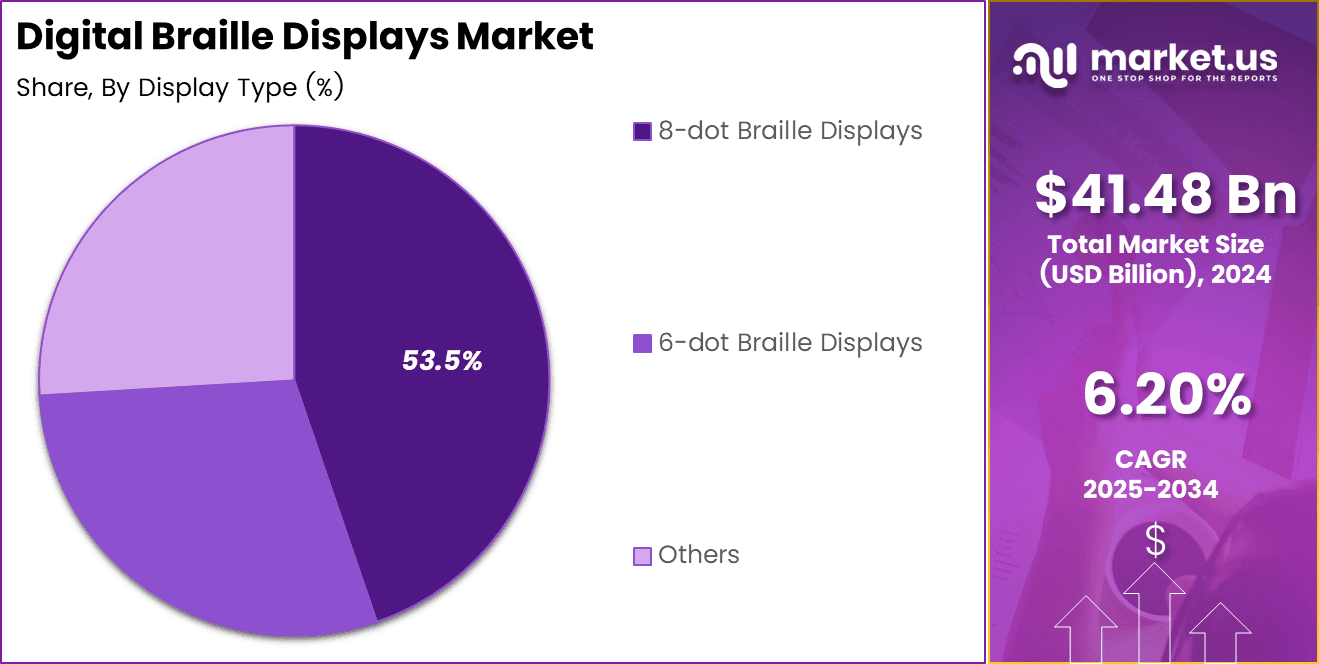
- 8-dot Braille Displays held the leading position with a 53.5% share, driven by their ability to display detailed content, mathematical formulas, scientific papers, and specialized text.
- Bluetooth led the connectivity segment with a 50% share in 2024, owing to its wireless functionality and seamless integration with smartphones, tablets, and laptops.
- Blind and Visually Impaired Individuals represented the largest end-user segment, accounting for 60% of the market share due to the growing demand for independent access to digital content.
- Piezoelectric Braille Cells dominated the technology segment with a 60% share, supported by their durability, reliable tactile feedback, and suitability for long-term personal and institutional use.
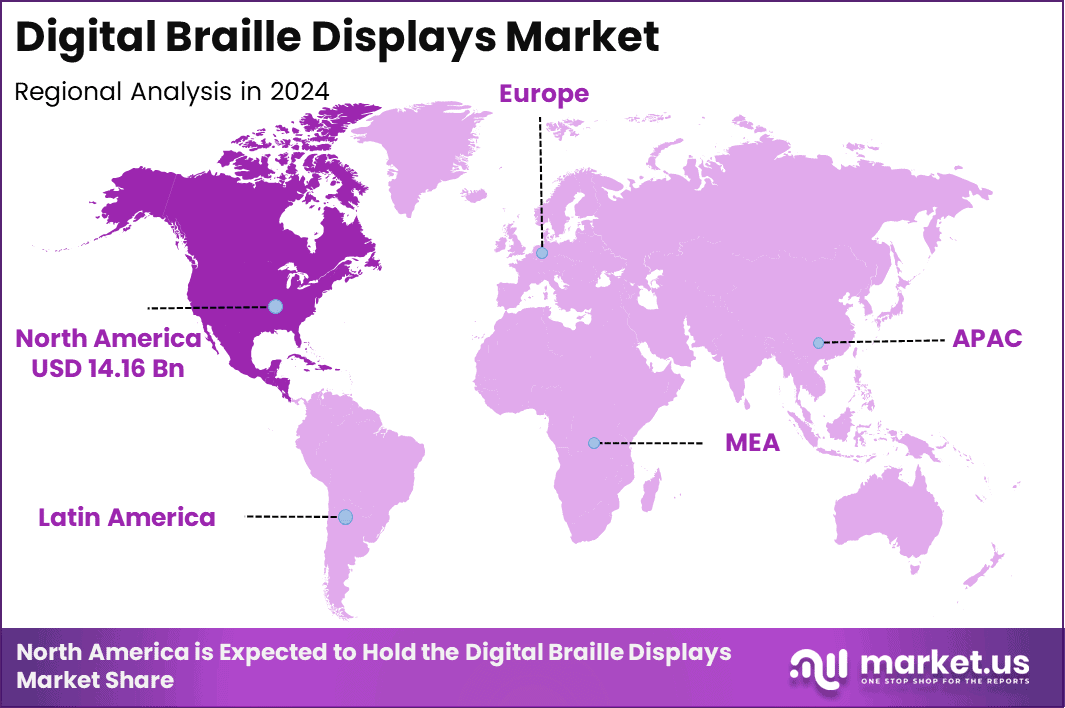
- North America dominated the global Digital Braille Displays Market with a market value of USD 14.16 billion in 2024.
By Product Type
Portable Braille Displays are expected to dominate the US Digital Braille Displays market with a 55% share by 2024. These displays are favored for their portability, providing users with a flexible solution for different environments such as education, workplaces, and public spaces. Their ability to connect seamlessly with mobile devices, laptops, and tablets makes them highly versatile, especially for users on the go.
The increasing demand for assistive technologies in education and the workplace is driving their growth. They offer a cost-effective solution for individuals with visual impairments, allowing them to engage with digital content, whether for reading, writing, or accessing information.
Desktop Braille Displays, representing 40% of the market share, are often preferred in institutional settings such as schools, universities, and government offices. They are stationary devices, offering larger screens and more robust features for long-term use. The Others category, comprising 5%, includes emerging technologies and specialized devices catering to niche applications.
By Display Type
8-dot Braille Displays are projected to dominate the market with 53.5% of the share due to their superior ability to display more Braille characters per line, enhancing readability and functionality. These displays are preferred in professional and educational environments where users need to access detailed, complex content, such as scientific papers, math formulas, and other specialized texts.
Meanwhile, 6-dot Braille Displays, which account for 40% of the market, are valued for their simplicity and cost-effectiveness. These displays are widely used in everyday settings and are ideal for general-purpose use, making them accessible for a broader user base, including individuals at home or in lower-budget educational institutions.
The Other Display Types category holds 6.5% of the market, representing innovative, specialized solutions for unique user needs or applications, such as interactive or hybrid systems that integrate Braille with tactile graphics.
By Connectivity
Bluetooth is expected to lead the connectivity market, holding 50% of the share by 2024. This is due to Bluetooth’s wireless functionality, which provides seamless integration with various devices like smartphones, tablets, and laptops. Bluetooth’s ability to allow users to connect their Braille displays to other devices without the need for wires enhances portability and convenience.
USB connectivity accounts for 25% of the market share, valued for its reliability and widespread compatibility with computers and other wired devices. USB-connected Braille displays are often used in educational and office environments where a stable, wired connection is preferred.
By End-User
The Blind and Visually Impaired Individuals segment is the largest, accounting for 60% of the market share. As the primary user group for Braille displays, this segment is crucial for driving demand. The growth of the market is directly tied to the increasing need for assistive technologies that enable individuals with visual impairments to access digital content independently.
Government Organizations, making up 10%, are also significant drivers of market growth through regulations and initiatives designed to improve accessibility in public services and workplaces. The remaining 10% consists of nonprofit organizations and various other entities focused on providing accessibility solutions to visually impaired individuals.
By Technology
The Piezoelectric Braille Cells technology is expected to dominate the market, holding 60% of the share. These cells use piezoelectric materials, which generate tactile feedback when stimulated by an electric current. The key advantages of piezoelectric Braille cells are their durability and high performance, which make them an ideal solution for long-term use in both personal and institutional settings.
The reliability and consistent tactile feedback they provide make them a preferred choice for many users. Electroactive Polymer Braille Cells, accounting for 40% of the market, are an alternative to piezoelectric cells. These cells use electroactive polymers that change shape when exposed to an electric field, enabling them to create tactile Braille characters.
Key Market Segments
By Product Type
- Portable Braille Displays
Desktop Braille Displays
Others
By Display Type
- 8-dot Braille Displays
- 6-dot Braille Displays
- Others
By Connectivity
- USB
- Bluetooth
- Wi-Fi
- Others
By End-User
- Blind and Visually Impaired Individuals
- Educational Institutions
- Enterprises and Workplaces
- Government Organizations
- Non-Profit Organizations
- Others
By Distribution Channel
- Online Retail
- Offline Retail
- Direct Sales
- Third-Party Distributors
- Others
By Technology
- Piezoelectric Braille Cells
- Electroactive Polymer Braille Cells
- Others
Regional Analysis
North America dominates the global market, holding a substantial share of USD 14.16 billion in 2024. This is due to a well-established infrastructure for accessibility solutions and extensive support from nonprofit organizations. The US market’s leadership is propelled by its large number of institutions, both governmental and private, implementing Braille technology in schools and workplaces.
The growing accessibility requirements have made portable Braille displays a preferred choice, holding a greater share in the market, with 55% of the sales attributed to this segment. Additionally, desktop Braille displays are expected to grow at a steady pace due to their use in office and educational environments.
US Market Size
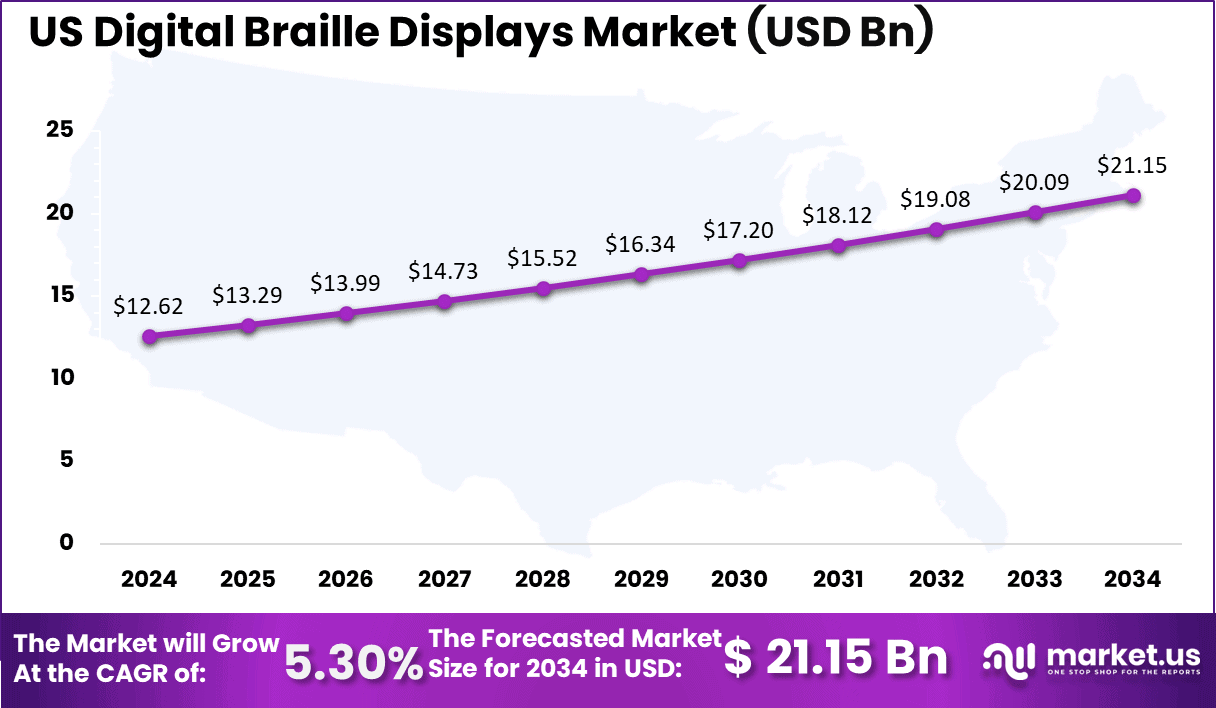
The US Digital Braille Displays Market is forecasted to reach USD 12.6 billion in 2024, and the market is expected to continue growing steadily, reaching USD 21.15 billion by 2034. The growth of the market is largely attributed to increased awareness and adoption of assistive technologies for visually impaired individuals, especially within educational institutions and government organizations.
Key Regions and Countries
North America
- US
- Canada
Europe
- Germany
- France
- The UK
- Spain
- Italy
- Rest of Europe
Asia Pacific
- China
- Japan
- South Korea
- India
- Australia
- Rest of APAC
Latin America
- Brazil
- Mexico
- Rest of Latin America
Middle East & Africa
- GCC
- South Africa
- Rest of MEA
Drivers
| Driver | (~) % Impact on CAGR | Geographic Relevance | Impact Timeline |
|---|---|---|---|
| Institutional procurement for inclusive education | +2.0% | North America, Europe, Asia-Pacific | Short term (≤ 2 years) |
| Integration with mainstream computing devices | +1.4% | Global | Medium term (2–4 years) |
| Stable assistive-tech funding and reimbursement | +1.1% | OECD economies | Short term (≤ 2 years) |
| Multi-line and tactile graphics innovation | +0.9% | Europe, Japan, select U.S. research hubs | Medium term (2–4 years) |
| Growing Braille literacy and advocacy campaigns | +0.8% | Global, with concentration in developed markets | Long term (≥ 4 years) |
| Corporate accessibility and compliance spending | +0.7% | North America, Western Europe | Medium term (2–4 years) |
Institutional procurement for inclusive education
Root cause is the steady expansion of inclusive education mandates since 2022, with ministries of education and school districts committing to equip blind and low-vision students with refreshable Braille displays as part of standardized assistive technology kits.
Public procurement datasets in the U.S. and EU show that specialized education budgets allocate between 5% and 12% of assistive-technology spending to Braille hardware, translating into thousands of units per year at typical unit prices in the low four-digit range and driving recurring replenishment cycles every 4–6 years.
This volume creates predictable, multi-year contracts that shift vendor business models from one-off device sales toward bundled service and maintenance agreements, lifting recurring revenue share by an estimated 10%–15% of total turnover and supporting a structural uplift of roughly +2.0% on the market’s baseline CAGR through higher utilization of manufacturing capacity and improved gross-margin leverage on fixed R&D costs.
Restraints
| Restraint | (~) % Impact on CAGR | Geographic Relevance | Impact Timeline |
|---|---|---|---|
| High device acquisition cost for individuals | -1.7% | Global, strongest in emerging markets | Short term (≤ 2 years) |
| Limited reimbursement coverage outside formal programs | -1.3% | North America, Latin America, Asia-Pacific | Medium term (2–4 years) |
| Concentrated supply base and long replacement cycles | -1.0% | Global | Long term (≥ 4 years) |
| Competing low-cost assistive alternatives | -0.9% | Global | Medium term (2–4 years) |
| Import duties and VAT on specialized hardware | -0.7% | Latin America, Africa, parts of Asia | Short term (≤ 2 years) |
| Limited distribution networks in low-income regions | -0.6% | Sub-Saharan Africa, South Asia | Long term (≥ 4 years) |
High device acquisition cost for individuals
The primary restraint is the elevated upfront cost of digital Braille displays relative to average household income, particularly in low- and middle-income economies, where typical device prices can equal 50%–200% of annual disposable income for blind individuals without institutional support.
Customs and assistive-technology procurement data indicate that individual retail purchases account for less than 20% of unit volumes, with many potential users facing out-of-pocket costs in the mid-three- to low-four-digit range and financing options that rarely extend beyond 12-month installment plans.
This cost barrier compresses accessible demand, effectively capping penetration rates at single-digit percentages of the addressable blind and low-vision population in several regions, reducing near-term sales growth by an estimated 1.7 percentage points versus the unconstrained baseline and forcing manufacturers to delay capacity-expansion CapEx and accept lower operating-margin scalability due to the smaller, more concentrated customer base.
Challenges
| Challenge | (~) % CAGR | Geographic Relevance | Mitigation Horizon |
|---|---|---|---|
| Complex piezoelectric manufacturing processes | -1.5% | Global, manufacturing hubs in Europe and Asia | Long term (≥ 4 years) |
| Specialized engineering talent scarcity | -1.2% | Global | Medium term (2–4 years) |
| Device reliability and maintenance burden | -1.0% | Global | Medium term (2–4 years) |
| Interoperability with evolving software ecosystems | -0.9% | Global | Medium term (2–4 years) |
| Lengthy procurement and approval cycles | -0.8% | Public-sector buyers worldwide | Short term (≤ 2 years) |
| Limited user training and support capacity | -0.7% | Global | Long term (≥ 4 years) |
Complex piezo-electric manufacturing processes
Digital Braille displays rely on intricate piezo-electric cell assemblies and precision mechanical components, creating a structural vulnerability where yield losses of 5%–10% per production batch and tight tolerances of less than 0.1 millimeters per pin increase per-unit manufacturing costs.
Factory-level data in established assistive-technology hubs show labor hours per device that are 2–3 times higher than for mainstream consumer electronics, with material scrap and rework rates adding 3%–5% to direct costs.
This quantitative friction limits throughput scaling and keeps gross margins constrained in the mid-30% to low-40% range even at moderate volumes, dragging potential CAGR by an estimated 1.5 percentage points and forcing long-term corporate adjustments such as multi-site manufacturing, greater automation investments, and tighter product-line rationalization to maintain economic viability.
Opportunities
| Opportunity | (~) % CAGR Upside | Geographic Relevance | Execution Window |
|---|---|---|---|
| Subscription-based access and device leasing models | +2.1% | Global, strongest in developed markets | Medium term (2–4 years) |
| Expansion into emerging-market education systems | +1.6% | Asia, Africa, Latin America | Long term (≥ 4 years) |
| Hybrid Braille and tactile graphics platforms | +1.4% | Global | Medium term (2–4 years) |
| Cloud-connected learning and content ecosystems | +1.2% | Global | Medium term (2–4 years) |
| Cross-industry partnerships with mobility and workplace platforms | +1.0% | North America, Europe, Japan | Long term (≥ 4 years) |
| Localized manufacturing and cost-optimized product tiers | +0.9% | Emerging markets | Long term (≥ 4 years) |
Subscription-based access and device leasing models
This upside is untapped because most digital Braille displays are still sold as high-cost capital goods, whereas shifting to subscription and leasing models can reframe the expenditure as an operating cost and dramatically lower monthly barriers for users and institutions.
Pilot programs in other assistive-technology categories indicate that leasing can spread a device’s cost over 36–60 months, reducing effective monthly outlays by 50%–70% compared with upfront purchase and enabling providers to bundle software updates and maintenance, which can improve device uptime by 10%–15%.
Strategically, this model supports margin expansion via service revenues that can add an extra 5%–8% to total gross margin and enhance unit economics by increasing fleet utilization rates above 80%, collectively providing a realistic upside of around +2.1% to market CAGR if broadly adopted.
Key Player Analysis
Tier-1 leadership in digital braille displays is concentrated among HumanWare (EssilorLuxottica), Freedom Scientific/Vispero, HIMS Inc., and Optelec, which collectively account for an estimated 55–65% of global refreshable braille hardware revenues in 2024, within a market of roughly USD 0.3–0.5 billion.
The narrower refreshable braille display market was around USD 400 million in 2023 and is projected to reach USD 850 million by 2032 at an 8.5% CAGR, with Tier-1 players estimated at USD 40–60 million each in annual braille-specific revenue.
HumanWare benefits from EssilorLuxottica’s 2023 R&D spending of roughly EUR 0.3–0.4 billion, equal to 2–3% of its EUR 25+ billion revenue. Vispero’s refreshable braille hardware accounts for an estimated 20–30% of segment revenues, supported by acquisitions including Optelec in 2015.
Tier-2 players such as Eurobraille, Harpo, Help Tech, BAUM Retec, Handy Tech, Papenmeier, Perkins/APH, and Dot Inc. generally hold sub-10% shares. Smaller firms typically allocate 5–8% of sales to R&D versus 1.5–2% for broader private industrial technology firms. Dot Inc. is likely below USD 10 million in annual braille-device revenue and targets displays below the traditional USD 3,500–15,000 price range.
Top Key Players
- HumanWare
- Freedom Scientific
- Vispero
- Papenmeier
- Handy Tech Elektronik GmbH
- Eurobraille
- Harpo
- BAUM Retec AG
- Nippon Telesoft Co., Ltd.
- Amedia Corporation
- HIMS Inc.
- Perkins Solutions
- Dot Incorporation
- Other
Recent Development
- In 2025, Freedom Scientific launched an upgraded version of its Focus Braille Display, featuring enhanced Bluetooth connectivity and a more compact design. This development targets users looking for portable and efficient solutions, especially in educational and professional settings, improving accessibility and ease of use for the visually impaired.
- In 2024, HumanWare introduced the Brailliant BI 40X, a new 40-cell Braille display offering better tactile feedback and improved performance. It integrates seamlessly with tablets, smartphones, and computers, making it an ideal choice for users requiring a versatile and reliable Braille display for daily activities, education, and work.
Report Scope
| Report Features | Description |
|---|---|
| Market Value (2024) | USD 41.4 Bn |
| Forecast Revenue (2034) | USD 75.7 Bn |
| CAGR (2025-2034) | 6.2% |
| Base Year for Estimation | 2024 |
| Historic Period | 2020-2023 |
| Forecast Period | 2025-2034 |
| Report Coverage | Revenue Forecast, Market Dynamics, Competitive Landscape, Recent Developments |
| Segments Covered | By Product Type (Portable Braille Displays, Desktop Braille Displays, Others), By Display Type (8-dot Braille Displays, 6-dot Braille Displays, Others), By Connectivity (USB, Bluetooth, Wi-Fi, Others), By End-User (Blind and Visually Impaired Individuals, Educational Institutions, Enterprises and Workplaces, Government Organizations, Non-Profit Organizations, Others), By Distribution Channel,(Online Retail, Offline Retail, Direct Sales, Third-Party Distributors, Others), By Technology (Piezoelectric Braille Cells, Electroactive Polymer Braille Cells, Others) |
| Regional Analysis | North America – US, Canada; Europe – Germany, France, The UK, Spain, Italy, Rest of Europe; Asia Pacific – China, Japan, South Korea, India, Australia, Singapore, Rest of APAC; Latin America – Brazil, Mexico, Rest of Latin America; Middle East & Africa – GCC, South Africa, Rest of MEA |
| Competitive Landscape | HumanWare, Freedom Scientific, Vispero, Papenmeier, Handy Tech Elektronik GmbH, Eurobraille, Harpo, BAUM Retec AG, Nippon Telesoft Co., Ltd., Amedia Corporation, HIMS Inc., Perkins Solutions, Dot Incorporation, Other |
| Customization Scope | Customization for segments, region/country-level will be provided. Moreover, additional customization can be done based on the requirements. |
| Purchase Options | We have three licenses to opt for: Single User License, Multi-User License (Up to 5 Users), Corporate Use License (Unlimited Users and Printable PDF) |





































