


Report Overview
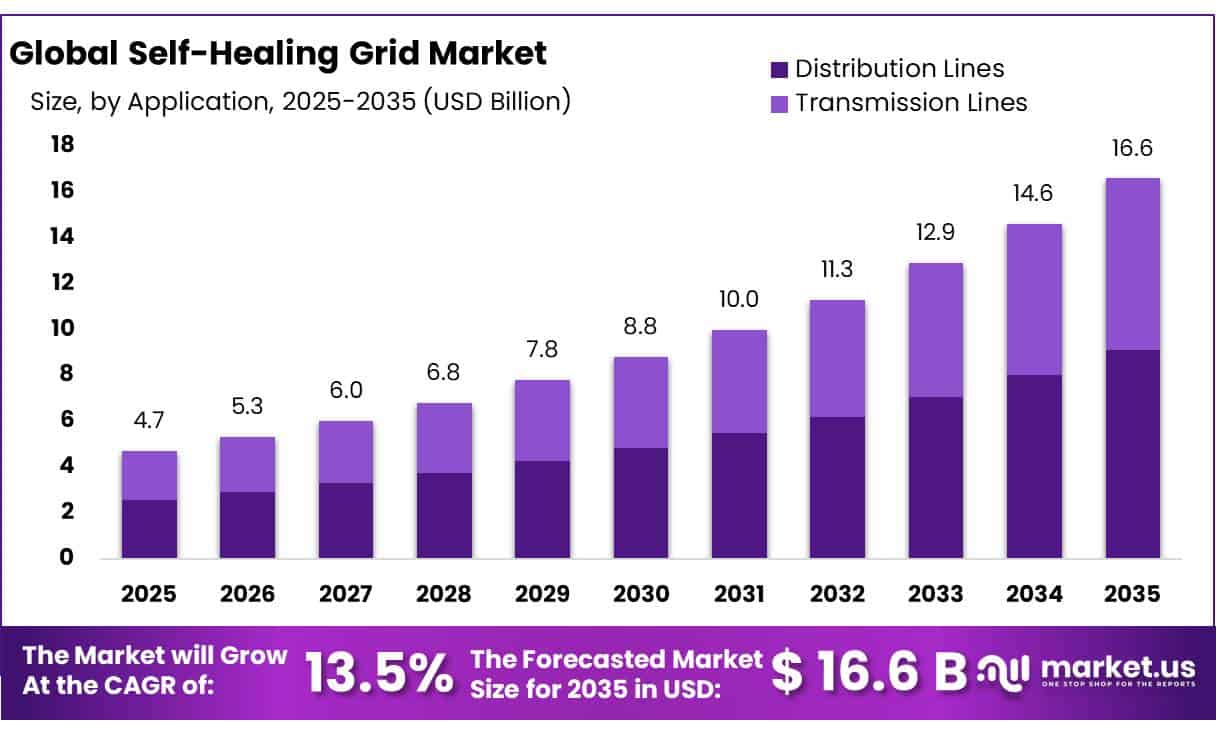
The Global Self-Healing Grid Market size is expected to be worth around USD 16.6 Billion by 2035, from USD 4.7 Billion in 2025, growing at a CAGR of 13.5% during the forecast period from 2026 to 2035. In 2025, North America held a dominant market position, capturing more than a 38.60% share, holding USD 0.5 Billion revenue.
The self-healing grid is an advanced smart-grid model in which distribution networks use sensors, automated switches, intelligent electronic devices, communications, and software to identify faults, isolate damaged sections, and restore electricity to unaffected customers with limited operator intervention.
- The International Energy Agency reported that global electricity demand increased by 3% in 2025 and is forecast to rise by 3.6% in 2026 and 3.8% in 2027. Renewable generation is expected to grow by more than 8% in 2026, increasing its global generation share from 33% in 2025 to 37% by 2027.
Grid investment is expanding, although spending remains below long-term system needs. The IEA estimated global grid investment at about USD 400 billion per year in 2025, compared with roughly USD 1 trillion spent on generation assets. In the European Union, the European Commission estimates EUR 584 billion of electricity-grid investment is required during 2020–2030, while about 40% of distribution grids are more than 40 years old.
- Reliability pressure is another major driver. U.S. electricity customers experienced about 11 hours of interruptions on average in 2024, and major events were responsible for 80% of outage hours, according to the U.S. Energy Information Administration.
Operational evidence explains growing utility interest in self-healing architectures. A 2024 U.S. Department of Energy resilience guide reported that Duke Energy Florida’s advanced FLISR approach can reduce major-event customer interruption minutes by more than 100 minutes per customer. The same guide noted that Tampa Electric expects at least a 40% reduction in interruption minutes on targeted circuits, while PG&E’s FLISR deployment across circuits serving 2.2 million customers was associated with an estimated customer benefit of around USD 200 million annually.
Government programs are accelerating deployment. The U.S. Department of Energy’s GRIP program provides up to USD 10.5 billion for grid resilience and innovation, while a March 2026 SPARK opportunity added approximately USD 1.9 billion for rapid transmission upgrades and advanced technologies.
Key Takeaways
- Self-Healing Grid Market size is expected to be worth around USD 16.6 Billion by 2035, from USD 4.7 Billion in 2025, growing at a CAGR of 13.5%.
- Hardware held a dominant market position, capturing more than a 45.00% share.
- Distribution Lines held a dominant market position, capturing more than a 54.00% share.
- On-Premises held a dominant market position, capturing more than a 68.00% share.
- Public Utilities held a dominant market position, capturing more than a 69.00% share.
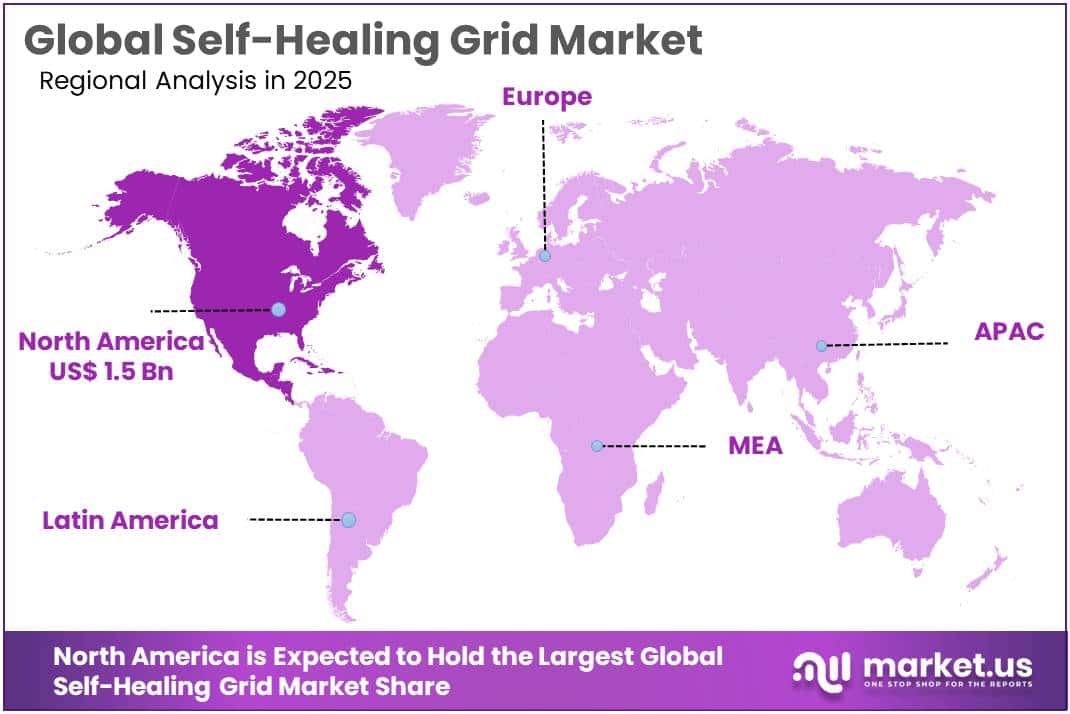
- North America held the dominant regional position in 2025, accounting for 33.50% of the Self-Healing Grid market and reaching USD 1.58 billion.
By Component Analysis
Hardware Holds 45.00% Share as Automated Grid Equipment Becomes Essential
In 2025, “Hardware” held a dominant market position, capturing more than a 45.00% share. Hardware remains central to self-healing grid deployment because utilities need intelligent switches, sensors, relays, fault indicators, smart meters, reclosers, and communication devices to detect disturbances and automatically reroute electricity. The U.S. Department of Energy explains that smart grids rely on advanced sensors, automated feeder switches, digital meters, and relays that can identify faults and support automatic recovery.
Hardware investment is also moving into practical distribution-grid projects. In January 2025, the U.S. Department of Energy documented an Anaheim Public Utilities modernization project involving the replacement of 40 PMV switches with advanced automation technology connected with new outage-management and SCADA systems. Such projects show how utilities are adding field equipment that can communicate directly with control platforms and quickly isolate damaged sections of the network.
Software is becoming an important part of the Self-Healing Grid Market as utilities increasingly connect field devices with Advanced Distribution Management Systems, outage-management platforms, SCADA, distributed-energy-resource management systems, analytics, and automated restoration applications. In January 2025, the U.S. Department of Energy documented the deployment of an Advanced Distribution Management System by Imperial Irrigation District. The platform is designed to integrate existing operational systems while improving grid operability, reliability, and service performance.
By Application Analysis
Distribution Lines Lead the Self-Healing Grid Market with More Than 54.00% Share
In 2025, “Distribution Lines” held a dominant market position, capturing more than a 54.00% share. Distribution networks remain the main area for self-healing grid deployment because faults at the feeder level directly affect homes, businesses, and public services. Utilities are therefore adding automated switches, fault indicators, sensors, intelligent relays, and FLISR systems that can detect a problem, isolate the affected section, and restore healthy sections without lengthy manual intervention.
Government-backed projects show this shift clearly. In January 2025, the U.S. Department of Energy documented an Anaheim Public Utilities project that plans to replace 40 PMV switches with advanced automation technology integrated with outage-management and SCADA systems. These devices improve distribution-line visibility and allow operators to respond faster when a feeder experiences a fault.
Transmission Lines are becoming an important application area for self-healing grid technologies as utilities modernize high-voltage networks with advanced conductors, digital monitoring, automated controls, communications, and dynamic grid-management systems. These technologies help operators identify abnormal conditions more quickly, redirect power through alternative paths, and improve the ability of the wider grid to respond to equipment failures or rapid changes in electricity demand.
In January 2025, the U.S. Department of Energy announced a conditional loan guarantee of up to USD 1.6 billion to support the reconductoring or rebuilding of almost 5,000 miles of transmission lines. DOE stated that these upgrades could increase overall transmission capacity by approximately 70%, showing how modernization of existing corridors can provide additional capacity while improving reliability.
By Deployment Model Analysis
On-Premises Leads with More Than 68.00% Share as Utilities Keep Critical Grid Control Close to Their Operations
In 2025, “On-Premises” held a dominant market position, capturing more than a 68.00% share. On-premises deployment remains widely suited to self-healing grids because utilities operate critical systems such as SCADA, Advanced Distribution Management Systems, protection controls, outage management, and operational technology within tightly controlled environments. A 2025 U.S. Department of Energy report noted that, in many utility jurisdictions, on-premises software can be treated as capital expenditure, while cloud-based software-as-a-service is often treated as operating expenditure.
Security and direct operational control also support the segment. On January 16, 2025, the U.S. Cybersecurity and Infrastructure Security Agency released 12 Industrial Control Systems advisories covering vulnerabilities in industrial equipment and software from several major technology suppliers. Self-healing grids depend on connected relays, switches, substations, sensors, and control platforms, making protected OT environments important for utilities seeking to limit external exposure while maintaining rapid fault-response capability.
Cloud-Based deployment is gaining importance in the Self-Healing Grid Market as utilities handle larger volumes of meter, sensor, feeder, distributed-energy, outage, and weather information. Cloud-connected platforms can provide scalable computing capacity and allow utilities to run advanced analytics, forecasting, asset monitoring, and grid-planning applications without maintaining every computing resource inside a utility facility.
Government-backed digitalization programs show increasing interest in scalable software. In January 2026, the U.S. Department of Energy relaunched its Digitizing Utilities Prize with a total prize pool of more than USD 2.4 million. The program allows up to 16 teams to receive USD 75,000 during its first phase, while as many as 5 teams can receive USD 150,000 plus a USD 75,000 national-laboratory voucher in the following phase.
By End User Analysis
Public Utilities Lead with More Than 69.00% Share as Grid Automation Becomes a Reliability Priority
In 2025, “Public Utilities” held a dominant market position, capturing more than a 69.00% share. Public utilities are important adopters of self-healing grid technology because they are responsible for maintaining reliable electricity distribution across cities and local communities. Automated switches, smart meters, fault indicators, SCADA systems, and distribution-management platforms allow these utilities to locate faults quickly, isolate damaged sections, and restore electricity to unaffected customers with less manual intervention.
Government-backed modernization projects show this shift. In January 2025, the U.S. Department of Energy documented a City of Arcadia grid-resilience project involving the replacement of approximately 1,257 existing AMR meters with the same number of advanced AMI meters, together with 2 gateway units and supporting AMI software. These upgrades provide utilities with better visibility and communication across the distribution network, forming an important foundation for automated and self-healing grid operations.
Private Utilities are increasingly investing in intelligent grid infrastructure as electricity demand rises and aging transmission and distribution assets require modernization. Investor-owned utilities can combine automated switching, advanced conductors, digital substations, sensors and real-time control systems with large capital programs. These investments improve network visibility and provide the technical foundation needed for self-healing functions, including automatic fault detection, network reconfiguration and faster restoration.
In October 2025, the U.S. Department of Energy closed a USD 1.6 billion loan guarantee for AEP Transmission to reconductor and rebuild around 5,000 miles of transmission lines across several U.S. states. DOE reported that the program is intended to improve grid reliability and transmission capability, while the associated investments are expected to support around 1,100 construction jobs.
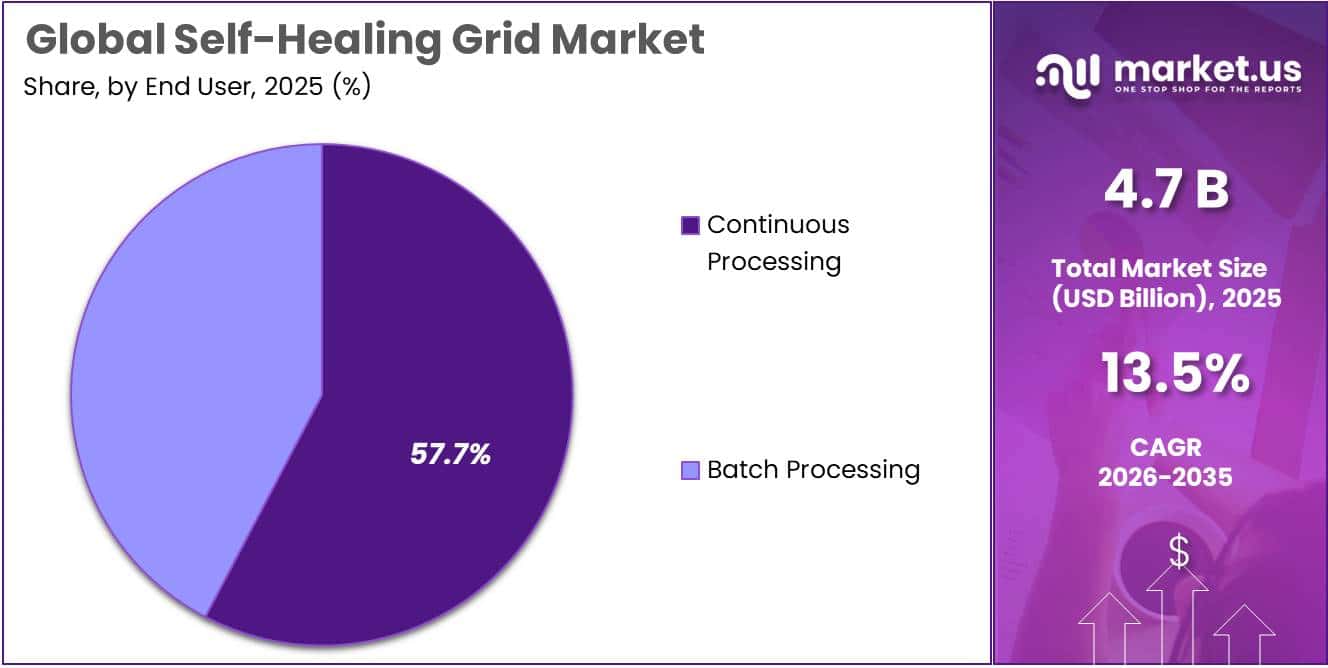
Key Market Segments
By Component
- Hardware
- Software
- Services
By Application
- Transmission Lines
- Distribution Lines
By Deployment Model
- On-Premises
- Cloud-Based
By End User
- Public Utilities
- Private Utilities
Driver Analysis
Resilience-Led Automation
Extreme-weather exposure is converting self-healing functionality from an optional smart-grid enhancement into a reliability investment with measurable avoided-outage economics: weather caused 80%—1,755 events—of major U.S. outages reported over 2000–2023, with severe weather accounting for 58% and winter storms 23% of weather-related events, while DOE has estimated unforeseen outages at about $150 billion annually and earlier quantified severe-weather outage losses at $18–33 billion in an average year and $40–75 billion in a major-storm year such as 2008.
FLISR directly monetizes this exposure by coordinating line sensors, reclosers and feeder switches to isolate a fault and transfer unaffected load in seconds rather than waiting for manual patrol and switching; DOE demonstrations reported 37–55% fewer customer interruptions and roughly 50% fewer customer-minutes interrupted, supporting an analyst-estimated +1.4 pp contribution to attainable 2026–2031 market CAGR where utilities can place a value on SAIDI, SAIFI, CMI, truck rolls and regulatory penalties.
Commercially, the driver shifts procurement from isolated switchgear replacement toward feeder-level resilience packages—ruggedized field devices, communications, FLISR software, ADMS integration, commissioning and lifecycle cybersecurity—raising software and services content per automated feeder and favoring multiyear framework contracts; the near-term impact is strongest in North America and weather-exposed EU/APAC systems because resilience budgets can justify automation even where incremental energy-sales revenue is negligible.
Drivers Impact Analysis
| Driver | (~) % Impact on CAGR Forecast | Geographic Relevance | Impact Timeline |
|---|---|---|---|
| Resilience-led automation | +1.4 pp | North America; EU; storm-prone APAC | Short term (≤ 2 years) |
| DER and VRE integration | +1.2 pp | EU; China; Australia; U.S. | Medium term (2–4 years) |
| Accelerating load growth | +1.0 pp | North America; China; India | Medium term (2–4 years) |
| Public grid funding | +0.9 pp | U.S.; EU; China; India | Short term (≤ 2 years) |
| Aging-grid modernization | +0.7 pp | EU core; North America; Japan | Long term (≥ 4 years) |
| Digital-control convergence | +0.5 pp | Global utility corridors | Medium term (2–4 years) |
Restraint Analysis
High Upfront CapEx
Self-healing capability requires utilities to fund field switches, intelligent reclosers, line sensors, substation gateways, communications, ADMS/SCADA integration, cybersecurity controls, civil work, testing, and operator training before reliability benefits can be fully monetized; the analyst planning range is approximately $0.5–2.5 million per feeder for partial-to-advanced automation, implying $50–250 million for a 100-feeder deployment before fleet-wide control-room upgrades, while systems integration can add 20–35%, cybersecurity 5–10%, project contingency 10–20%, and annual software and support 3–7% of initial system value.
The $14.5 billion allocated across more than 1,120 federally supported U.S. projects indicates an approximate $12.9 million average award, confirming that even publicly backed modernization programs require institution-scale financing rather than routine maintenance budgets.
At an assumed utility cost of capital of 7–10%, a two-year regulatory lag can reduce project net present value by roughly 8–17%, while uncertain approval of resilience benefits can extend modeled payback from 5–7 years to 8–12 years; this shifts procurement toward phased feeder clusters, performance guarantees, managed-service contracts, and grant-supported programs, but it also delays full-network rollouts and produces the largest modeled restraint at approximately -1.3 percentage points.
Restraint Impact Analysis
| Restraint | (~) % Impact on CAGR Forecast | Geographic Relevance | Impact Timeline |
|---|---|---|---|
| High Upfront CapEx | -1.3 pp | Global; emerging utilities | Short term (≤ 2 years) |
| Legacy-System Lock-In | -1.0 pp | North America, EU, Japan | Long term (≥ 4 years) |
| Cybersecurity Compliance Burden | -0.9 pp | North America, EU, APAC | Medium term (2–4 years) |
| Grid-Equipment Bottlenecks | -0.8 pp | North America, EU, India | Short term (≤ 2 years) |
| Communications Coverage Gaps | -0.7 pp | APAC, Africa, Latin America | Medium term (2–4 years) |
| Specialist Workforce Shortage | -0.6 pp | North America, EU, Australia | Long term (≥ 4 years) |
Opportunity Analysis
Resilience-as-a-Service
Resilience-as-a-Service is an untapped monetization pivot rather than a baseline driver because most self-healing deployments are still purchased through front-loaded hardware, software and integration budgets, whereas the opportunity converts automation into a recurring contract priced per feeder, protected customer, avoided interruption minute or verified reliability improvement; the U.S. GRIP program was authorized for as much as $10.5 billion over five years, and DOE announced approximately $1.9 billion in March 2026 to catalyze additional electricity-infrastructure investment, demonstrating both substantial demand and continued dependence on episodic capital funding.
Under an independently modeled commercial structure, a vendor could finance a $1.0–2.5 million feeder cluster and charge $180,000–450,000 annually over 7–10 years, targeting an 11–16% project return while moving utility expenditure from CapEx to predictable OpEx; bundling field automation, communications, ADMS functions, cybersecurity maintenance and 24-hour monitoring could increase recurring revenue from approximately 5–10% to 25–40% of customer lifetime value, raise software-service gross margins toward 55–70%, and reduce replacement-cycle exposure.
Performance payments tied to a modeled 15–35% reduction in outage minutes would align supplier revenue with regulator-approved reliability benefits, while portfolio financing across 50–100 feeder projects could lower the effective cost of capital by 100–250 basis points versus individual utility procurements. This white space is most viable for municipal utilities, cooperatives and mid-sized distribution companies lacking engineering scale, but requires bankable performance measurement, insurance coverage and shared-savings regulation; successful execution could add approximately 1.1 percentage points to market CAGR.
Opportunity Impact Analysis
| Opportunity | (~) % Potential CAGR Upside | Geographic Relevance | Execution Window |
|---|---|---|---|
| Resilience-as-a-Service | +1.1 pp | North America, EU, Australia | Short term (≤ 2 years) |
| DER-Aware Restoration | +1.0 pp | North America, EU, Japan | Medium term (2–4 years) |
| Critical-Load Resilience Zones | +0.9 pp | U.S., EU, APAC hubs | Short term (≤ 2 years) |
| Edge-AI Autonomy | +0.7 pp | North America, EU, East Asia | Medium term (2–4 years) |
| Interoperability Retrofit Layer | +0.6 pp | Global brownfield grids | Short term (≤ 2 years) |
| Modular Emerging-Grid Kits | +0.5 pp | India, ASEAN, Africa, LATAM | Medium term (2–4 years) |
Challenges Analysis
Topology Data Drift
Self-healing performance depends on an accurate, continuously synchronized network model, yet feeder switching, temporary jumpers, phase corrections, asset replacements, customer transfers, DER connections, and emergency repairs cause the physical grid to diverge from geographic-information-system, SCADA, outage-management, and ADMS records; DOE identifies distribution-level data quality, visibility, interoperability, and conversion of field data into operational decisions as continuing last-mile digitalization gaps rather than one-time procurement problems.
In an independently modeled 1,000-feeder utility with 50–150 monitored assets per feeder, a monthly configuration-change rate of only 0.5–2.0% creates approximately 250–3,000 records requiring reconciliation; if 2–5% remain incorrect for more than 24–72 hours, restoration logic may evaluate hundreds of devices against outdated connectivity, phase, normal-status, or protection data.
Manual validation at 0.5–2.0 engineering hours per discrepancy can consume 3,000–20,000 labor hours annually, while topology-processing errors may force operators to suspend automated switching on 5–15% of feeders until records are corrected, reducing software utilization without stopping equipment sales. Sustained mitigation requires mobile field-data capture, automated GIS–ADMS reconciliation, switch-state confidence scoring, phase-identification analytics, daily model-difference checks, and formal data ownership, adding an estimated 4–8% to lifecycle operating expenditure but reducing erroneous switching recommendations by a modeled 40–70%; until these practices become standard, topology drift imposes approximately -0.9 percentage points of CAGR friction through slower replication and higher post-installation support intensity.
Challenges Impact Analysis
| Challenge | (~) % CAGR Friction Drag | Geographic Relevance | Mitigation Horizon |
|---|---|---|---|
| Topology Data Drift | -0.9 pp | Global brownfield grids | Medium term (2–4 years) |
| DER Protection Complexity | -0.9 pp | North America, EU, APAC | Long term (≥ 4 years) |
| Storm Communications Fragility | -0.8 pp | Global; rural grids | Medium term (2–4 years) |
| Multi-Vendor Lifecycle Friction | -0.7 pp | North America, EU, Japan | Long term (≥ 4 years) |
| OT Patching Trade-Offs | -0.6 pp | Global digital grids | Medium term (2–4 years) |
| Autonomous Logic Validation | -0.5 pp | Advanced utility markets | Long term (≥ 4 years) |
Geopolitical Impact Analysis
Russia–Ukraine War Accelerates Self-Healing Grid Resilience Investment
The ongoing Russia–Ukraine war continues to influence the Self-Healing Grid market by increasing attention on grid resilience, rapid restoration, decentralized control, and protection of critical electricity infrastructure. Repeated attacks on substations, transmission lines, generation assets, and distribution networks have shown utilities how quickly conventional grid systems can lose service when major assets are damaged.
- Ukraine’s State Energy Supervision Inspectorate reported in August 2026 that more than 11,600 damaged or destroyed electricity facilities had been inspected since the full-scale invasion began, including over 1,800 facilities during the first half of 2026. The Ukrainian Ministry of Energy also reported that electricity was restored to more than 4 million consumers during May 2026 following attacks and hostilities.
The wider geopolitical effect is also reaching equipment sourcing and cybersecurity. In August 2026, the U.S. government declared a national emergency concerning risks from certain foreign-supplied bulk-power equipment. For the Self-Healing Grid market, this environment is pushing utilities toward more secure automation, trusted suppliers, resilient communication networks, and systems capable of restoring service with less manual intervention globally.
Regional Insights
North America Leads the Self-Healing Grid Market
North America held the dominant regional position in 2025, accounting for 33.50% of the Self-Healing Grid market and reaching USD 1.58 billion. The region benefits from strong utility investment, aging-grid replacement, cybersecurity requirements, and growing demand from data centers and manufacturing.
- In March 2026, the U.S. Department of Energy announced about USD 1.9 billion for advanced transmission upgrades under the SPARK program. Canada is also supporting grid modernization through its CAD 4.5 billion Smart Renewables and Electrification Pathways Program, including smart-grid, storage, and non-emitting generation projects.
Asia Pacific is positioned as the fastest-growing regional segment as major economies expand electricity networks while adding more digital control. China’s National Energy Administration reported that national grid investment reached CNY 639.5 billion in 2025, with CNY 321.8 billion directed to distribution networks at 110 kV and below.
China also served 783.67 million electricity users by the end of 2025. For the 2026–2030 period, authorities plan more than CNY 5 trillion of investment in new grid development. This scale of spending supports stronger demand for intelligent substations, automated switching, fault monitoring, digital dispatch, and self-restoration technologies across the region.
Key Regions and Countries Insights
- North America
- US
- Canada
- Europe
- Germany
- France
- The UK
- Spain
- Italy
- Rest of Europe
- Asia Pacific
- China
- Japan
- South Korea
- India
- Australia
- Rest of APAC
- Latin America
- Brazil
- Mexico
- Rest of Latin America
- Middle East & Africa
- GCC
- South Africa
- Rest of MEA
Key Players Analysis
Siemens AG maintains a strong position in the Self-Healing Grid market through grid automation, protection, control, digital substations, and its Gridscale X software portfolio. In fiscal 2025, its Smart Infrastructure business generated €22.99 billion in revenue, up 8%, with profit reaching €4.51 billion and an order backlog of €19 billion. Grid-related demand was one of its strongest growth areas, supported by renewable integration, electrification, and resilient power distribution requirements.
ABB Ltd. supports self-healing grids through distribution automation, digital switchgear, circuit breakers, sensing, protection, and intelligent power-management technologies. In 2025, ABB generated total revenue of USD 33.22 billion, while its Electrification business contributed approximately USD 17.4 billion and employed around 53,400 people. Electrification orders reached USD 18.76 billion, increasing 14% from the previous year. Utility demand, data centers, and stronger power-distribution investment continued to support ABB’s grid automation and reliability solutions.
Schneider Electric SE addresses the Self-Healing Grid market through EcoStruxure Grid, digital services, automation, energy management, and network-monitoring technologies. The company reported €40.15 billion in revenue during 2025, representing 8.9% organic growth, while adjusted EBITA reached €7.52 billion with an 18.7% margin. Energy Management recorded 10% organic growth. Software and services represented 19% of annual revenue, while digital services posted double-digit growth, supported partly by Grid and cybersecurity solutions.
Top Key Players Outlook
- Siemens AG
- ABB Ltd.
- Schneider Electric SE
- GE Vernova Inc.
- Eaton Corporation plc
- S&C Electric Company
- Hitachi Energy Ltd.
- Mitsubishi Electric Corporation
- Landis+Gyr Group AG
- Itron, Inc.
- Oracle Corporation
- Cisco Systems, Inc.
- Honeywell International Inc.
- Schweitzer Engineering Laboratories, Inc.
- G&W Electric Company
Recent Developments
- In September 2026, Hitachi announced a USD 528 million Mississippi transformer plant expected to create more than 700 jobs, taking its U.S. manufacturing expansion commitment to around USD 1.5 billion.
- In April 2026, Eaton Corporation plc announced a further USD 30 million investment in a 370,000-square-foot Nebraska switchgear facility expected to create more than 200 jobs, strengthening supply for utility and critical power projects.
Report Scope
| Report Features | Description |
|---|---|
| Market Value (2025) | USD 4.7 Bn |
| Forecast Revenue (2035) | USD 16.6 Bn |
| CAGR (2026-2035) | 13.5% |
| Base Year for Estimation | 2025 |
| Historic Period | 2020-2024 |
| Forecast Period | 2026-2035 |
| Report Coverage | Revenue Forecast, Market Dynamics, Competitive Landscape, Recent Developments |
| Segments Covered | By Component (Hardware, Software, Services), By Application (Transmission Lines, Distribution Lines), By Deployment Model (On-Premises, Cloud-Based), By End User (Public Utilities, Private Utilities) |
| Regional Analysis | North America – US, Canada; Europe – Germany, France, The UK, Spain, Italy, Rest of Europe; Asia Pacific – China, Japan, South Korea, India, Australia, Singapore, Rest of APAC; Latin America – Brazil, Mexico, Rest of Latin America; Middle East & Africa – GCC, South Africa, Rest of MEA |
| Competitive Landscape | Siemens AG, ABB Ltd., Schneider Electric SE, GE Vernova Inc., Eaton Corporation plc, S&C Electric Company, Hitachi Energy Ltd., Mitsubishi Electric Corporation, Landis+Gyr Group AG, Itron, Inc., Oracle Corporation, Cisco Systems, Inc., Honeywell International Inc., Schweitzer Engineering Laboratories, Inc., G&W Electric Company |
| Customization Scope | Customization for segments, region/country-level will be provided. Moreover, additional customization can be done based on the requirements. |
| Purchase Options | We have three licenses to opt for: Single User License, Multi-User License (Up to 5 Users), Corporate Use License (Unlimited User and Printable PDF) |





































