


Report Overview
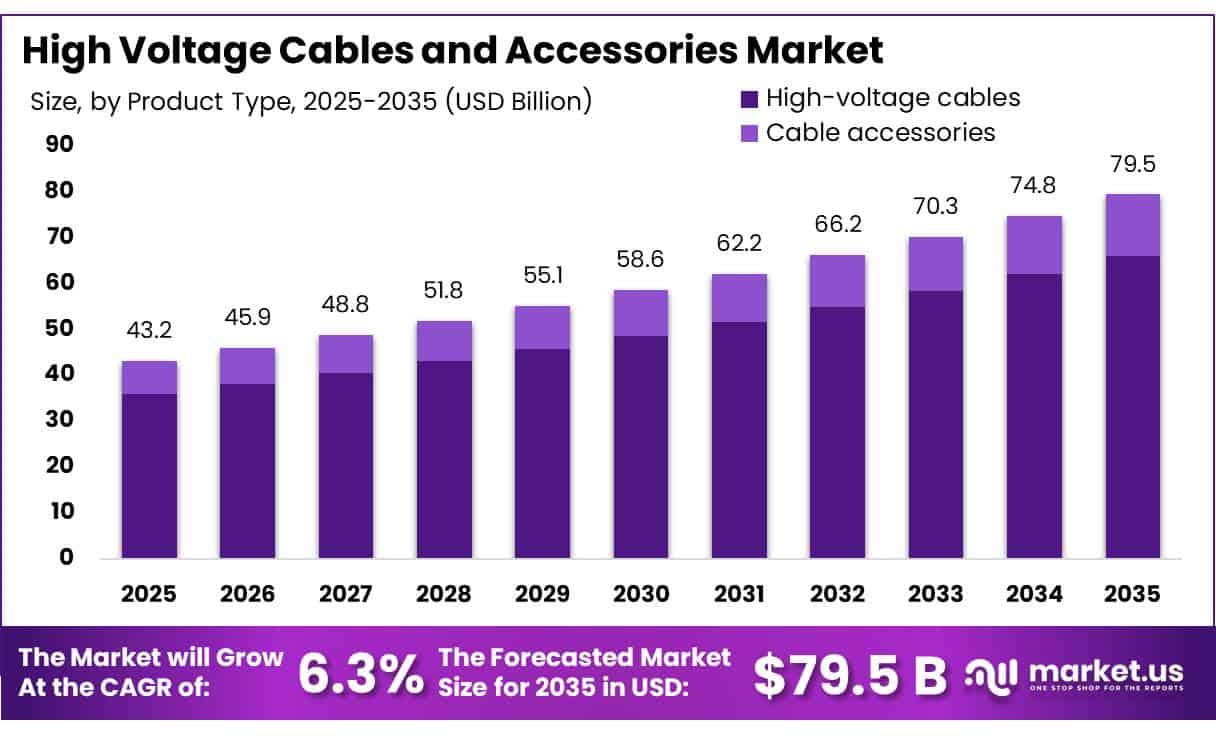
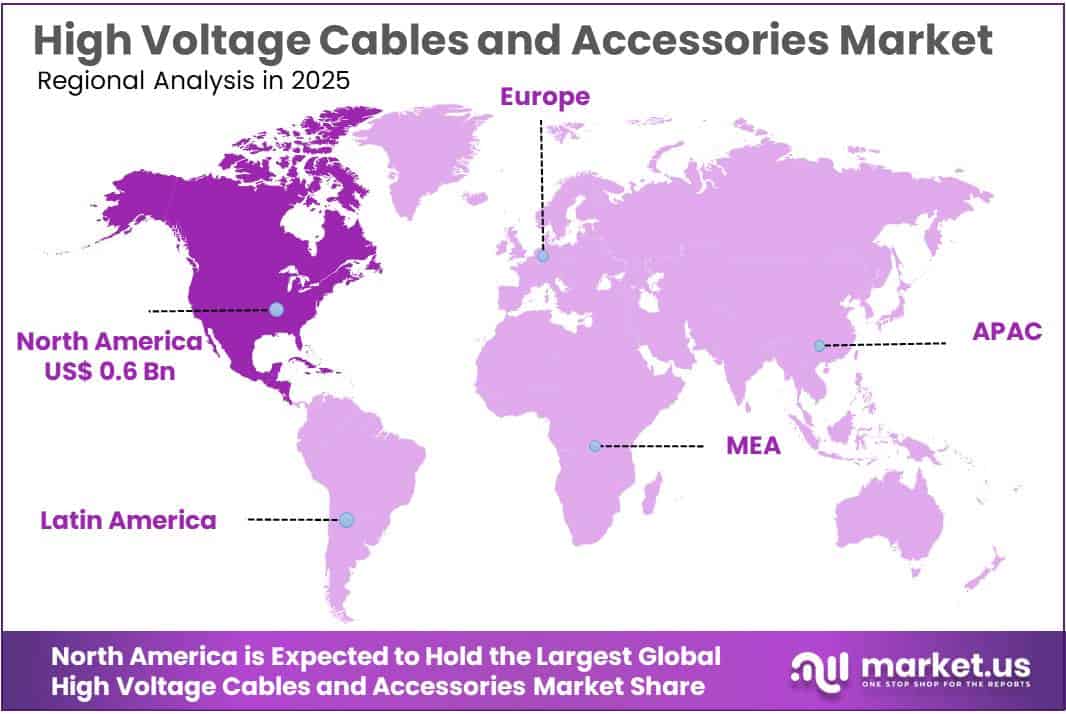
The Global High Voltage Cables and Accessories Market size is expected to be worth around USD 79.5 Billion by 2035, from USD 43.2 Billion in 2025, growing at a CAGR of 6.3% during the forecast period from 2026 to 2035. In 2025, Asia Pacific held a dominant market position, capturing more than a 32.50% share, holding USD 0.6 Billion revenue.
High-voltage cables and accessories form a critical part of transmission infrastructure, carrying electricity across long distances and linking generation assets with substations, industrial loads and cross-border networks. The industrial outlook is strengthening as global grid spending is around USD 400 billion a year, while renewable capacity increased by 585 GW in 2024 and reached about 4,448 GW worldwide.
- The International Energy Agency reported that global electricity demand increased by 3% in 2025 and expects growth of 3.6% in 2026 and 3.8% in 2027. Higher power use from data centres, electric vehicles, cooling systems, manufacturing facilities, and electrified buildings is pushing utilities to reinforce transmission networks.
Key Takeaways
- High Voltage Cables and Accessories Market size is expected to be worth around USD 79.5 Billion by 2035, from USD 43.2 Billion in 2025, growing at a CAGR of 6.3%.
- High-voltage cables held a dominant market position, capturing more than a 83.00% share.
- 231–400 kV held a dominant market position, capturing more than a 28.50% share.
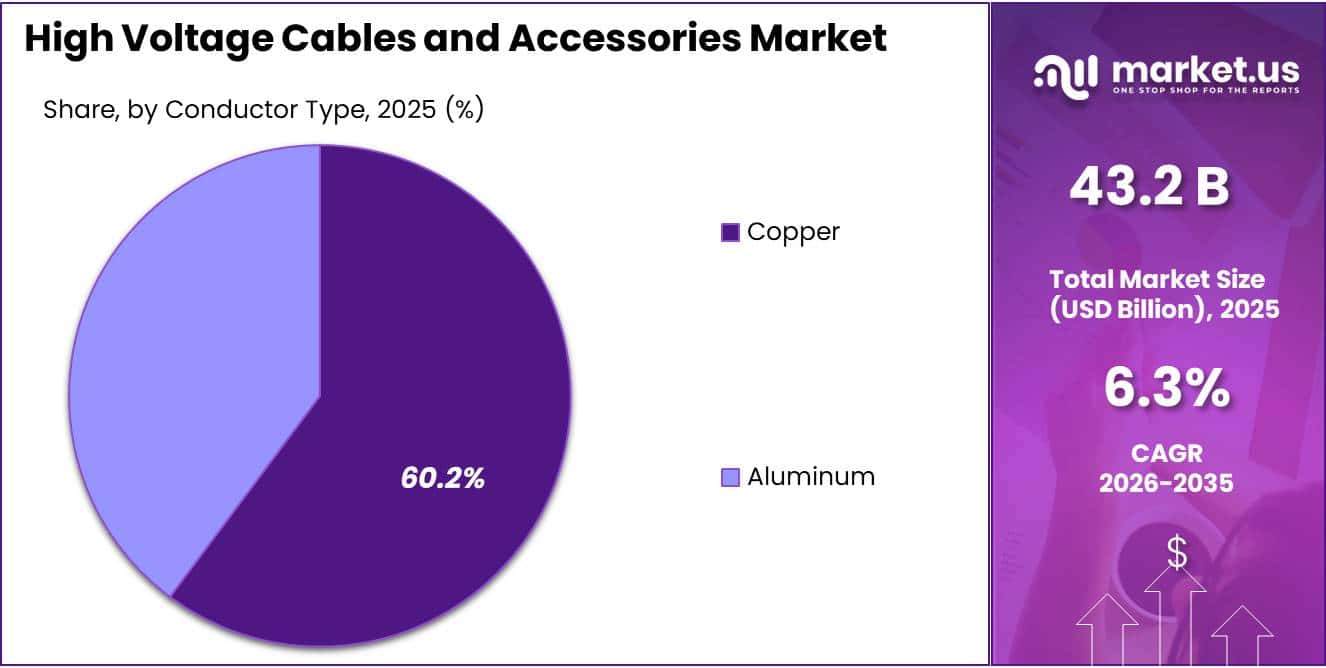
- Copper held a dominant market position, capturing more than a 60.00% share.
- Overhead held a dominant market position, capturing more than a 42.50% share.
- Power utilities held a dominant market position, capturing more than a 42.50% share.
- Asia Pacific held a dominant market position, capturing more than a 32.50% share and generating approximately USD 0.65 billion.
A major driver is the growing gap between power-generation investment and network capacity. More than 2,500 GW of renewable, storage, and large-load projects are currently waiting in grid connection queues worldwide. The IEA estimates that annual grid investment needs to rise by about 50% by 2030 from the current USD 400 billion level.
Europe provides a clear example of the infrastructure requirement. The European Commission expects EU electricity consumption to increase by around 60% by 2030, while 40% of distribution grids are already more than 40 years old. It estimates that approximately EUR 584 billion of electricity-grid investment will be needed during the decade.
Renewable integration, particularly offshore wind, is another important growth engine. Europe installed 19.1 GW of new wind capacity in 2025, including 2 GW of offshore wind connected to the grid. During the same year, about EUR 45 billion was raised for new European wind projects covering 20.9 GW of future capacity. Large offshore projects require submarine export cables, offshore joints, landfall systems, and HVDC technology, making this segment attractive for specialised cable suppliers.
By Product Type Analysis
High-voltage cables dominate with an 83.00% share as transmission networks expand
In 2025, “High-voltage cables” held a dominant market position, capturing more than a 83.00% share. The segment remained strong because utilities continued to build and upgrade long-distance transmission networks to handle rising electricity demand and new generation capacity.
- According to the U.S. Federal Energy Regulatory Commission, around 1,030 transmission-line projects entered service or were expected to be completed between October 2024 and September 2025, representing approximately 7,300 line-miles of infrastructure.
Cable accessories continue to form an important supporting segment because every high-voltage cable network requires joints, terminations, connectors and related insulation components for safe and stable operation. In 2025, FERC reported that more than 2,400 line-miles of new U.S. transmission infrastructure were concentrated at the 138 kV voltage level, showing continued construction activity that creates recurring requirements for cable connection and termination equipment.
In 2026, the U.S. Department of Energy also announced approximately USD 1.9 billion under its SPARK funding opportunity to accelerate reconductoring and advanced transmission upgrades.
By Voltage Rating Analysis
231–400 kV leads with a 28.50% share as utilities expand high-capacity transmission corridors
In 2025, “231–400 kV” held a dominant market position, capturing more than a 28.50% share. This voltage range remains widely used for bulk-power transmission because it can move large amounts of electricity over long distances while supporting renewable generation, regional interconnections and growing industrial loads.
According to the U.S. Federal Energy Regulatory Commission’s 2026 State of the Markets report, transmission projects completed during 2025 in the 250–345 kV range included 428 circuit miles in SPP, 308 circuit miles in ISO-New England and 241 circuit miles in MISO. These additions show continued investment in transmission infrastructure operating within the broader 231–400 kV category and support demand for high-voltage cables, insulation systems, joints and terminations.
Up to 100 kV cables continue to serve an important role in sub-transmission networks, utility connections and upgrades between local substations and distribution systems. In April 2025, the U.S. Department of Energy reviewed the Kalida–Ottoville 69 kV transmission project in Ohio, involving the rebuilding of approximately 8.3 miles of existing transmission infrastructure. In September 2025, another DOE-reviewed project covered the rebuilding of approximately 6.12 miles of a 69 kV transmission line in Ohio.
By Conductor Type Analysis
Copper dominates the conductor segment with a 60.00% share, supported by strong electrical applications
In 2025, “Copper” held a dominant market position, capturing more than a 60.00% share. Copper remained the preferred conductor material for many high-voltage cable systems because of its strong electrical conductivity, compact conductor size and reliable performance under heavy power loads.
According to the U.S. Geological Survey, U.S. apparent consumption of primary refined copper and copper recovered from old scrap reached about 2.2 million metric tons in 2025, while reported refined copper consumption stood at approximately 1.7 million metric tons. Electrical and electronic products accounted for 23% of U.S. copper and copper-alloy product use, highlighting the metal’s important role in power equipment, wiring and electrical infrastructure.
Aluminum continues to hold an important position in the high-voltage cable and accessories market, particularly in projects where lower conductor weight and easier handling are key requirements. U.S. Geological Survey data show that apparent aluminum consumption reached approximately 5.7 million metric tons in 2025, while electrical applications represented 9% of domestic aluminum consumption.
By Installation Analysis
Overhead dominates with a 42.50% share as long-distance transmission projects expand
In 2025, “Overhead” held a dominant market position, capturing more than a 42.50% share. Overhead installation remained widely preferred for high-voltage transmission because it can cover long distances, offers easier inspection and maintenance, and is practical for large grid-expansion projects.
In July 2025, the U.S. Department of Energy evaluated Phase 1 of the Grain Belt Express project, which includes a 542-mile overhead HVDC transmission line and a 36-mile overhead AC transmission line. Large projects of this type continue to support demand for high-voltage conductors, insulators, connectors and other line accessories used in bulk-power networks.
Underground installation continues to gain importance in urban areas, grid interconnections and projects where land constraints, environmental considerations and network reliability make buried cables more suitable.
In the UK’s 2025 Sea Link project documentation, the proposed system includes approximately 1.9 km of underground HVAC cable near the Friston Substation, about 10 km of underground HVDC cable between the converter station and the Suffolk landfall area, and approximately 1.7 km of underground HVDC cable on the Kent side.
By End User Analysis
Power utilities dominate with a 42.50% share as transmission networks undergo large-scale expansion
In 2025, “Power utilities” held a dominant market position, capturing more than a 42.50% share. Power utilities remained the largest end users because they continuously invest in transmission expansion, grid reinforcement and replacement of aging electricity infrastructure.
The U.S. Federal Energy Regulatory Commission reported that more than 1,900 transmission projects entered service across the United States in 2025, delivering over 7,000 miles of new transmission lines and upgrades.
Renewable energy is becoming an increasingly important end-user segment as large wind and solar projects require high-voltage transmission links to connect generation sites with the electricity grid. According to the U.S. Energy Information Administration, wind and utility-scale solar together generated about 760,000 GWh of electricity in 2025. Wind generation reached approximately 464,000 GWh, while utility-scale solar produced about 296,000 GWh during the year.
Key Market Segments
By Product Type
- High-voltage cables
- Cable accessories
By Voltage Rating
- Up to 100 kV
- 101–230 kV
- 231–400 kV
- Above 400 kV
By Conductor Type
- Copper
- Aluminum
By Installation
- Overhead
- Underground
- Submarine
By End User
- Power utilities
- Renewable energy
- Offshore wind
- Onshore wind
- Solar power
- Industrial
- Oil and gas
- Petrochemicals and chemicals
- Metals and mining
- Commercial and infrastructure
Driver Analysis
Grid Expansion and Renewal
Electricity-demand growth, electrification and renewable integration are forcing utilities to expand high-voltage transmission capacity and replace constrained legacy corridors, creating sustained demand for 66 kV–500 kV AC cable systems, extra-high-voltage 220 kV–765 kV links, HVDC cable, joints, terminations and GIS-connected accessories; the IEA projects that global annual grid investment must rise by 50% by 2030, while the U.S. Department of Energy targets a 16% expansion in long-distance transmission capacity by 2030 through 7,500 miles of new lines.
The United States already has more than 600,000 miles of high-voltage transmission infrastructure and DOE analysis indicates that transmission may need to expand by up to 3.5 times by 2050 to support load growth and reliability, converting cable demand from project-led procurement into a multi-year utility-capital-expenditure cycle.
For cable suppliers, the economic effect is substantial because turnkey high-voltage cable packages can price at USD 0.4–1.5 million per circuit-km for underground HVAC systems and materially more for HVDC/subsea applications, while accessories can represent 12–25% of installed cable-system value; manufacturers with vertical integration across conductor drawing, XLPE insulation, testing, joints and field installation can therefore capture higher-margin system revenue rather than commodity conductor sales, provided they secure production slots 24–48 months before project energization.
Drivers Impact Analysis
| Driver | (~) % Impact on CAGR Forecast | Geographic Relevance | Impact Timeline |
|---|---|---|---|
| Grid expansion and renewal | +2.4% | North America, EU, China, India | Medium term (2–4 years) |
| Offshore wind HVDC links | +1.9% | North Sea, China, Taiwan, US coasts | Long term (≥4 years) |
| Renewable interconnection build-out | +1.7% | APAC, EU, US, Latin America | Medium term (2–4 years) |
| Data-centre load growth | +1.4% | US, EU, China, India, Southeast Asia | Short term (≤2 years) |
| Aging-cable replacement cycle | +1.2% | North America, EU, Japan, Australia | Medium term (2–4 years) |
| Resilience and undergrounding | +1.0% | US, EU, Japan, Australia | Long term (≥4 years) |
Restraint Analysis
Copper Price and Tariff Exposure
Copper typically represents 30–45% of high-voltage cable manufacturing cost, meaning a 10% movement in copper prices can add roughly 3–5% to finished-cable cost before insulation, armouring, accessories, freight and installation are considered; copper reached a record USD 13,387 per tonne on January 6, 2026 after a late-2025 surge, while new mine supply faces an average development timeline of around 17 years from discovery to production.
The United States has added a further commercial distortion: Section 232 measures imposed a 50% tariff on covered semi-finished copper products from August 2025, and from April 6, 2026 applied 50% to the full value of covered semi-finished products and 25% to copper-intensive derivatives, including cables and connectors, with a lower 10% rate only where at least 95% of copper, steel and aluminium content is U.S.-sourced.
This increases landed-cost uncertainty for imported cable systems, complicates tender pricing for projects with 18–36-month delivery periods, and can compress manufacturer margins by 200–500 basis points when metal pass-through clauses lag spot movements; suppliers must therefore hedge metal exposure, separate copper adjustment mechanisms from conversion pricing, regionalize conductor sourcing and carry higher collateral or inventory buffers, all of which raise working-capital requirements and can render marginal underground or offshore projects uneconomic.
Restraint Impact Analysis
| Restraint | (~) % Impact on CAGR Forecast | Geographic Relevance | Impact Timeline |
|---|---|---|---|
| HVDC factory-capacity scarcity | -2.0% | EU, North America, APAC offshore corridors | Medium term (2–4 years) |
| Copper price and tariff exposure | -1.6% | North America, EU, import-dependent APAC | Short term (≤2 years) |
| Undergrounding CapEx burden | -1.4% | North America, EU, Japan, Australia | Long term (≥4 years) |
| Permitting and right-of-way delays | -1.3% | North America, EU, India, Latin America | Medium term (2–4 years) |
| Cable-laying vessel shortage | -1.1% | North Sea, US coasts, APAC offshore | Medium term (2–4 years) |
| Accessory qualification complexity | -0.9% | Global; EU, North America, China | Medium term (2–4 years) |
Opportunity Analysis
Integrated HVDC Cable Systems
The largest unexploited value pool lies in moving from supply of individual high-voltage cable lengths to an integrated HVDC-system model combining 320–525 kV cable, factory-tested joints, GIS terminations, route engineering, installation supervision, spare-cable management, vessel coordination and 20–30-year condition monitoring; this is an opportunity, not a current driver, because much of the market still tenders cables, accessories, civil works and monitoring separately, leaving interface risk with utilities or EPC contractors.
Europe’s December 2025 Grids Package identified that only 32 GW of the 66 GW cross-border transmission capacity needed by 2030 is currently addressed, while priority corridors include an almost 900 km submarine connection to Cyprus and an 8 GW Spain–France interconnection target by 2040. India’s transmission plan also envisages approximately 33 GW of HVDC additions between 2023 and 2032, including an 800 kV Gujarat–Maharashtra corridor designed to evacuate up to 8 GW from a renewable-energy zone.
A supplier that packages these elements can increase revenue capture from accessories and services from roughly 12–25% of cable-system value toward 25–40%, improve project gross margin by 300–600 basis points, and convert a one-off delivery into a long-duration service annuity; the barrier is high—HVDC capacity expansion requires USD 150–400 million for a new EHV production line and a 3–5-year qualification cycle—but early factory-slot investment, converter-OEM alliances and marine-contractor partnerships can secure disproportionate share of the next interconnector cycle.
Opportunity Impact Analysis
| Opportunity | (~) % Potential CAGR Upside | Geographic Relevance | Execution Window |
|---|---|---|---|
| Integrated HVDC cable systems | +2.3% | EU, India, China, North America | Long term (≥4 years) |
| Grid digital-twin services | +1.6% | North America, EU, Japan, Australia | Medium term (2–4 years) |
| Data-centre connection packages | +1.5% | US, EU, India, Southeast Asia | Short term (≤2 years) |
| Domestic accessory localisation | +1.3% | India, US, EU, Brazil | Medium term (2–4 years) |
| Circular cable recovery platforms | +1.1% | EU, North America, Japan | Long term (≥4 years) |
| Fragmented installer roll-ups | +0.9% | India, Southeast Asia, Latin America | Short term (≤2 years) |
Challenges Analysis
Specialist Jointer Talent Gap
High-voltage cable growth is increasingly constrained by the limited supply of certified jointers, termination technicians, high-voltage test engineers and marine-installation specialists capable of installing 132–525 kV HVAC and HVDC systems without introducing microscopic insulation defects that can later generate partial discharge, thermal runaway or catastrophic failure; the IEA found that more than half of over 700 surveyed energy firms reported critical hiring bottlenecks, particularly in applied technical occupations such as electricians, power-line workers and engineers, which represent over half of the energy workforce despite accounting for only about 25% of employment in the broader economy.
The installation productivity constraint is severe: a trained crew may complete only 1–3 complex 220–400 kV field joints per week after controlled preparation, curing, testing and documentation, while one joint failure on a critical route can trigger excavation, cable replacement and retesting costs of several million USD; an aging specialised subsea workforce further raises repair-response risk.
Challenges Impact Analysis
| Challenge | (~) % CAGR Friction Drag | Geographic Relevance | Mitigation Horizon |
|---|---|---|---|
| Specialist jointer talent gap | -1.3% | EU, North America, APAC offshore | Long term (≥4 years) |
| EHV material-quality control | -1.1% | Global; EU, China, North America | Medium term (2–4 years) |
| Offshore installation scheduling | -1.0% | North Sea, US coasts, APAC | Medium term (2–4 years) |
| Multi-vendor interface risk | -0.9% | Global; cross-border projects | Medium term (2–4 years) |
| Climate-resilient route engineering | -0.8% | US, EU, Japan, Australia, coastal APAC | Long term (≥4 years) |
| Cyber-physical asset integration | -0.7% | North America, EU, China, Japan | Medium term (2–4 years) |
Geopolitical Impact Analysis
Wars Raise Grid-Rebuilding Demand and Cable Supply Risks
The Russia–Ukraine war and renewed Middle East tensions are reshaping the High Voltage Cables and Accessories market by increasing both supply-chain risk and grid-rebuilding demand. Continued attacks on Ukraine’s energy infrastructure have damaged substations and transmission networks, creating urgent requirements for replacement cables, joints, terminations and grid equipment. In 2026, the European Commission announced €920 million for a 2026–2027 Winter Energy Plan to repair, rebuild and strengthen Ukraine’s energy networks, while the Ukraine Energy Support Fund has raised more than €2 billion since the war began.
For cable manufacturers, geopolitical pressure is encouraging regional sourcing, higher inventories and additional production capacity. For utilities, security concerns are accelerating investment in resilient transmission corridors, underground systems and cross-border interconnectors. The market therefore faces higher material and logistics uncertainty, but also stronger long-term demand from grid reinforcement, reconstruction and energy-security projects across Europe and other affected regions.
Regional Insights
Asia Pacific leads the market with a 32.50% share and USD 0.65 billion value
In 2025, Asia Pacific held a dominant market position, capturing more than a 32.50% share and generating approximately USD 0.65 billion. The region benefits from large transmission expansion, renewable integration, industrial electrification, and growing cross-border power connections.
IRENA reported that Asia added 513.3 GW of renewable capacity in 2025, representing 74.2% of global renewable additions, while total regional renewable capacity reached 2,891 GW. This rapid expansion is creating significant requirements for high-voltage AC and DC cables, submarine links, joints, terminations, and transmission accessories.
The Middle East is emerging as a fast-growing region as countries expand renewable generation, strengthen transmission networks, and develop large electricity-intensive industrial projects. IRENA reported that renewable power capacity in the Middle East increased by 28.9% in 2025, marking the region’s strongest annual expansion.
At the same time, the International Energy Agency estimated that Middle Eastern electricity demand increased by nearly 4% during 2025. Higher power requirements from cooling, urban development, industrial facilities, and new renewable projects are supporting investment in high-capacity transmission corridors and increasing the need for high-voltage cables and accessories.
Key Regions and Countries Insights
- North America
- US
- Canada
- Europe
- Germany
- France
- The UK
- Spain
- Italy
- Rest of Europe
- Asia Pacific
- China
- Japan
- South Korea
- India
- Australia
- Rest of APAC
- Latin America
- Brazil
- Mexico
- Rest of Latin America
- Middle East & Africa
- GCC
- South Africa
- Rest of MEA
Key Players Analysis
Prysmian S.p.A. remains one of the strongest suppliers in high-voltage cable systems, serving transmission operators, utilities and offshore energy projects. In 2025, the company generated €19.65 billion in revenue, while its Transmission business contributed €3.26 billion and delivered €582 million in adjusted EBITDA. Transmission recorded 28.7% organic growth, supported by submarine and land HVDC projects.
Nexans S.A. has strengthened its position as an electrification-focused cable manufacturer, with high-voltage transmission forming a key part of its strategy. In 2025, the company reported €6.10 billion in standard sales and €728 million in adjusted EBITDA. Organic growth reached 8.3%, while fourth-quarter PWR-Transmission growth climbed to 40.0%. Free cash flow stood at €344 million.
NKT A/S is a major European supplier of high-voltage power cable solutions, with strong exposure to offshore wind, interconnectors and long-distance transmission systems. In 2025, revenue at standard metal prices reached €2.72 billion, supported by 6% organic growth. Operational EBITDA rose to a record €390 million. Its high-voltage order backlog stood at €10.2 billion, alongside more than €3.5 billion in booking commitments.
Top Key Players Outlook
- Prysmian S.p.A.
- Nexans S.A.
- NKT A/S
- Sumitomo Electric Industries, Ltd.
- LS Cable & System Ltd.
- Southwire Company, LLC
- TE Connectivity Ltd.
- Hitachi Energy Ltd.
- TBEA Co., Ltd.
- Hengtong Group Co., Ltd.
- ZTT Group
- Taihan Cable & Solution Co., Ltd.
- Elsewedy Electric Co. S.A.E.
- Furukawa Electric Co., Ltd.
- Brugg Kabel AG
Recent Developments
- By March 2026, LS Cable reported 2025 revenue of KRW 7.5882 trillion, operating profit of KRW 279.8 billion, and an order backlog of KRW 7.63 trillion, showing strong demand for extra-high-voltage and submarine cable systems.
- By July 2026, TE reported quarterly sales of USD 5.16 billion and orders of USD 5.7 billion, showing continued financial strength to support grid modernization, cable-accessory innovation and further expansion in power infrastructure.
Report Scope
| Report Features | Description |
|---|---|
| Market Value (2025) | USD 43.2 Bn |
| Forecast Revenue (2035) | USD 79.5 Bn |
| CAGR (2026-2035) | 6.3% |
| Base Year for Estimation | 2025 |
| Historic Period | 2020-2024 |
| Forecast Period | 2026-2035 |
| Report Coverage | Revenue Forecast, Market Dynamics, Competitive Landscape, Recent Developments |
| Segments Covered | By Product Type (High-voltage cables, Cable accessories), By Voltage Rating (Up to 100 kV, 101–230 kV, 231–400 kV, Above 400 kV), By Conductor Type (Copper, Aluminum, By Installation, Overhead, Underground, Submarine), By End User (Power utilities, Renewable energy, Offshore wind, Onshore wind, Solar power, Industrial, Oil and gas, Petrochemicals and chemicals, Metals and mining, Commercial and infrastructure) |
| Regional Analysis | North America – US, Canada; Europe – Germany, France, The UK, Spain, Italy, Rest of Europe; Asia Pacific – China, Japan, South Korea, India, Australia, Singapore, Rest of APAC; Latin America – Brazil, Mexico, Rest of Latin America; Middle East & Africa – GCC, South Africa, Rest of MEA |
| Competitive Landscape | Prysmian S.p.A., Nexans S.A., NKT A/S, Sumitomo Electric Industries, Ltd., LS Cable & System Ltd., Southwire Company, LLC, TE Connectivity Ltd., Hitachi Energy Ltd., TBEA Co., Ltd., Hengtong Group Co., Ltd., ZTT Group, Taihan Cable & Solution Co., Ltd., Elsewedy Electric Co. S.A.E., Furukawa Electric Co., Ltd., Brugg Kabel AG |
| Customization Scope | Customization for segments, region/country-level will be provided. Moreover, additional customization can be done based on the requirements. |
| Purchase Options | We have three licenses to opt for: Single User License, Multi-User License (Up to 5 Users), Corporate Use License (Unlimited User and Printable PDF) |





































