


Report Overview
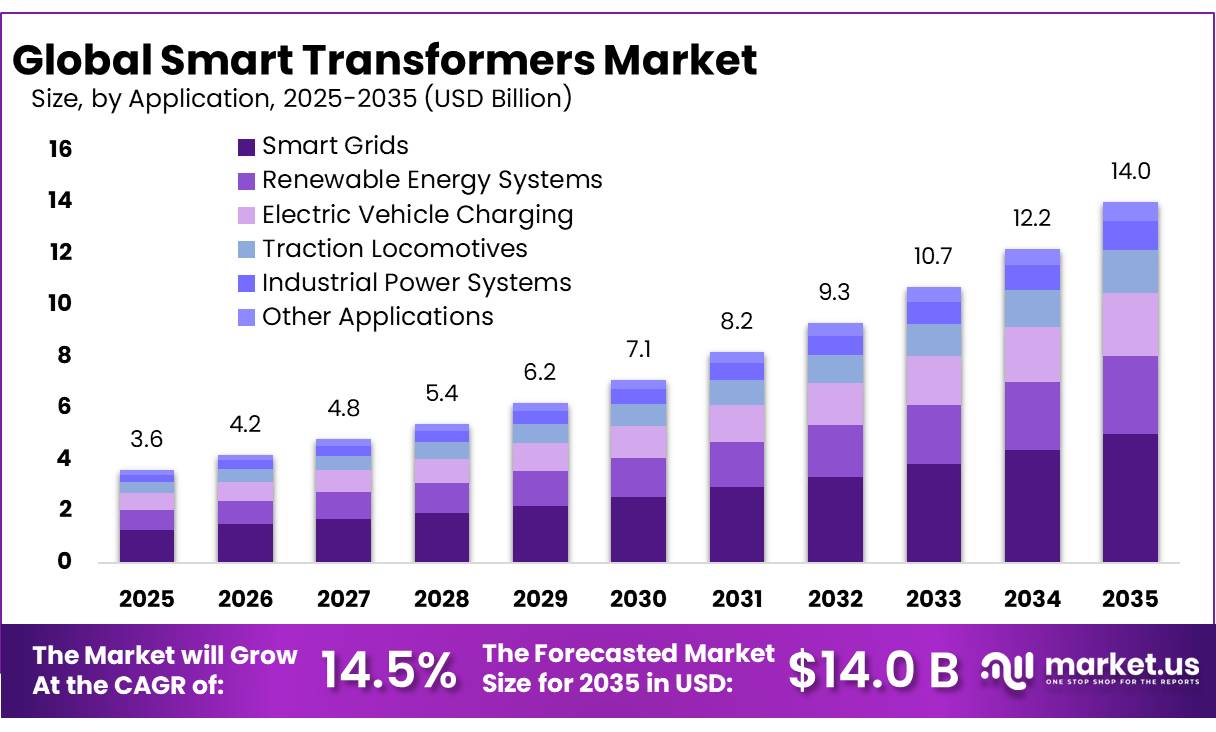
The Global Smart Transformers Market size is expected to be worth around USD 14.0 Billion by 2035, from USD 3.6 Billion in 2025, growing at a CAGR of 14.5% during the forecast period from 2026 to 2035. In 2025, Europe held a dominant market position, capturing more than a 42.50% share, holding USD 1.54 Billion revenue.
Smart transformers are becoming an important part of modern electricity networks as utilities move from conventional grid equipment toward digitally monitored and automatically controlled infrastructure. These transformers combine voltage transformation with sensors, communications, condition monitoring, automated voltage regulation and asset-management software.
- The International Energy Agency reported in 2026 that more than 2,500 GW of renewable generation, storage and large-load projects were waiting in grid connection queues worldwide.
Annual grid investment is currently around USD 400 billion, but the IEA estimates that spending needs to increase by about 50% by 2030 to meet expected electricity demand. This investment gap creates a strong need for digitally enabled transformers that can improve network utilization and provide real-time operating information.
- In September 2026, the U.S. Energy Information Administration forecast U.S. electricity generation at a record 4,368 billion kWh for 2026, representing 2.2% growth from 2025. Commercial electricity sales were projected to rise 3.3%, largely supported by data centres and other commercial loads.
Renewable integration also strengthens the industrial case. U.S. developers planned to add a record 86 GW of utility-scale generating capacity during 2026, with solar representing 51%, battery storage 28% and wind 14%. Such variable and distributed electricity sources create more complex voltage and power-flow conditions, supporting wider deployment of transformer monitoring, automated voltage management and bidirectional grid-control technologies.
- Government grid-modernization programs are creating additional opportunities. The U.S. Department of Energy administers a USD 10.5 billion Grid Resilience and Innovation Partnerships program, including USD 3 billion for Smart Grid Grants and USD 5 billion for the Grid Innovation Program. In March 2026, DOE also announced approximately USD 1.9 billion for advanced transmission upgrades under the SPARK initiative. These programs support technologies that improve grid flexibility, reliability and digital control.
The European Commission estimates that electricity networks require around €584 billion of investment during this decade, while approximately 40% of European distribution grids are already more than 40 years old. Aging assets combined with renewable integration are encouraging utilities to replace conventional transformers with equipment offering digital diagnostics, remote monitoring and improved voltage management.
Key Takeaways
- Smart Transformers Market size is expected to be worth around USD 14.0 Billion by 2035, from USD 3.6 Billion in 2025, growing at a CAGR of 14.5%.
- Distribution Transformers held a dominant market position, capturing more than a 50.60% share.
- Transformers held a dominant market position, capturing more than a 41.00% share.
- Smart Grids held a dominant market position, capturing more than a 35.00% share.
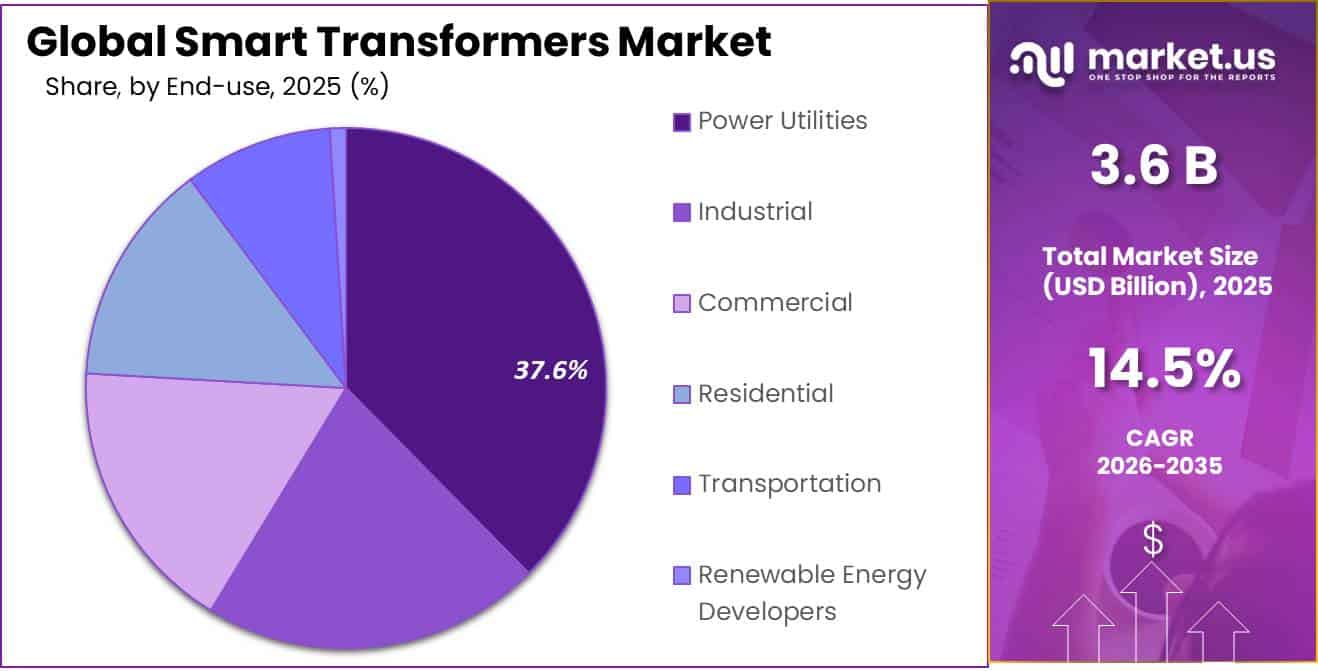
- Power Utilities held a dominant market position, capturing more than a 37.00% share.
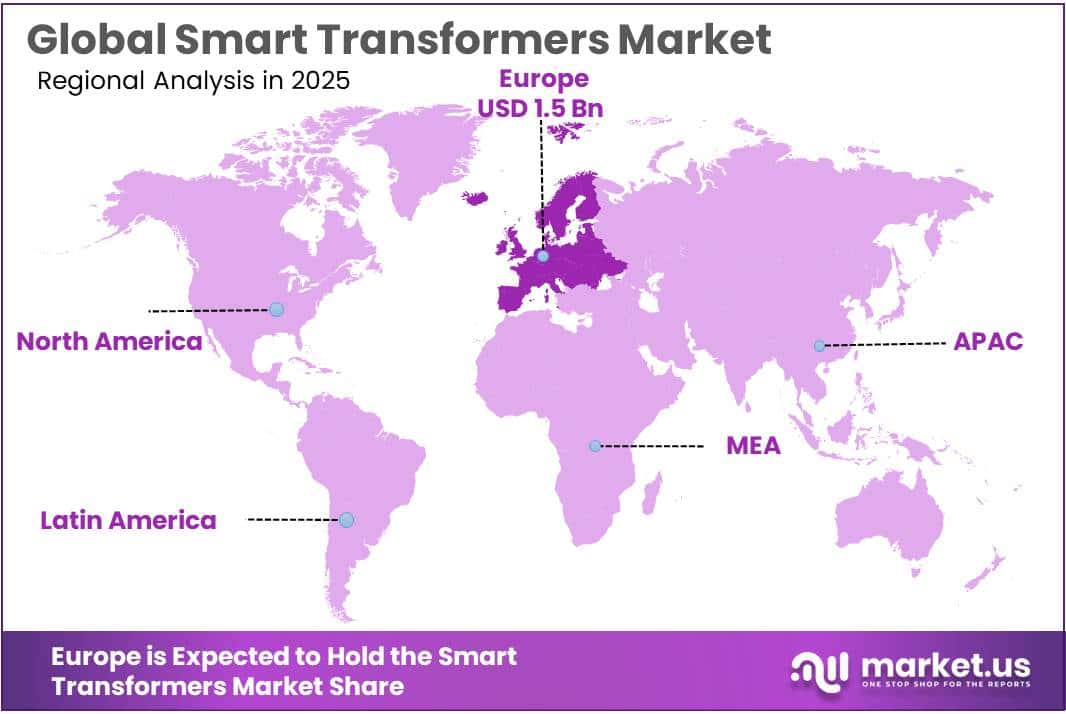
- Europe held a dominant market position, capturing more than a 42.50% share and generating approximately USD 1.54 billion.
By Type Analysis
Distribution Transformers dominate with more than a 50.60% share as utilities modernize aging local power networks.
In 2025, Distribution Transformers held a dominant market position, capturing more than a 50.60% share. Their leadership is supported by the large number of units required to deliver electricity to homes, commercial buildings, factories, data centers, renewable-energy systems, and EV charging infrastructure. Smart distribution transformers add sensors, remote monitoring, voltage control, and condition diagnostics, helping utilities manage changing loads and identify equipment problems earlier.
- The U.S. Department of Energy reported in 2026 that the national grid contains an estimated 60–80 million distribution transformers with more than 3 TW of installed capacity. DOE also noted that transformer procurement lead times had increased from 3–6 months in 2019 to 12–30 months in the latest available supply-chain data.
Power Transformers represent an important segment of the Smart Transformers Market, particularly across transmission substations, renewable-energy connections, large industrial loads, and utility grid upgrades. Smart power transformers use embedded sensors, communications, and real-time condition monitoring to track temperature, insulation health, loading, and other operating conditions.
Government activity during 2025–2026 shows continued investment in this infrastructure. In December 2025, the U.S. Department of Energy documented a grid-modernization project involving a new 115/13 kV substation with a 30–40 MVA power transformer. In 2026, DOE stated that failure of a single large power transformer can interrupt electricity service to around 500,000 homes, while replacement can require more than 12 months because these units are commonly custom-built.
By Component Analysis
Transformers dominate with more than a 41.00% share as utilities modernize distribution networks with intelligent monitoring.
In 2025, Transformers held a dominant market position, capturing more than a 41.00% share. Transformers remain the core hardware component of smart transformer systems because they perform voltage conversion while increasingly integrating sensors, digital communications, temperature monitoring, voltage regulation, and predictive diagnostics.
- Government data underline the size of the installed equipment base. During a March 2026 U.S. Department of Energy technical webinar, NREL estimated that the United States had around 60–80 million distribution transformers, covering equipment below 34.5 kV and generally below 5,000 kVA. In January 2026, DOE also documented development and testing of intelligent, flexible medium-voltage distribution transformers using advanced sensors and new core materials.
Converters represent an important component segment of the Smart Transformers Market as power networks move toward renewable generation, battery storage, electric mobility, and digitally controlled substations. Converters allow smart transformer systems to manage voltage and frequency, control power flow, and convert electricity between AC and DC.
By Application Analysis
Smart Grids dominate with more than a 35.00% share as utilities expand digitally controlled and resilient electricity networks.
In 2025, Smart Grids held a dominant market position, capturing more than a 35.00% share. Smart transformers are increasingly used in these networks because they provide real-time voltage monitoring, automated control, fault detection, and two-way communication between utilities and grid assets. This helps utilities manage changing electricity loads while improving distribution reliability.
- Government investment continues to support this segment. The U.S. Department of Energy operates a USD 10.5 billion Grid Resilience and Innovation Partnerships program, including USD 3 billion for Smart Grid Grants. In March 2026, DOE also announced approximately USD 1.9 billion under the SPARK program for advanced transmission and grid infrastructure upgrades.
Renewable Energy Systems represent an increasingly important application within the Smart Transformers Market. Solar farms, wind projects, battery storage systems, and distributed generation create variable electricity flows that require better voltage regulation and continuous monitoring.
By End User Analysis
Power Utilities dominate with more than a 37.00% share as grid operators modernize aging transformer networks.
In 2025, Power Utilities held a dominant market position, capturing more than a 37.00% share. Utilities remain the leading users of smart transformers because distribution and transmission networks require continuous voltage control, equipment monitoring, fault detection, and reliable power delivery.
- In a 2026 technical assessment, the U.S. Department of Energy reported an estimated 60–80 million distribution transformers operating across the United States, representing more than 3 TW of installed capacity. The equipment covered includes units operating at up to 34.5 kV and below 5,000 kVA. This extensive utility network provides a large base for adding digital monitoring, intelligent controls, and flexible transformer technologies.
Industrial represents an important end-user segment of the Smart Transformers Market as manufacturing plants, processing facilities, warehouses, and other energy-intensive operations require reliable and closely controlled electricity supply. Smart transformers can provide real-time load information, voltage regulation, condition monitoring, and predictive maintenance data, helping industrial operators protect equipment and manage electricity use more effectively.
Key Market Segments
By Type
- Power Transformers
- Distribution Transformers
- Specialty Transformers
- Instrument Transformers
By Component
- Transformers
- Converters
- Switches
- Transformer-Monitoring Hardware
- Sensors
- Communication Interfaces
- Digital Control Systems
By Application
- Smart Grids
- Renewable Energy Systems
- Electric Vehicle Charging
- Traction Locomotives
- Industrial Power Systems
- Other Applications
By End User
- Power Utilities
- Industrial
- Commercial
- Residential
- Transportation
- Renewable Energy Developers
Driver Analysis
Grid Modernization and Digitalization
The investment denominator is expanding rapidly: the IEA estimates present global grid spending at about $400 billion annually and calculates that it must increase roughly 50% by 2030, while more than 2,500 GW of generation, storage and large-load projects remain stalled in connection queues; it also estimates that grid-enhancing technologies could unlock connections for 450–700 GW of advanced queued projects.
Europe alone expects electricity consumption to increase about 60% by 2030, has 40% of distribution grids already over 40 years old and requires €584 billion of network investment, explicitly prioritizing digitalization, flexibility and stronger supply chains. In the United States, DOE’s $10.5 billion GRIP program includes $3 billion for Smart Grid Grants, while its first major award announcement allocated up to $3.46 billion to 58 projects across 44 states; these programs lower utility demonstration risk and establish specifications that can migrate into recurring rate-base procurement.
India adds high-volume asset visibility: RDSS approvals cover metering for 52.53 lakh distribution transformers and 2.05 lakh feeders, with 12.56 lakh transformer meters and 1.58 lakh feeder meters installed by December 2025, creating the communications and data layer needed to justify subsequent intelligent-transformer replacement.
This shifts supplier economics from one-time transformer sales toward bundled sensors, gateways, fleet-health software, cybersecurity updates and multiyear service contracts; based on the scale of funded modernization and the attach-rate expansion available across aging fleets, the driver is assessed to add approximately +2.3 percentage points to 2026–2031 CAGR, with immediate gains accruing to vendors that can retrofit legacy units as well as supply digitally native replacements.
Drivers Impact Analysis
| Driver | (~) % Impact on CAGR Forecast | Geographic Relevance | Impact Timeline |
|---|---|---|---|
| Grid modernization and digitalization | +2.3 pp | North America; EU; China; India | Short term (≤2 years) |
| Renewable and DER integration | +1.8 pp | China; EU; North America; India; Australia | Medium term (2–4 years) |
| AI data-center load growth | +1.5 pp | United States core; EU; China; APAC hubs | Short term (≤2 years) |
| EV charging grid reinforcement | +1.2 pp | China; EU; North America; Korea; Japan | Medium term (2–4 years) |
| Predictive maintenance and resilience | +1.0 pp | North America; EU; Japan; utility hubs | Short term (≤2 years) |
| Efficiency rules and public funding | +0.8 pp | United States; EU; India | Medium term (2–4 years) |
Restraint Analysis
Transformer Capacity Shortage
Transformer manufacturing capacity is the largest near-term restraint because smart controls cannot create a sale without a qualified magnetic core, windings, tank, bushings, tap changer and factory test slot, while the underlying transformer supply chain is already oversubscribed by replacement, renewable, data-center and grid-expansion orders.
NREL reports U.S. distribution-transformer lead times of up to two years—four times pre-2022 levels—and utility-reported prices four to nine times higher over three years; it estimates that aggregate distribution-transformer capacity must increase 160–260% by 2050 relative to 2021.
At transmission scale, the IEA finds procurement at up to four years, nearly twice 2021 timing, average transformer prices about 75% above 2019 in real terms and project-specific quotations as high as 2.6 times pre-pandemic levels; the 2026 U.S. gap analysis extends extra-high-voltage lead times to 60 months and places 2025 large-power-transformer prices roughly 50–70% above 2019.
For smart-transformer vendors, constrained base-unit slots force utilities to prioritize essential kVA over premium intelligence, inflate working capital through long-dated deposits, increase liquidated-damages exposure and delay revenue recognition even when sensor and software modules are available; the resulting -2.0 percentage-point CAGR deduction reflects units deferred beyond forecast periods and smart features value-engineered out of emergency procurements.
Restraint Impact Analysis
| Restraint | (~) % Impact on CAGR Forecast | Geographic Relevance | Impact Timeline |
|---|---|---|---|
| Transformer Capacity Shortage | -2.0 pp | North America; EU; global imports | Short term (≤2 years) |
| High Smart-System CapEx | -1.6 pp | Emerging APAC; Africa; Latin America | Medium term (2–4 years) |
| SST Reliability-Cost Gap | -1.3 pp | Global; utility pilots | Long term (≥4 years) |
| Utility Qualification Delays | -1.0 pp | North America; EU; Japan | Medium term (2–4 years) |
| Cybersecurity Compliance Burden | -0.8 pp | EU; North America | Medium term (2–4 years) |
| Fragmented Asset Specifications | -0.6 pp | North America; EU; India | Medium term (2–4 years) |
Opportunity Analysis
Legacy Fleet Retrofit-as-a-Service
Legacy-fleet Retrofit-as-a-Service is the largest untapped opportunity because the 2026 baseline is still dominated by sales of new digitally enabled units, while millions of serviceable conventional transformers remain effectively outside the addressable smart-transformer market; NREL estimates 60–80 million U.S. distribution transformers in service and about 55% older than 33 years, implying a modeled pool of roughly 33–44 million aging units, while DOE reports that large power transformers average about 40 years against an intended life of about 40 years and that more than 70% were already older than 25 years in its cited estimate.
The strategic pivot is to package clip-on current/voltage/temperature sensing, hydrogen/moisture detection, tap-position encoders, edge gateways and fleet-health analytics under a five-to-ten-year availability contract rather than wait for full replacement; retrofit solutions can fit existing panels and wiring, add early fault indicators and preserve operational continuity, and complete LTC retrofit programs have demonstrated six-to-seven-day turnaround including reconditioning, bushing work and dissolved-gas monitoring.
If suppliers convert only 1% of the U.S. distribution fleet’s older cohort by 2031—approximately 330,000–440,000 assets—and realize an analyst-modeled blended $1,500–$3,000 initial hardware/installation value plus $150–$300 annual software and monitoring revenue, the cumulative accessible revenue pool would reach roughly $0.6–$1.6 billion before expansion into Europe and Japan.
Successful penetration supports approximately +1.8 percentage points of CAGR upside, provided vendors prove alarm accuracy, cybersecure long-term support and cross-brand compatibility instead of locking the offer to their own installed base.
Opportunity Impact Analysis
| Opportunity | (~) % Potential CAGR Upside | Geographic Relevance | Execution Window |
|---|---|---|---|
| Legacy Fleet Retrofit-as-a-Service | +1.8 pp | North America; EU; Japan | Short term (≤2 years) |
| Transformer Capacity-as-a-Service | +1.5 pp | North America; EU; India; EMDEs | Medium term (2–4 years) |
| AI Data-Center MVDC Platforms | +1.3 pp | United States; EU; Singapore; Japan | Medium term (2–4 years) |
| Grid-Edge Flexibility Monetization | +1.0 pp | North America; EU; Australia | Medium term (2–4 years) |
| Modular Resilience Fleets | +0.9 pp | North America; EU; island grids | Long term (≥4 years) |
| Emerging-Market Outcome PPPs | +0.8 pp | India; Southeast Asia; Africa | Medium term (2–4 years) |
Challenges Analysis
Skilled Workforce Attrition
More than 60% of energy-sector employers report labor shortages, while applied technical roles comprise over half of the sector workforce; in grid occupations, every young entrant is offset by 1.4 workers approaching retirement, and two out of every three hires required through 2035 will replace retirees rather than add net capacity.
For large transformers, manufacturing and test expertise remains highly manual: DOE supply-chain analysis notes that 89% of U.S. component manufacturers struggled to find qualified workers, and specialized winders and engineers with more than a decade of experience are particularly scarce.
The estimated -1.2 percentage-point CAGR friction persists beyond four years because automation cannot fully replace winding, insulation, high-voltage testing, field installation, and grid-operating expertise; suppliers need apprenticeship pipelines, digital work instructions, centralized remote-support centers, cross-training between transformer and OT-security teams, and modular product architectures that reduce bespoke engineering hours per unit.
Challenges Impact Analysis
| Challenge | (~) % CAGR Friction Drag | Geographic Relevance | Mitigation Horizon |
|---|---|---|---|
| Skilled Workforce Attrition | -1.2 pp | North America; EU; Japan | Long term (≥ 4 years) |
| Materials Price Volatility | -1.0 pp | Global; APAC supply hubs | Medium term (2–4 years) |
| Multi-Vendor Interoperability | -0.9 pp | North America; EU; Japan | Medium term (2–4 years) |
| Grid Project Synchronization | -0.8 pp | EU; North America; India | Long term (≥ 4 years) |
| Cyber Lifecycle Maintenance | -0.7 pp | North America; EU; APAC | Medium term (2–4 years) |
| Climate Resilience Validation | -0.6 pp | North America; EU; APAC corridors | Long term (≥ 4 years) |
Geopolitical Impact Analysis
Russia–Ukraine War Accelerates Smart Transformer Replacement and Grid Resilience Demand
The ongoing Russia–Ukraine war is influencing the Smart Transformers Market by increasing demand for replacement transformers, resilient substations, remote monitoring and decentralized grid equipment. Attacks on Ukraine’s electricity system have damaged generation, transmission and distribution assets, forcing utilities to rebuild networks.
- The World Bank’s February 2026 assessment reported that damaged or destroyed energy assets increased by about 21% compared with the previous assessment, while energy-sector recovery and reconstruction needs reached nearly USD 91 billion. This creates demand for transformers that provide digital diagnostics, automated voltage control and faster fault detection.
European support is also creating procurement opportunities for equipment suppliers. The European Commission reported that Ukraine had received more than 7,200 transformers and 6 high-capacity autotransformers through international assistance. In June 2026, the Commission and Ukraine sought another €650 million for the Ukraine Energy Support Fund ahead of winter.
For smart-transformer manufacturers, the war therefore creates a mixed environment: component shortages, transport risks and project uncertainty raise costs, while grid restoration increases orders for modern transformers, protection systems and digital controls. Longer term, reconstruction is likely to favor equipment that improves grid flexibility, remote operation and resilience against future disruptions.
Regional Insights
Europe Leads the Smart Transformers Market with 42.50% Share and USD 1.54 Billion, While Asia Pacific Shows Strong Expansion
In 2025, Europe held a dominant market position, capturing more than a 42.50% share and generating approximately USD 1.54 billion. The region benefits from major investment requirements for grid replacement and digitalization.
- In June 2025, the European Commission estimated that approximately €730 billion would be required for distribution-grid development and another €477 billion for transmission networks by 2040. Around 40% of European distribution grids are already more than 40 years old, creating substantial opportunities for smart transformers with condition monitoring, digital communications and automated control capabilities.
Asia Pacific – Fastest-Growing Region: Asia Pacific is emerging as the fastest-growing regional market, supported by rapid grid investment and electricity-demand expansion across major economies. The IEA estimated that China would invest around USD 88 billion in transmission and distribution infrastructure during 2025.
For 2026–2030, State Grid Corporation of China plans up to CNY 4 trillion in fixed-asset investment, representing a 40% increase from the previous five-year period. Southeast Asia also requires more than USD 300 billion in grid investment between 2025 and 2040, supporting opportunities for digitally monitored transformers, smart substations and flexible distribution equipment.
Key Regions and Countries Insights
- North America
- US
- Canada
- Europe
- Germany
- France
- The UK
- Spain
- Italy
- Rest of Europe
- Asia Pacific
- China
- Japan
- South Korea
- India
- Australia
- Rest of APAC
- Latin America
- Brazil
- Mexico
- Rest of Latin America
- Middle East & Africa
- GCC
- South Africa
- Rest of MEA
Key Players Analysis
ABB Ltd. strengthens its smart-transformer position through electrification, digital power management and solid-state transformer technology. In 2025, ABB generated USD 33.22 billion in group revenue, while its Electrification business produced about USD 17.36 billion. In October 2025, ABB also advanced an 800 VDC architecture for AI data centers, where its Infinitus solid-state transformer converts medium-voltage AC directly to 800 VDC, supporting more efficient, digitally controlled power infrastructure.
Siemens AG maintains a strong position in smart power infrastructure through grid automation, digital substations and intelligent transformer-related solutions. In fiscal 2025, its Smart Infrastructure business generated approximately €22.99 billion in revenue and €4.51 billion in profit. In August 2026, Siemens partnered with Reinhausen to develop a modular solid-state transformer for AI data centers, designed to connect grid voltages of up to 36 kV and provide 800 VDC output, strengthening its role in next-generation power conversion.
Schneider Electric SE supports the Smart Transformers Market through digital monitoring, energy management and its EcoStruxure Transformer Expert platform. In 2025, the company crossed €40 billion in annual revenue, with Energy Management delivering 10% organic growth. Its Transformer Expert solution combines IoT sensors and analytics for condition-based monitoring of oil transformers.
Top Key Players Outlook
- ABB Ltd.
- Siemens AG
- Schneider Electric SE
- GE Vernova Inc.
- Hitachi Energy Ltd.
- Eaton Corporation plc
- Mitsubishi Electric Corporation
- Toshiba Energy Systems & Solutions Corporation
- HD Hyundai Electric Co., Ltd.
- Hyosung Heavy Industries Corporation
- CG Power and Industrial Solutions Limited
- WEG S.A.
- Fuji Electric Co., Ltd.
- SGB-SMIT Group
- Bharat Heavy Electricals Limited
Recent Developments
- GE Vernova also plans approximately USD 11 billion in capital expenditure and R&D between 2025 and 2028. In operational terms, the company reported that 68 GW of new power transformers were energized during 2025, showing the growing scale of its transformer activities worldwide.
- In June 2026 Hitachi Energy agreed to supply Fingrid with 7 transformers rated at 400 MVA and 400 kV each, with an option for 2 additional units, reinforcing its position in digitally monitored and high-reliability grid infrastructure.
Report Scope
| Report Features | Description |
|---|---|
| Market Value (2025) | USD 3.6 Bn |
| Forecast Revenue (2035) | USD 14.0 Bn |
| CAGR (2026-2035) | 14.5% |
| Base Year for Estimation | 2025 |
| Historic Period | 2020-2024 |
| Forecast Period | 2026-2035 |
| Report Coverage | Revenue Forecast, Market Dynamics, Competitive Landscape, Recent Developments |
| Segments Covered | By Type (Power Transformers, Distribution Transformers, Specialty Transformers, Instrument Transformers), By Component (Transformers, Converters, Switches, Transformer-Monitoring Hardware, Sensors, Communication Interfaces, Digital Control Systems), By Application (Smart Grids, Renewable Energy Systems, Electric Vehicle Charging, Traction Locomotives, Industrial Power Systems, Other Applications), By End User (Power Utilities, Industrial, Commercial, Residential, Transportation, Renewable Energy Developers) |
| Regional Analysis | North America – US, Canada; Europe – Germany, France, The UK, Spain, Italy, Rest of Europe; Asia Pacific – China, Japan, South Korea, India, Australia, Singapore, Rest of APAC; Latin America – Brazil, Mexico, Rest of Latin America; Middle East & Africa – GCC, South Africa, Rest of MEA |
| Competitive Landscape | ABB Ltd., Siemens AG, Schneider Electric SE, GE Vernova Inc., Hitachi Energy Ltd., Eaton Corporation plc, Mitsubishi Electric Corporation, Toshiba Energy Systems & Solutions Corporation, HD Hyundai Electric Co., Ltd., Hyosung Heavy Industries Corporation, CG Power and Industrial Solutions Limited, WEG S.A., Fuji Electric Co., Ltd., SGB-SMIT Group, Bharat Heavy Electricals Limited |
| Customization Scope | Customization for segments, region/country-level will be provided. Moreover, additional customization can be done based on the requirements. |
| Purchase Options | We have three licenses to opt for: Single User License, Multi-User License (Up to 5 Users), Corporate Use License (Unlimited User and Printable PDF) |





































