


Report Overview
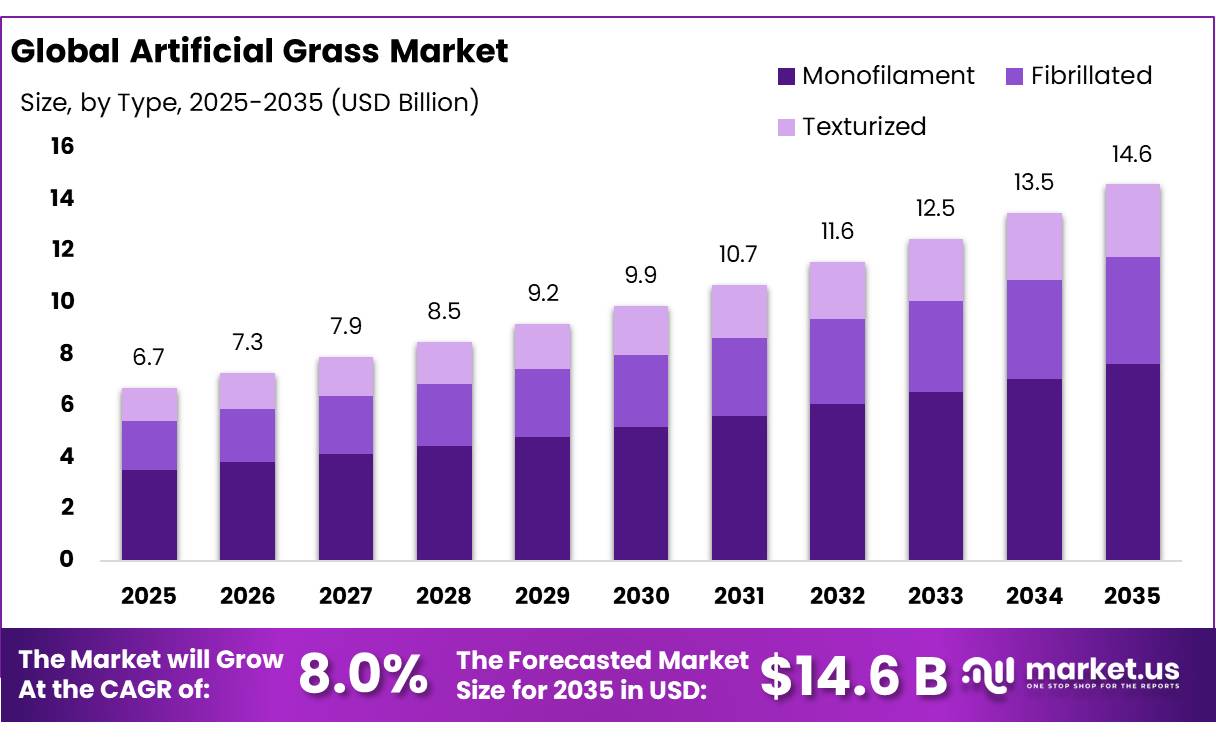
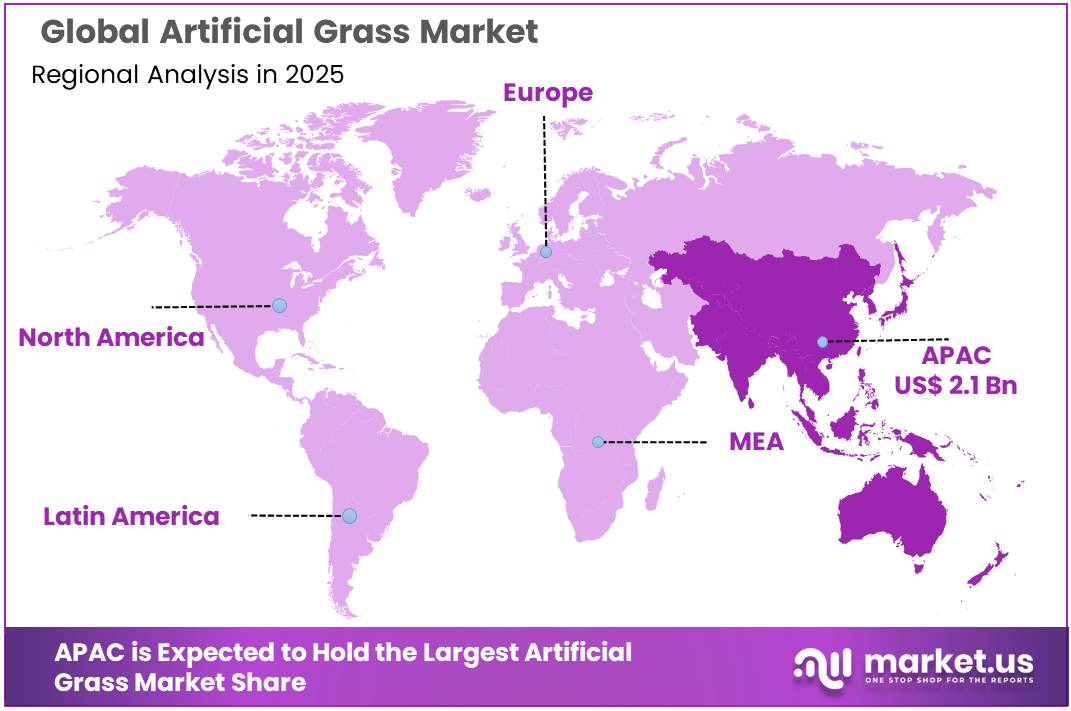
The Global Artificial Grass Market size is expected to be worth around USD 14.6 Billion by 2035, from USD 6.7 Billion in 2025, growing at a CAGR of 8.0% during the forecast period from 2026 to 2035. In 2025, Asia Pacific held a dominant market position, capturing more than a 32.2% share, holding USD 2.1 Billion revenue.
Artificial grass is a manufactured surface made mainly from synthetic polymer fibres that are designed to reproduce the appearance and playing characteristics of natural turf. Modern systems commonly use polyethylene, polypropylene, backing materials, shock pads, sand, and performance infill. Demand is strongest across football fields, multi-sport facilities, schools, commercial landscaping, and recreational spaces where intensive use makes natural grass difficult to maintain.
- The industrial scenario is increasingly linked to higher sports-field utilization and standardized surface performance. FIFA indicates that a typical amateur football club can require around 58 hours of pitch use per week across training and matches. FIFA QUALITY-certified artificial surfaces are designed for approximately 40–60 hours of play per week, compared with FIFA QUALITY PRO systems developed for higher-level competition requirements.
Quality regulation is also shaping product development. In July 2025, FIFA identified 8 companies as Preferred Providers for Football Turf under its global quality program. In 2026, FIFA released updated Test Manuals covering artificial-turf performance, durability, safety, and installation requirements. The updated framework includes impact testing with a minimum critical fall height of 0.60 metres, reflecting stronger attention to athlete safety and surface engineering.
- Environmental regulation is becoming another major industry driver. The European Union’s microplastics restriction will prohibit the placing on the market of granular polymer infill for synthetic sports surfaces from 17 October 2031. ECHA explains that the transition period was provided so existing pitches can approach the end of their operating life while manufacturers and field owners move toward alternative infill materials.
Future growth opportunities are therefore shifting toward recyclable turf systems, non-polymeric infill, lower-carbon backing, improved drainage, and products designed for easier material recovery. ASTM International strengthened this direction in 2025 by developing a proposed playground-turf standard covering specification, purchasing, installation, durability, drainage, flammability, and chemical content.
By 2026, ASTM standards also included dedicated testing for synthetic-turf fibre and fabric PFAS and granular infill characteristics. These developments are expected to create opportunities for manufacturers that can combine long service life, safer chemistry, recyclability, and high sporting performance while meeting tighter environmental and technical standards.
Key Takeaways
- Artificial Grass Market size is expected to be worth around USD 14.6 Billion by 2035, from USD 6.7 Billion in 2025, growing at a CAGR of 8.0%.
- Monofilament held a dominant market position, capturing more than a 52.30% share.
- Polyethylene held a dominant market position, capturing more than a 63.10% share.
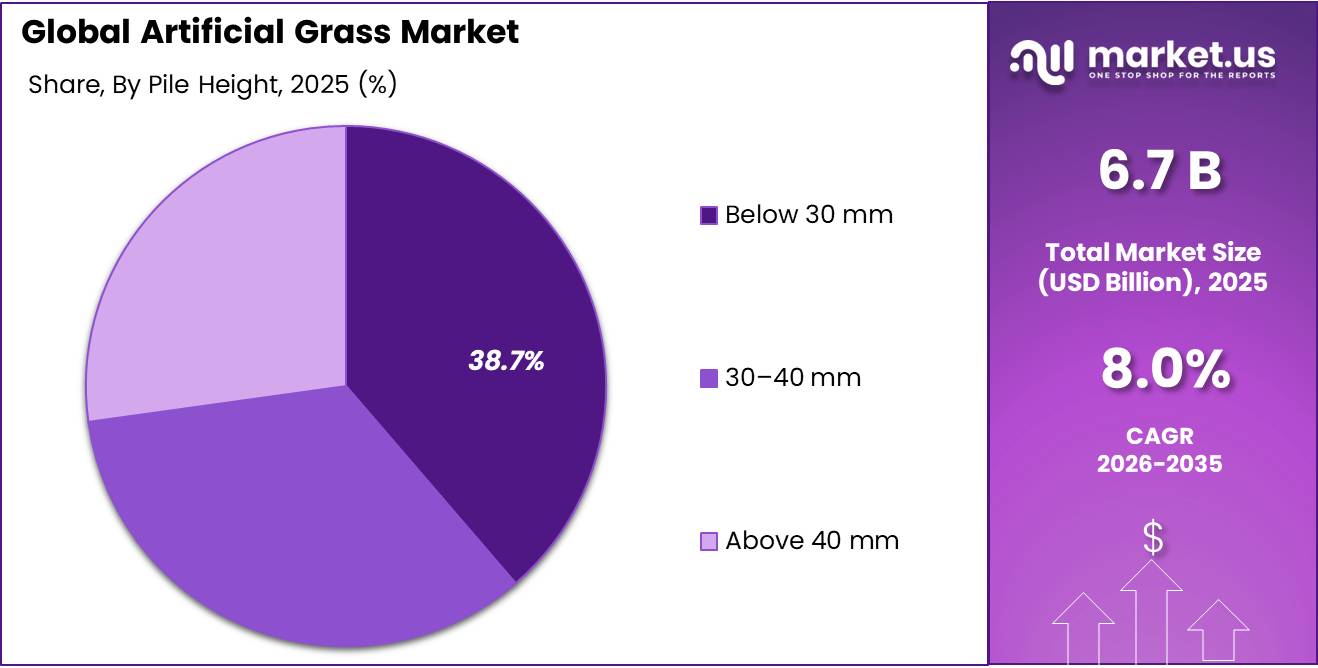
- Below 30 mm held a dominant market position, capturing more than a 38.00% share.
- Sports courts and fields held a dominant market position, capturing more than a 55.00% share.
- Offline held a dominant market position, capturing more than a 83.00% share.
- Asia Pacific held a dominant Artificial Grass Market position, capturing more than a 32.20% share and USD 2.1574 billion.
By Type Analysis
Monofilament dominates the Artificial Grass Market with a 52.30% share, supported by strong fibre retention, durability, and suitability for high-use sports surfaces.
In 2025, Monofilament held a dominant market position, capturing more than a 52.30% share. Its strong position was supported by growing use in football fields, multi-sport areas, schools, and recreational facilities where durability and consistent surface performance are important. ASTM updated its F3383-19a(2025) standard specifically for testing the filament bind of single fibres in synthetic turf.
The standard applies to turf containing at least one bundle of monofilament fibres and evaluates how well individual fibres resist being pulled from the backing during installation and use. This is important because excessive fibre loss can affect both appearance and playing performance. The 2025 ASTM update gives manufacturers and buyers a clearer technical framework for checking fibre retention, supporting wider use of monofilament systems in high-traffic artificial grass applications.
Fibrillated remained an important type in the Artificial Grass Market in 2025, especially in sports and landscaping applications where manufacturers require broad fibre coverage and stable infill distribution. Unlike single-strand monofilament yarns, fibrillated fibres are manufactured from slit film that opens into a network structure during use, helping hold infill within the turf system. Wider synthetic-turf quality requirements are becoming more detailed.
ASTM’s current sports-surface framework includes F1551-23 for comprehensive characterization of synthetic turf playing surfaces and materials, while the 2026 standards portfolio introduced F3782-26 for PFAS testing of turf fibre and fabric and F3846-26 for sieve analysis of granular infill. These standards strengthen quality control across fibre, fabric, and infill materials and support manufacturers developing more durable and environmentally compliant fibrillated turf systems.
By Fibre Material Analysis
Polyethylene dominates the Artificial Grass Market with a 63.10% share, supported by its softness, flexibility, and wide use in sports and landscaping surfaces.
In 2025, Polyethylene held a dominant market position, capturing more than a 63.10% share. Its strong position was supported by its balance of softness, flexibility, weather resistance, and durability, making it suitable for football fields, recreational areas, landscaping, and other high-use surfaces. ASTM’s synthetic-turf testing framework specifically covers polyethylene fibres used in artificial turf and includes tests for tensile strength, weathering resistance, yarn thickness, and melting temperature.
ASTM F1551-23 also notes that the melting point of polyethylene, polypropylene, and polyamide fibres can be measured as part of turf quality control. This technical focus supports the continued use of polyethylene where manufacturers need consistent fibre performance, outdoor durability, and compliance with recognized sports-surface standards.
Polypropylene remained an important fibre material in the Artificial Grass Market in 2025, particularly in applications where manufacturers require lightweight construction, good moisture resistance, and stable performance at controlled costs. ASTM’s synthetic-turf framework includes polypropylene among the principal polymer fibres used in artificial turf and applies dedicated testing for yarn strength, weathering, thickness, and melting temperature.
The standard specifies laboratory conditioning at 23 ± 2°C and 65 ± 5% relative humidity before several material tests, helping manufacturers compare fibre properties under controlled conditions. Environmental regulation is also becoming more important. The European Commission identifies polyethylene and polypropylene among common synthetic polymers associated with microplastic concerns, encouraging turf producers to improve fibre durability, material containment, recyclability, and end-of-life design.
By Pile Height Analysis
Below 30 mm dominates the Artificial Grass Market with a 38.00% share, supported by its suitability for compact, lower-infill and multi-purpose surface applications.
In 2025, Below 30 mm held a dominant market position, capturing more than a 38.00% share. This segment remained widely used in landscaping, playgrounds, multi-purpose recreation areas and selected sports applications where a shorter pile helps provide a firmer surface and lower material requirement. Technical guidance from The Football Association shows that sand-filled synthetic turf used for small-sided football can have a pile height of at least 23 mm, with a minimum pile weight of 1,000 g/m² and tuft density of at least 18,000 per m².
These specifications show that shorter-pile systems can still meet structured performance requirements when fibre density, backing strength and surface construction are properly controlled. Demand is therefore supported by applications that value easier maintenance, stable footing and efficient use of turf materials.
30–40 mm remained an important pile-height segment in the Artificial Grass Market in 2025, particularly for sports and recreational surfaces that require moderate cushioning without using very deep fibre systems. The Football Association notes that a typical football turf pile can range from 40 to 60 mm, while reducing pile length from 60 mm to 40 mm and adding a shock pad can lower rubber infill requirements by around 60–70%.
This is becoming increasingly relevant as field owners seek to control material use and improve long-term environmental performance. FIFA’s 2026 football-turf framework also evaluates durability, safety and playing performance, with FIFA Quality surfaces designed to support around 40–60 hours of play per week. These requirements favour carefully engineered mid-height systems that balance fibre length, shock absorption and infill stability.
By Application Analysis
Sports courts and fields dominate the Artificial Grass Market with a 55.00% share, supported by heavy weekly use and the need for durable, all-weather playing surfaces.
In 2025, Sports courts and fields held a dominant market position, capturing more than a 55.00% share. The segment remained strong because artificial grass allows football grounds, training centers, schools, and community sports facilities to handle frequent use with more consistent surface conditions than natural turf. FIFA states that FIFA Quality-certified artificial football pitches are designed for around 40–60 hours of play per week, while FIFA Quality Pro surfaces are developed for professional football with typical use of up to 20 hours per week.
These operating levels support demand for durable synthetic turf systems where natural grass can struggle under intensive schedules. Sports authorities also continue to apply structured testing for safety, ball behavior, shock absorption, and durability, which supports investment in higher-quality artificial grass across professional and recreational facilities.
Residential remained an important application in the Artificial Grass Market in 2025 as homeowners looked for low-maintenance alternatives to irrigated lawns, particularly in dry and water-stressed regions. The U.S. Environmental Protection Agency reports that households use nearly 9 billion gallons of water per day outdoors, equal to about 30% of total household water use, while outdoor demand can rise to 70% in hot or dry climates. California also reports that around 50% of urban residential water use occurs outdoors.
These figures are encouraging interest in lower-water landscape designs, including reduced natural turf areas and selected artificial grass installations. At the same time, environmental scrutiny is increasing; California’s Department of Toxic Substances Control published a technical document on PFAS in artificial turf in February 2026, creating stronger pressure for safer materials and improved product transparency.
By Distribution Channel Analysis
Offline dominates the Artificial Grass Market with an 83.00% share, supported by project-based buying, physical product inspection, and installer-led sales.
In 2025, Offline held a dominant market position, capturing more than a 83.00% share. The segment remained strong because artificial grass is commonly purchased through specialist dealers, landscaping contractors, sports-surface installers, building-material suppliers, and direct project contracts. Buyers often need to check fibre texture, pile height, backing quality, drainage performance, colour, and installation requirements before placing larger orders.
This makes physical consultation especially important for sports fields, commercial landscaping, and residential projects. Broader retail data also show that physical channels remain significant. The U.S. Census Bureau reported that e-commerce represented 16.6% of total U.S. retail sales in the fourth quarter of 2025. Artificial grass suppliers therefore continue to rely heavily on dealer networks, showrooms, installers, and direct sales teams for specification, measurement, delivery, and installation support.
Online remained a growing distribution channel in the Artificial Grass Market in 2025 as homeowners, landscapers, and smaller commercial buyers increasingly used digital platforms to compare pile height, fibre material, roll dimensions, drainage features, accessories, and prices before ordering. Online channels are particularly useful for samples, smaller lawn projects, balconies, pet areas, and replacement materials where complex on-site specification is less important.
Government retail data show continued digital-channel growth. In the second quarter of 2026, U.S. retail e-commerce sales reached USD 340.2 billion and increased 12.2% from the same quarter of 2025. E-commerce represented 17.1% of total retail sales during the quarter. This continued growth supports wider digital distribution opportunities for artificial grass manufacturers, specialist retailers, and landscaping suppliers.
Key Market Segments
By Type
- Fibrillated
- Monofilament
- Texturized
By Fibre Material
- Polyethylene
- Polypropylene
- Nylon
- Others
By Pile Height
- Below 30 mm
- 30–40 mm
- Above 40 mm
By Application
- Sports courts and fields
- Residential
- Commercial
- Landscaping
- Others
By Distribution Channel
- Offline
- Online
Driver Analysis
Water-Scarcity Turf Conversion
The 2026–2029 regulatory calendar is making the conversion decision immediate: California’s AB 1572 begins prohibiting potable-water irrigation of covered nonfunctional turf on public properties in 2027, commercial and institutional sites in 2028, and HOA common areas in 2029, while Southern Nevada prohibits Colorado River water from irrigating nonfunctional grass on covered properties from January 1, 2027.
Artificial grass will capture only part of this conversion pool because xeriscaping, native planting, permeable hardscape, and rebates that explicitly exclude synthetic turf compete for the same area; for example, Metropolitan Water District’s public-agency program excludes synthetic turf even while offering up to USD 3 per square foot for qualifying landscape conversion.
The commercial mechanism is therefore strongest in functional micro-spaces—pet zones, playground surrounds, hospitality courtyards, roof decks, school activity areas, narrow medians, and high-traffic amenity lawns—where an analyst-modelled 1,000 m² conversion can avoid approximately 500–1,000 mm of annual irrigation demand, equivalent to 0.5–1.0 million litres before efficiency losses, while replacing mowing, fertilizer, and irrigation-system servicing with brushing, cleaning, infill management, and periodic repair.
This changes vendor economics from commodity carpet sales to site-specific design-and-install contracts incorporating drainage, shock pads, antimicrobial or pet systems, cooling infill, maintenance plans, and eight-to-fifteen-year replacement reserves; with Southern Europe reporting permanent water stress for about 30% of its population and seasonal summer stress for as much as 70%, the driver supports an estimated +2.2-percentage-point medium-term contribution to market CAGR across Western North America, MENA, Southern Europe, and Australia.
Drivers Impact Analysis
| Driver | (~) % Impact on CAGR | Geographic Relevance | Impact Timeline |
|---|---|---|---|
| Water-scarcity turf conversion | +2.2 pp | Western North America, MENA, Southern EU, Australia | Medium term (2–4 years) |
| Grassroots sports funding | +1.9 pp | UK–EU core, APAC, Africa, LATAM | Short term (≤ 2 years) |
| All-weather field utilization | +1.6 pp | Global urban and school corridors | Medium term (2–4 years) |
| Low-maintenance site economics | +1.3 pp | North America, GCC, Australia, urban APAC | Short term (≤ 2 years) |
| Certified replacement cycle | +1.1 pp | Europe, North America, Japan, developed APAC | Medium term (2–4 years) |
| Low-infill product transition | +0.9 pp | EU core, UK spill-over, global sports OEMs | Long term (≥ 4 years) |
Restraint Analysis
PFAS and Chemical Restrictions
The constraint is broader than product substitution: a manufacturer may need to requalify multiple polyethylene or polypropylene yarn recipes, backing systems, pigment packages, fluorine-free processing aids, adhesives, and supplier declarations, typically requiring 6–18 months of formulation trials, weathering tests, abrasion testing, third-party laboratory screening, warranty review, and distributor inventory transition. For a full-size sports-field project with USD 0.8–2.5 million of installed value, a procurement delay of one construction season can defer recognition by 9–15 months; for OEMs, a 3–8% cost increase in compliant inputs, documentation, testing, segregated inventory, and warranty reserves can compress gross margin by 150–400 basis points if pass-through is incomplete.
Legislative risk is spreading through public procurement even where outright bans have not yet taken effect: Maine’s 2025 legislation established a three-year moratorium framework and study process focused on public-health, environmental, and climate risks, while other state and municipal proposals target PFAS, lead, and municipal installations.
The resulting commercial effect is a shift from standard catalogue products toward traceable chemistry, material declarations, fluorine-free formulations, supplier audits, and pre-approved regional bill-of-materials, with smaller installers disproportionately disadvantaged by testing and legal-compliance costs; consequently, PFAS and chemical restrictions are estimated to reduce baseline artificial-grass CAGR by approximately -2.1 percentage points in North America, Europe, and developed APAC during the short term.
Restraint Impact Analysis
| Restraint | (~) % Impact on CAGR Forecast | Geographic Relevance | Impact Timeline |
|---|---|---|---|
| PFAS and chemical restrictions | -2.1 pp | North America, EU, developed APAC | Short term (≤ 2 years) |
| Polymeric infill phase-out | -1.8 pp | EU core, UK spill-over, global sports tenders | Medium term (2–4 years) |
| Heat-island performance concerns | -1.5 pp | U.S. Sun Belt, MENA, Australia, Southern EU | Long term (≥ 4 years) |
| End-of-life disposal costs | -1.3 pp | EU, North America, Japan, Australia | Medium term (2–4 years) |
| Local installation restrictions | -1.1 pp | California, U.S. Northeast, Canadian cities, EU municipalities | Short term (≤ 2 years) |
| Polymer and freight volatility | -0.9 pp | Europe, North America, India, import-dependent markets | Short term (≤ 2 years) |
Opportunity Analysis
Circular Turf-as-a-Service
The opportunity is being created by the mismatch between field replacement volume and recovery capacity: the EU has approximately 20,000 synthetic fields, roughly 2,000 require renewal annually, and only about 10% of materials from synthetic sports fields are currently reused or recycled. A full-size pitch can contain 200–500 tonnes of carpet, sand, rubber or mineral infill, backing, and underlay, making end-of-life logistics a USD 50,000–250,000 budget exposure that public buyers often fail to reserve at installation; converting that exposure into an annual service charge of USD 8,000–25,000 per field creates recurring revenue and reduces tender resistance by spreading replacement funding across the asset life.
Technically credible recovery already exists: an EU-recognized process has demonstrated recovery of up to 95% of an end-of-life turf system’s materials, including highly cleaned sand, rubber, and fibre streams. The strategic shift is from selling square metres of turf to owning the lifecycle relationship, with suppliers able to charge a 3–8% circularity premium for take-back guarantees, material passports, removal scheduling, polymer recovery, and audited diversion from landfill; at a portfolio of 250 fields, this equates to USD 2–6 million in recurring annual service revenue before resurfacing contracts.
The model is not a present baseline driver because recycling remains fragmented and most contracts lack enforceable take-back provisions, but regulation, public-procurement carbon scoring, landfill costs, and 2031 infill transitions make the economic logic increasingly unavoidable. Companies that secure recycler partnerships, standardize separable backing systems, finance removal reserves, and guarantee recovery outcomes can add an estimated +1.8 percentage points to CAGR across Europe, North America, Japan, and Australia during the 2028–2030 execution window.
Opportunity Impact Analysis
| Opportunity | (~) % Potential CAGR Upside | Geographic Relevance | Execution Window |
|---|---|---|---|
| Circular turf-as-a-service | +1.8 pp | EU, North America, Japan, Australia | Medium term (2–4 years) |
| PFAS-free certified systems | +1.6 pp | U.S., Canada, EU, developed APAC | Short term (≤ 2 years) |
| Low-infill sports platforms | +1.5 pp | EU core, UK, North America, GCC | Medium term (2–4 years) |
| Rooftop amenity turf bundles | +1.3 pp | GCC, APAC megacities, North America, EU | Medium term (2–4 years) |
| Managed field-capacity networks | +1.2 pp | India, ASEAN, Africa, LATAM, UK | Short term (≤ 2 years) |
| Regional installer roll-ups | +1.0 pp | India, ASEAN, LATAM, Eastern Europe, Africa | Medium term (2–4 years) |
Challenges Analysis
Lifecycle Performance Assurance
Artificial grass faces a persistent lifecycle-assurance challenge because field performance depends not only on fibre quality but on the complete installed system—sub-base, drainage, shock pad, seams, backing, infill, pile height, maintenance frequency, local climate, usage intensity, and repair quality—creating a long-duration risk that a technically compliant installation will degrade unevenly before its intended 8–15-year service life. FIFA’s 2024 testing revision raised the durability bar by doubling FIFA Quality Pro mechanical-abrasion testing to 6,000 Lisport XL cycles and adding yarn-brittleness and shock-pad requirements, while community-grade FIFA Quality pitches must be engineered to handle 40–60 hours of weekly use.
The operational exposure grows rapidly when actual usage exceeds design assumptions: a municipal field expected to host 40 hours per week but used for 65–75 hours accumulates 1,300–1,800 excess annual playing hours, accelerating fibre fibrillation, seam stress, infill displacement, compaction, hardening, and ball-roll deviation; an unplanned resurfacing two years early on a USD 1–2 million field can destroy USD 150,000–400,000 of expected residual asset value before removal and downtime costs. Performance management also requires regular brushing, decompaction, infill-depth control, drainage inspection, seam repair, grooming records, traction and force-reduction testing, yet many public owners budget only basic cleaning rather than the USD 10,000–50,000 annual maintenance envelope required for highly used sites.
FIFA certification requires both laboratory and field verification across player-surface interaction, ball response, composition, weather resistance, seam strength, durability, and quality assurance, and FIFA carries out random checks on certified fields, making incomplete maintenance documentation a material renewal and reputation risk. Suppliers must increasingly move toward usage-indexed warranties, connected maintenance logs, annual condition audits, predictive resurfacing budgets, certified repair networks, and product configurations tailored to actual weekly hours rather than lowest initial price. Until asset owners consistently fund lifecycle maintenance and vendors standardize performance-data capture, lifecycle assurance will impose an estimated -1.3-percentage-point long-term CAGR friction drag across global sports turf markets.
Challenges Impact Analysis
| Challenge | (~) % CAGR Friction Drag | Geographic Relevance | Mitigation Horizon |
|---|---|---|---|
| Lifecycle performance assurance | -1.3 pp | Global sports markets, developed APAC, EU | Long term (≥ 4 years) |
| Heat-risk operating protocols | -1.1 pp | U.S. Sun Belt, MENA, Australia, Southern EU | Long term (≥ 4 years) |
| Alternative infill qualification | -1.0 pp | EU, UK supply chain, global sports OEMs | Medium term (2–4 years) |
| Installer skill fragmentation | -0.9 pp | India, ASEAN, Africa, LATAM, Eastern Europe | Long term (≥ 4 years) |
| Circular recovery logistics | -0.8 pp | EU, North America, Japan, Australia | Medium term (2–4 years) |
| Polymer supply-chain volatility | -0.7 pp | Europe, North America, India, import markets | Medium term (2–4 years) |
Geopolitical Impact Analysis
Ongoing conflicts, particularly the Russia–Ukraine war and the war in Gaza, are affecting the Artificial Grass Market through higher logistics costs, disrupted construction activity, damaged sports infrastructure, and pressure on polymer-based material supply chains. Artificial grass depends heavily on polyethylene, polypropylene, backing compounds, transport, and installation services, making the sector sensitive to energy prices and international trade disruptions.
At the same time, reconstruction could create future demand for durable, low-maintenance sports and recreational surfaces. In April 2026, the UN, European Union, and World Bank estimated Gaza’s total recovery and reconstruction requirement at USD 71.4 billion, including USD 26.3 billion needed during the first 18 months. Physical infrastructure damage alone was estimated at USD 35.2 billion.
The scale of destruction is significant, with UNOSAT reporting that around 81% of structures in Gaza were damaged by October 2025. For artificial grass suppliers, near-term demand in war zones remains weak, but long-term rebuilding of schools, community grounds, stadiums, and public recreation areas could support future installations once basic infrastructure and construction activity recover.
Regional Insights
In 2025, Asia Pacific held a dominant Artificial Grass Market position, capturing more than a 32.20% share and USD 2.1574 billion. China provides a strong demand base through its expanding sports infrastructure. Government data released in 2025 showed more than 4.84 million sports venues nationwide, covering 4.23 billion square meters, including over 3.03 million ball-game venues.
Sports venue area reached 3.0 square meters per person, already exceeding the national target of 2.6 square meters. Continued construction of football fields, schools, parks, and community sports facilities supports demand for durable artificial turf systems.
Middle East – Fastest-Growing Region: The Middle East is developing rapidly as governments invest in sports facilities, public recreation, and international sporting infrastructure. Saudi Arabia’s Qassim Region reported 270 sports and training facilities in 2026, including 19 football facilities, 170 sports centers, 71 academies, and 24 private sports clubs.
In 2025, Saudi Arabia also launched a sports-facility investment program covering 3 major sports cities, with private-sector operating contracts running for 5 years. These investments, together with hot and water-stressed conditions, support wider use of artificial grass for football pitches, training grounds, public parks, and community recreation spaces.
Key Regions and Countries Insights
- North America
- US
- Canada
- Europe
- Germany
- France
- The UK
- Spain
- Italy
- Rest of Europe
- Asia Pacific
- China
- Japan
- South Korea
- India
- Australia
- Rest of APAC
- Latin America
- Brazil
- Mexico
- Rest of Latin America
- Middle East & Africa
- GCC
- South Africa
- Rest of MEA
Key Players Analysis
TenCate Grass remained a major global artificial turf supplier, supported by manufacturing, installation, maintenance, and recycling operations. In 2025, it acquired a majority stake in Sports & Leisure Group, expanding its sports and outdoor-living business. TenCate operates in more than 60 countries, has over 5,000 employees, and runs 15 manufacturing locations. Its 2024 revenue reached about USD 1.75 billion. In 2025, the company also announced a new 45,000 m² production site in Nijverdal designed to cut annual CO₂ emissions by around 4,000 tonnes.
Tarkett S.A., through FieldTurf, maintained a strong artificial grass position across professional, institutional, and recreational sports applications. In 2025, Tarkett generated EUR 3.3 billion in net sales and operated through 33 production sites in 20 countries. Its FieldTurf business also operates 3 sports-surface recycling centers. At the end of 2025, Tarkett started a new recyclable-turf production line in France with investment of about EUR 4.4 million. Its Greenboard technology can also contain up to 60% post-consumer recycled turf material.
Shaw Sports Turf continued expanding through product innovation, sports partnerships, and recycling initiatives. In March 2025, the company opened its new PEAK Performance Lab to support turf research focused on playability, environment, and athlete kinetics. Shaw has completed more than 4,000 synthetic turf installations and operates a 75,000-square-foot research and development center. In April 2025, it announced plans to recycle 93 tons of turf material from College Football Playoff fields. By 2026, Shaw had reclaimed, reused, or recycled more than 13 million pounds of synthetic turf since 2020.
Top Key Players Outlook
- TenCate Grass
- Tarkett S.A. / FieldTurf
- Shaw Sports Turf
- CCGrass
- Sport Group / Polytan
- Victoria plc
- Condor Grass
- CoCreation Grass Corporation
- SIS Pitches Ltd.
- Act Global
- Controlled Products LLC / GrassTex
- SYNLAWN
- Global Syn-Turf, Inc.
- ForestGrass
- Beaulieu International Group
Recent Developments
- By August 2026, CCGrass had passed 600+ FIFA-certified football fields globally. CCGrass now operates 6 integrated production bases across China, Vietnam, and Indonesia, serves more than 160 countries, and has annual production capacity above 160 million square meters.
- In July 2026, Victoria reported that UK & Europe Soft Flooring generated £551.3 million in underlying revenue and sold 71.2 million m² of flooring, while the Group operated artificial-grass manufacturing facilities in 2 locations, Genemuiden in the Netherlands and Rahden in Germany.
Report Scope
| Report Features | Description |
|---|---|
| Market Value (2025) | USD 6.7 Bn |
| Forecast Revenue (2035) | USD 14.6 Bn |
| CAGR (2026-2035) | 8.0% |
| Base Year for Estimation | 2025 |
| Historic Period | 2020-2024 |
| Forecast Period | 2026-2035 |
| Report Coverage | Revenue Forecast, Market Dynamics, Competitive Landscape, Recent Developments |
| Segments Covered | By Type (Fibrillated, Monofilament, Texturized), By Fibre Material (Polyethylene, Polypropylene, Nylon, Others), By Pile Height (Below 30 mm, 30–40 mm, Above 40 mm), By Application (Sports courts and fields, Residential, Commercial, Landscaping, Others), By Distribution Channel (Offline, Online) |
| Regional Analysis | North America – US, Canada; Europe – Germany, France, The UK, Spain, Italy, Rest of Europe; Asia Pacific – China, Japan, South Korea, India, Australia, Singapore, Rest of APAC; Latin America – Brazil, Mexico, Rest of Latin America; Middle East & Africa – GCC, South Africa, Rest of MEA |
| Competitive Landscape | TenCate Grass, Tarkett S.A. / FieldTurf, Shaw Sports Turf, CCGrass, Sport Group / Polytan, Victoria plc, Condor Grass, CoCreation Grass Corporation, SIS Pitches Ltd., Act Global, Controlled Products LLC / GrassTex, SYNLAWN, Global Syn-Turf, Inc., ForestGrass, Beaulieu International Group |
| Customization Scope | Customization for segments, region/country-level will be provided. Moreover, additional customization can be done based on the requirements. |
| Purchase Options | We have three licenses to opt for: Single User License, Multi-User License (Up to 5 Users), Corporate Use License (Unlimited User and Printable PDF) |





































