


Report Overview
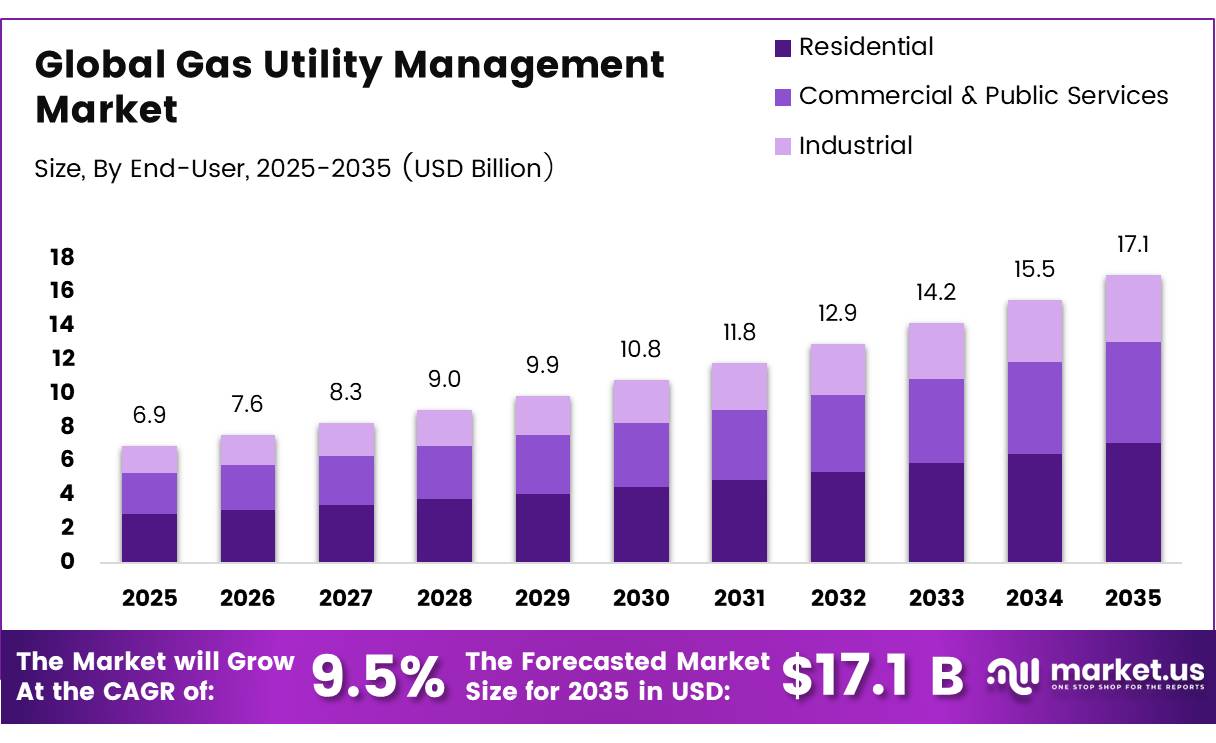
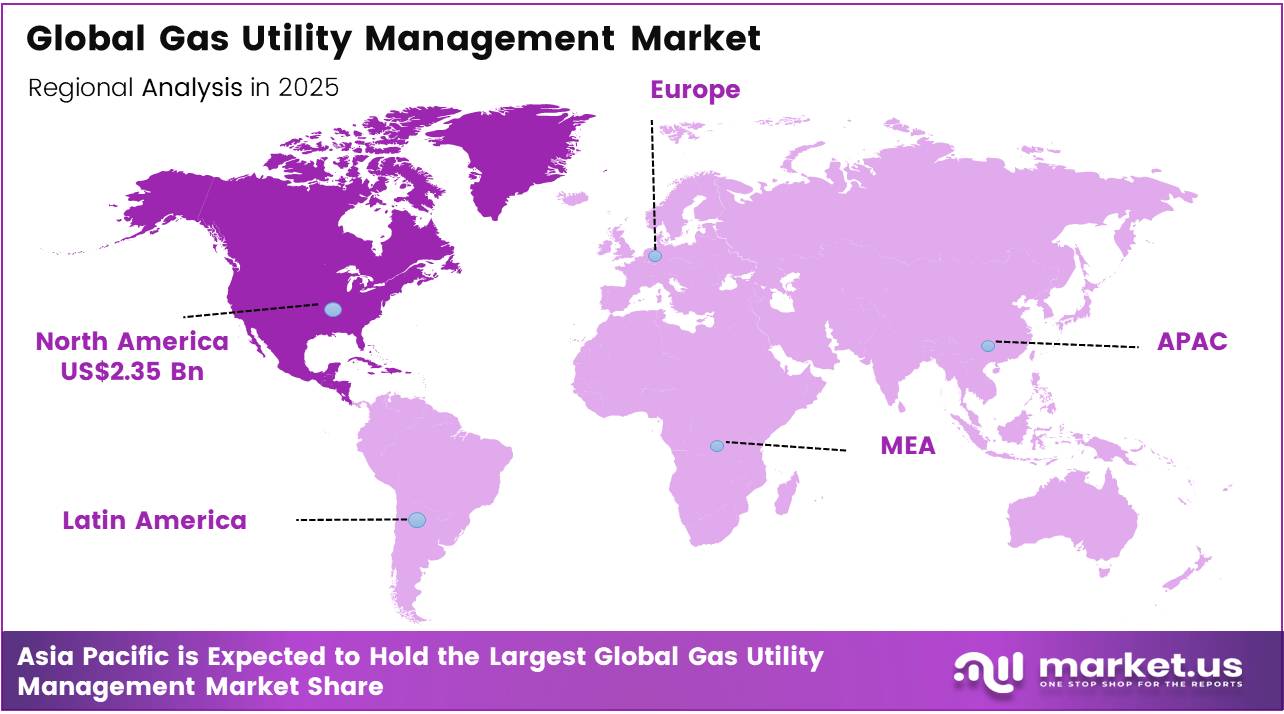
In 2025, the Global Gas Utility Management Market was valued at USD 6.9 billion, and between 2026 and 2035, this market is estimated to register a CAGR of 9.5%, reaching about USD 17.1billion by 2035. In 2025, North America held a dominant market position, capturing more than a 34.0% share, holding USD 2.35 Billion revenue.
The Gas Utility Management Market is expanding as utilities adopt digital platforms for billing, pipeline monitoring, asset maintenance, and customer management. Smart meters, methane regulations, leakage control, and predictive maintenance are increasing demand for integrated gas network management solutions. According to the IEA’s Gas Market Report, Q1-2025, global natural-gas consumption increased by 2.8%, or 115 billion cubic metres, in 2024, while natural gas met approximately 40% of the increase in global energy demand during the year.
- In the United States, 2025 distribution infrastructure covered 39 million miles and served 73.13 million service connections, illustrating the scale requiring inspection, maintenance, and integrity management, according to PHMSA.
Growth is driven by smart metering, regulatory compliance, leakage reduction, cybersecurity, and real-time network visibility. Great Britain had 41 million smart and advanced electricity and gas meters operating by December 2025, covering more than two-thirds of eligible meters, according to DESNZ. Meanwhile, the European Union’s methane regulation requires measurement, reporting, verification, leak detection, and repair, while the OGMP 2.0 framework already covers 42% of oil and gas production.
Future opportunities will emerge from AI-based demand forecasting, digital twins, mobile workforce systems, predictive maintenance, satellite methane detection, and renewable-gas integration. Utilities can deploy cloud platforms to improve outage response, reduce unaccounted-for gas, automate regulatory reporting, and coordinate biomethane or hydrogen blending. These capabilities should strengthen safety, efficiency, and resilience while supporting data-intensive utility operations.
Key Takeaways
- The global Gas Utility Management market was valued at USD 6.9 billion in 2025.
- The global market is projected to grow at a CAGR of 9.5% and is estimated to reach USD 17.1 billion by 2035.
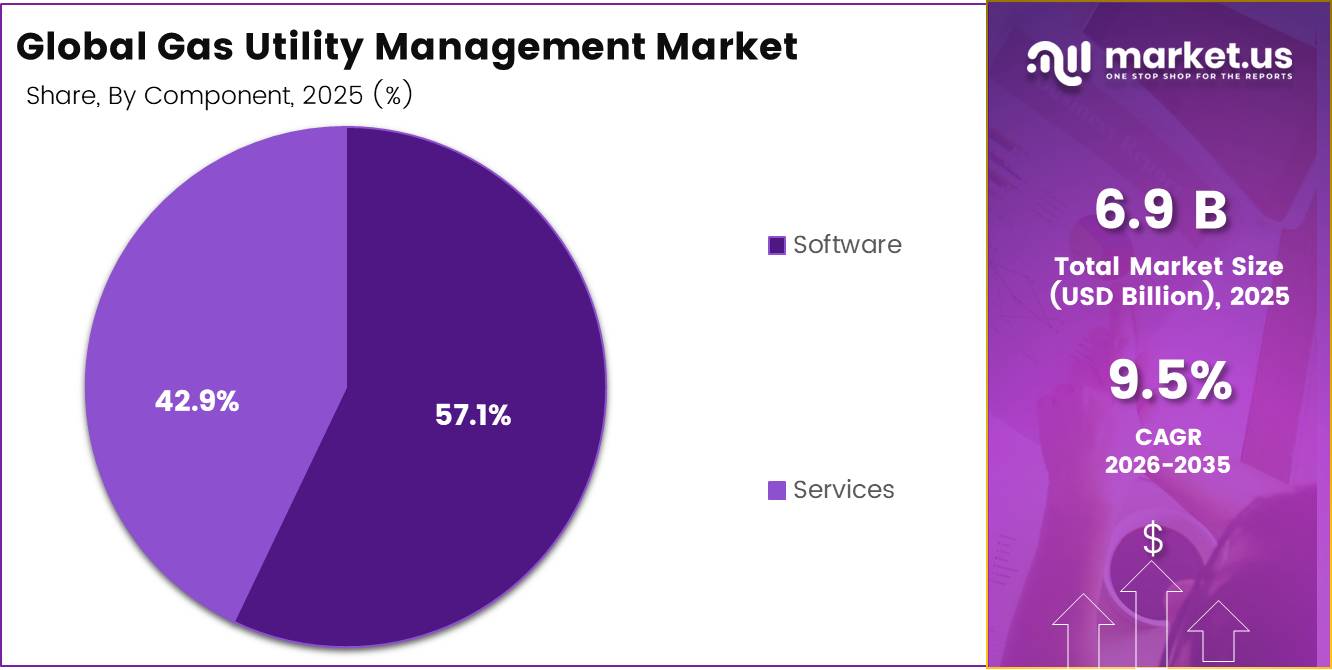
- On the basis of Component, the Software Gas Utility Management dominated the market, constituting 57.1% of the total market share.
- Based on the end user, the Residential dominated the Gas Utility Management market, with a substantial market share of around 41.50%.
- Among the Deployment Mode, the Cloud-Based held a major share in the Gas Utility Management market, 62.0% of the market share.
- In 2025, the North America was the most dominant region in the Gas Utility Management market, accounting for 34.0% of the total global consumption.
Component Analysis
Software represents dominant Segment in the Market.
Software held the leading market position, capturing more than a 57.10% share. Utilities depend on software for customer billing, demand forecasting, pipeline mapping, leak alerts, asset records, and regulatory reporting.
- The U.S. Energy Information Administration recorded 73,719,064 residential natural-gas consumers and 5,658,114 commercial consumers in 2024. Managing this large customer base strengthens the need for automated platforms that can process consumption data, improve billing accuracy, schedule fieldwork, and provide operators with a clear view of network performance.
Services is the growing segment as utilities need implementation, system integration, staff training, cybersecurity, and compliance assistance. EPA reporting requirements cover facilities emitting at least 25,000 metric tons of greenhouse gases annually across 10 petroleum and natural-gas segments. The agency’s Methane Emissions Reduction Program also provides USD 1.36 billion in financial and technical assistance, supporting demand for emissions measurement, data management, inspection, and advisory services.
End-User Analysis
Gas Utility Management Are the Most Widely Used In Residential sector.
Residential held the leading market position, capturing more than a 41.50% share. Gas utilities manage millions of household accounts that require accurate metering, seasonal demand forecasting, digital billing, safety notifications, and rapid outage response.
- The U.S. Energy Information Administration reported that residential consumers used 4,844,636 million cubic feet of natural gas in 2025. This large consumption base encourages utilities to invest in automated customer platforms, smart-meter analytics, leak detection, and mobile workforce tools that improve service reliability and control operating costs.
Commercial & Public Services is the fastest-growing segment as offices, hospitals, schools, retail buildings, and government facilities require centralized control across multiple sites. U.S. commercial natural-gas consumption reached 3,611,150 million cubic feet in 2025, supporting demand for real-time monitoring, automated billing, energy optimization, compliance reporting, and predictive maintenance solutions..
Deployment Mode Analysis
Cloud-Based Are the Most Widely Used Deployment Mode.
Cloud-Based held the leading market position, capturing more than a 62.00% share. Gas utilities increasingly prefer cloud platforms because they connect billing, customer service, pipeline data, mobile workers, and demand forecasting within one scalable environment.
- Eurostat reported that 52.7% of EU enterprises purchased cloud services in 2025, representing a 7.4 percentage-point increase from 2023. This wider digital shift supports utility demand for flexible storage, remote access, faster software updates, and lower dependence on internally maintained infrastructure.
On-Premises deployment continues to grow among gas operators that require direct control over operational data, critical network systems, security policies, and regulatory records. The UK Government’s Cyber Security Breaches Survey 2025–2026 found that 43% of businesses experienced a cyber breach or attack, while the rate reached 69% among large businesses. These risks encourage security-sensitive utilities to retain selected applications within locally controlled environments.
Key Market Segments
By Component
- Software
- Asset Management & GIS
- Network Monitoring & Control (SCADA)
- Customer Information Systems (CIS) & Billing
- Workforce & Operations Management
- Leak Detection & Pipeline Integrity
- Services
- System Integration
- Consulting & Training
- Support & Maintenance
By End-User
- Residential
- Commercial & Public Services
- Commercial Enterprises
- Institutional Buildings
- Industrial
- Manufacturing Plants
- Power Generation
- Chemical & Refining
By Deployment Mode
- Cloud-Based
- Public Cloud
- Private Cloud
- Hybrid
- On-Premises
Driver Analysis
Methane & emissions regulation accelerating digital management platforms
Tightening methane and broader greenhouse gas regulations across major gas economies are forcing utilities to re‑platform operations around measurable leak detection, emissions accounting, and network optimization, making gas utility management suites mission‑critical rather than discretionary. The International Energy Agency’s Net Zero by 2050 trajectory, widely embedded in national energy strategies, requires methane leakage reductions in the range of 70–75% versus 2020 baselines by 2050, translating into aggressive near‑term milestones where operators must demonstrate stepwise reductions through 2030.
This is structurally moving gas utilities away from fragmented internal tools and bespoke integrators toward subscription‑based SaaS platforms with standardized modules for leak detection, emissions dashboards, and automated compliance workflows.
As ESG‑linked financing and green bonds increasingly embed methane‑performance covenants, utilities adopting advanced management platforms can access lower financing costs, while software vendors capture recurring revenues from regulatory change, underwriting an estimated ~2.3 percentage point uplift in market CAGR as compliance transforms into a continual, digitized service layer.
Drivers Impact Analysis
| Driver | (~) % Impact on CAGR Forecast | Geographic Relevance | Impact Timeline |
|---|---|---|---|
| Methane & emissions regulation accelerating digital management platforms | +2.3% | North America core, EU, APAC corridors | Medium term (2–4 years) |
| Smart metering & AMI rollout generating real-time gas data | +1.9% | EU, North America, APAC urban clusters | Short–Medium term (≤ 4 years) |
| Pipeline modernization & integrity management investments | +1.7% | North America core, Europe, Middle East, APAC | Long term (≥ 4 years) |
| Digitalization of gas utilities via cloud, AI, and IoT | +2.1% | Global, led by North America, EU, APAC | Short–Medium term (≤ 4 years) |
| Energy transition & urbanization expanding gas demand | +1.5% | APAC corridors, Middle East, Latin America | Long term (≥ 4 years) |
| Gas supply regulation and security of supply mandates | +1.4% | India, EU, select APAC and Middle East | Short–Medium term (≤ 4 years) |
Restraint Analysis
High implementation cost & legacy integration
High upfront implementation cost and complex integration with decades‑old SCADA, ERP, and billing stacks are the single most visible drag on gas utility management adoption, with integration premiums frequently adding roughly 25–35% to initial software budgets and stretching project timelines by 12–18 months, which in turn compresses free cash flow and delays ROI realization for utilities already carrying heavy infrastructure capex.
Many mid‑tier and municipal gas distributors operate on annual capex envelopes in the low hundreds of millions of USD, of which only 2–4% is typically available for IT and digital projects after allocations to statutory pipeline works, metering, and safety upgrades; within this constrained pool, a full‑stack management platform can consume 30–50% of available digital capex in the first two years when including licenses, system integrators, data cleansing, and workforce retraining.
Integration complexity is particularly acute where control rooms rely on SCADA systems commissioned in the 1990s or early 2000s and billing engines are highly customized mainframe applications, requiring bespoke middleware or phased migration to avoid operational disruption; this raises not only cost but also risk, causing boards to demand internal payback periods of 3–5 years before approving investments, which many utilities struggle to underwrite given tariff caps and regulated returns.
As a result, many utilities opt for incremental module deployment instead of full‑suite transformation, slowing revenue ramp‑up for vendors and flattening the aggregate market growth curve by an estimated 2.4 percentage points versus unconstrained digital adoption trajectories, particularly in regions with large installed bases of legacy systems such as North America, Europe, and older APAC networks.
Restraint Impact Analysis
| Restraint | (~) % Impact on CAGR Forecast | Geographic Relevance | Impact Timeline |
|---|---|---|---|
| High implementation cost & legacy integration | -2.4% | North America core, EU, APAC urban, MENA | Medium–Long term (2–6 years) |
| Regulatory complexity & compliance penalty risk | -2.1% | North America core, EU, India, APAC corridors | Short–Medium term (≤ 4 years) |
| Infrastructure capex delays & under-utilized pipelines | -1.8% | India, APAC, parts of EU & LatAm | Long term (≥ 4 years) |
| Economic volatility & deferred digital capex | -1.6% | APAC emerging, LatAm, CEE, MENA | Medium term (2–4 years) |
| Data quality, interoperability & skills shortages | -1.5% | Global, more acute in emerging APAC & LatAm | Medium–Long term (2–6 years) |
| Cybersecurity, vendor lock-in & risk aversion | -1.3% | North America core, EU, regulated APAC markets | Medium term (2–4 years) |
Opportunity Analysis
Data‑as‑a‑Service & analytics monetization
Positioning gas utility management platforms as Data‑as‑a‑Service (DaaS) and advanced analytics providers to external stakeholders is a structurally untapped opportunity because most current implementations treat data solely as an internal operations resource, not as a monetizable product, even though adjacent oil and gas sectors already generate multi‑billion‑dollar data monetization revenues. Today, gas utilities capture granular information on consumption, network performance, leaks, and asset health across millions of endpoints, but typically only use it for billing, basic planning, and compliance; by contrast, energy‑sector data monetization markets are projected to exceed 50 billion USD before 2033 in oil and gas alone.
If gas utilities and management vendors structure anonymized, aggregated datasets and analytics services targeted at city planners, ESG investors, insurers, industrial customers, and technology firms—for example, selling pipeline‑integrity risk scores, localized demand forecasts, or methane‑emissions heatmaps they could convert 2–4% of existing opex savings and data infrastructure spend into direct revenue streams. Realistic modeling suggests that if even 10–15% of large gas utilities in North America and Europe were to launch DaaS offerings priced at low single‑digit USD per meter per year, total addressable DaaS revenue could reach the low hundreds of millions of USD within 3–5 years, with EBIT margins exceeding 40% due to high incremental gross margins.
This opportunity differs from current drivers because it requires explicit productization of data, creation of commercial APIs, and new go‑to‑market motions partner programs with consultancies, data exchanges, and marketplaces—rather than simply using platforms to optimize internal operations. Execution would materially improve unit economics for management vendors by adding high‑margin data subscriptions on top of base SaaS fees and would deepen utility engagement, supporting an estimated ~2.4‑percentage‑point upside to market CAGR if captured across North America, EU, and mature APAC markets over the next 2–4 years.
Opportunity Impact Analysis
| Opportunity | (~) % Potential CAGR Upside | Geographic Relevance | Execution Window |
|---|---|---|---|
| Data-as-a-Service & analytics monetization | +2.4% | North America core, EU, APAC mature | Medium term (2–4 years) |
| Cross-utility multi-vertical management platforms | +2.1% | Global, led by North America, EU | Medium–Long term (3–6 years) |
| Emerging market city-gas platformization | +2.3% | India, APAC emerging, MENA urban | Short–Medium term (≤ 4 years) |
| Outcome-based and tiered SaaS pricing | +1.8% | North America core, EU, APAC corridors | Short term (≤ 2 years) |
| Asset, land & rights-of-way monetization via platforms | +1.6% | Global, especially urban EU & APAC | Medium–Long term (3–6 years) |
| Ecosystem partnerships for EV, hydrogen & smart city integration | +2.0% | EU, North America, selected APAC | Long term (≥ 4 years) |
Challenges Analysis
Digital & domain talent gap
The digital and domain talent gap in utilities represents a persistent friction rather than an immediate restraint because gas utilities continue to operate and buy software, but constrained access to skilled workers slows deployment, dampens feature utilization, and inflates operating costs, cumulatively dragging achievable CAGR by around 1.4 percentage points over the medium term.
Practically, a mid‑sized gas distributor attempting to roll out a full gas utility management suite might require 15–30 internal and external specialists—SCADA engineers, integration architects, data modelers, cybersecurity leads, and change‑management staff but often operates with less than half that number dedicated to digital projects, forcing sequential rather than parallel execution and extending timelines by 6–12 months. Talent constraints also raise labor costs: specialized digital roles in energy and utilities can command wage premiums of 20–30% above traditional operations roles, increasing opex and reducing budget available for additional licenses or modules.
Strategically, utilities must invest in structured workforce planning, apprenticeships, cross‑industry recruitment, and AI‑assisted tools to augment lean teams, and vendors increasingly embed training, low‑code configuration, and managed services into their offerings to partially bridge the gap. Until those adjustments materially expand the talent pool a 3–6‑year horizon this systemic skills friction will continue to shave growth off the gas utility management market’s potential by slowing implementation cycles and constraining the depth of platform adoption.
Challenges Impact Analysis
| Challenge | (~) % CAGR Friction Drag | Geographic Relevance | Mitigation Horizon |
|---|---|---|---|
| Digital & domain talent gap | -1.4% | Global, esp. APAC emerging, EU | Medium–Long term (3–6 years) |
| Cybersecurity & data protection burden | -1.3% | North America core, EU, advanced APAC | Medium term (2–4 years) |
| Legacy system & data integration complexity | -1.2% | North America core, EU, older APAC grids | Medium term (2–4 years) |
| Supply chain & platform implementation volatility | -1.1% | APAC logistics corridors, global | Short–Medium term (≤ 4 years) |
| Climate, extreme events & resilience demands | -1.0% | North America, EU, APAC weather-exposed regions | Long term (≥ 4 years) |
| Evolving regulatory expectations & audit intensity | -0.9% | EU regulatory hubs, US, India | Medium term (2–4 years) |
Geopolitical Impact Analysis
Geopolitical Realignment and Supply Chain Fragmentation Reshaping Gas Utility Management Manufacturing.
Geopolitical realignment is changing how gas utilities forecast supply, manage storage, and control network risk. European Commission data show that Russian gas deliveries to the EU declined to 36 billion cubic metres in 2025, reducing Russia’s share of EU gas imports to 12%. During the same period, EU gas demand remained 19% below the August 2022 baseline. Utilities are therefore managing a more diversified but operationally complex supply structure involving pipelines, LNG terminals, storage facilities, and cross-border interconnectors. This shift strengthens demand for real-time nomination management, supplier-risk scoring, automated compliance reporting, and scenario-based demand forecasting.
LNG dependence is adding another layer of complexity to gas utility management. EU LNG imports reached 131 billion cubic metres in 2025, representing 45% of total gas imports, while pipeline deliveries fell to 158 billion cubic metres, an annual decline of 8%. EU regasification capacity expanded by 8%, reflecting new infrastructure in Poland, Germany, Italy, and Belgium. Global LNG trade also rose to 603 billion cubic metres, an increase of 7%, while the United States supplied 26% of worldwide exports. These changing trade flows require utilities to track cargo schedules, terminal availability, currency exposure, contract prices, storage withdrawals, and delivery disruptions through integrated digital platforms.
Regional Analysis
North America Held the Largest Share of the Global Gas Utility Management Market.
North America held the leading position in the Gas Utility Management Market, capturing more than a 34.00% share. The region benefits from mature gas infrastructure, large production volumes, strict safety rules, and widespread use of digital billing and pipeline-monitoring systems.
- U.S. marketed natural-gas production averaged a record 118.5 billion cubic feet per day in 2025, increasing by 5.3 billion cubic feet per day. Appalachia, Permian, and Haynesville together represented 67% of production, creating strong demand for asset management, forecasting, leak detection, and field-service platforms.
Asia Pacific is the fastest-growing region as expanding gas production and urban distribution networks require more advanced operational control. China’s government reported natural-gas production of 261.9 billion cubic metres in 2025, up 6.2% from the previous year. This rising volume supports investment in smart metering, pipeline mapping, customer platforms, maintenance scheduling, and real-time network analytics.
Key Regions and Countries Covered
- North America
- The US
- Canada
- Europe
- Germany
- France
- The UK
- Spain
- Italy
- Russia & CIS
- Rest of Europe
- APAC
- China
- Japan
- South Korea
- India
- ASEAN
- Rest of APAC
- Latin America
- Brazil
- Mexico
- Rest of Latin America
- Middle East & Africa
- GCC
- South Africa
- Rest of MEA
Key Players Analysis
Gas Utility Management providers focus on strengthening digital capabilities, operational efficiency, and system integration to maintain competitiveness. A key priority is continuous platform innovation, including the development of cloud-based billing, smart metering, leak detection, asset monitoring, and demand forecasting tools that improve network visibility, safety, and service reliability.
Integration with customer information systems, geographic information systems, and pipeline control platforms helps utilities reduce data gaps and improve decision-making across complex gas networks. Strategic expansion into rapidly modernizing utility markets enables providers to align with rising demand for digital infrastructure and regulatory compliance.
The Major Players In The Industry
- Oracle Corporation
- SAP SE
- Siemens AG
- Schneider Electric SE
- Hexagon AB
- Itron Inc.
- Landis+Gyr Group AG
- IBM Corporation
- Honeywell International Inc.
- GE Vernova (General Electric)
- ABB Ltd.
- Hitachi Energy Ltd.
- Cisco Systems, Inc.
- Bentley Systems, Inc.
- AVEVA Group plc
Key Development
- In May 2025, Itron Inc. shipped its 3 millionth Intelis gas meter, marking a deployment milestone. The solid-state meter supports shutoff during abnormal pressure, flow, or temperature events, strengthening safety and control for gas utilities.
- In November 2025, Landis+Gyr launched its Future Gas prepayment program across Northern Ireland, covering 217,000 homes and businesses. The rollout combines ultrasonic meters, NB-IoT connectivity, and a SaaS platform for mobile top-ups and usage tracking.
Report Scope
| Report Features | Description |
|---|---|
| Market Value (2025) | USD 6.9 Bn |
| Forecast Revenue (2035) | USD 17.1 Bn |
| CAGR (2026-2035) | 9.5% |
| Base Year for Estimation | 2025 |
| Historic Period | 2020-2024 |
| Forecast Period | 2026-2035 |
| Report Coverage | Revenue Forecast, Market Dynamics, Competitive Landscape, Recent Developments |
| Segments Covered | By Component (Software and Services), By End-User (Residential, Commercial & Public Services and Industrial), By Deployment Mode (Cloud-Based and On-Premises) |
| Regional Analysis | North America – The US & Canada; Europe – Germany, France, The UK, Spain, Italy, Russia & CIS, Rest of Europe; APAC– China, Japan, South Korea, India, ASEAN & Rest of APAC; Latin America– Brazil, Mexico & Rest of Latin America; Middle East & Africa– GCC, South Africa, & Rest of MEA |
| Competitive Landscape | Oracle Corporation, SAP SE, Siemens AG, Schneider Electric SE, Hexagon AB, Itron Inc., Landis+Gyr Group AG, IBM Corporation, Honeywell International Inc., GE Vernova (General Electric), ABB Ltd., Hitachi Energy Ltd., Cisco Systems, Inc., Bentley Systems, Inc., AVEVA Group plc. |
| Customization Scope | Customization for segments, region/country-level will be provided. Moreover, additional customization can be done based on the requirements. |
| Purchase Options | We have three licenses to opt for: Single User License, Multi-User License (Up to 5 Users), Corporate Use License (Unlimited Users and Printable PDF) |





































