


Report Overview
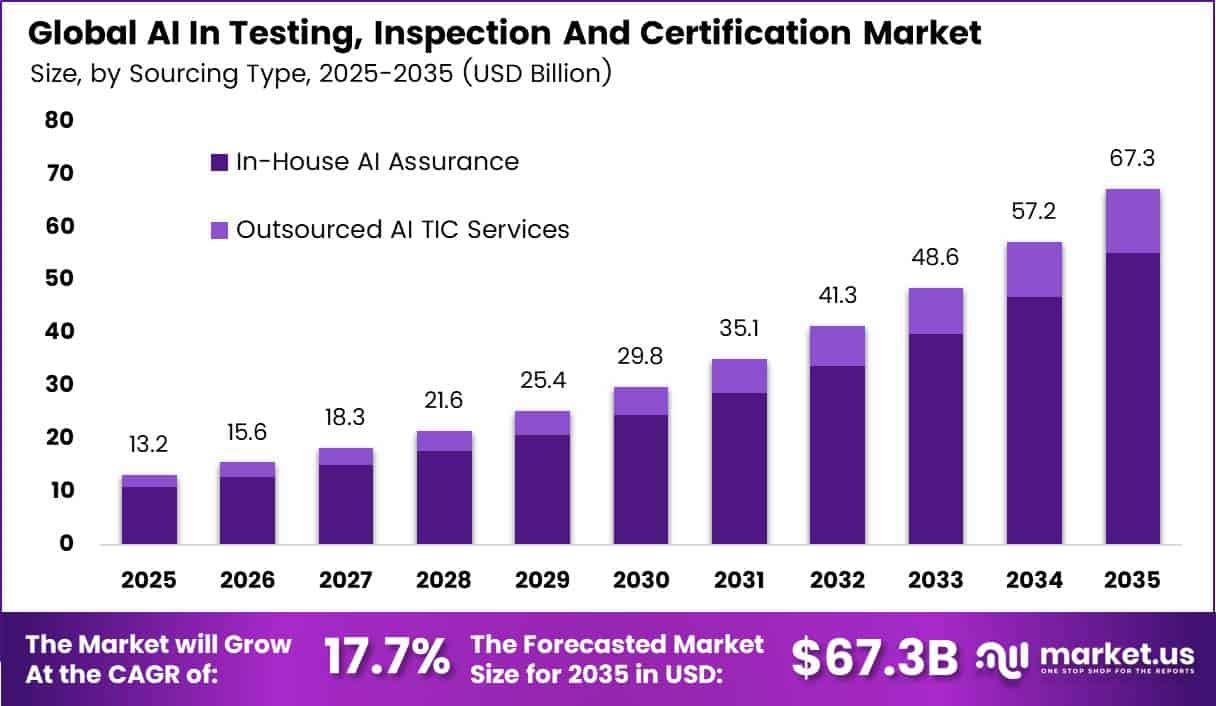
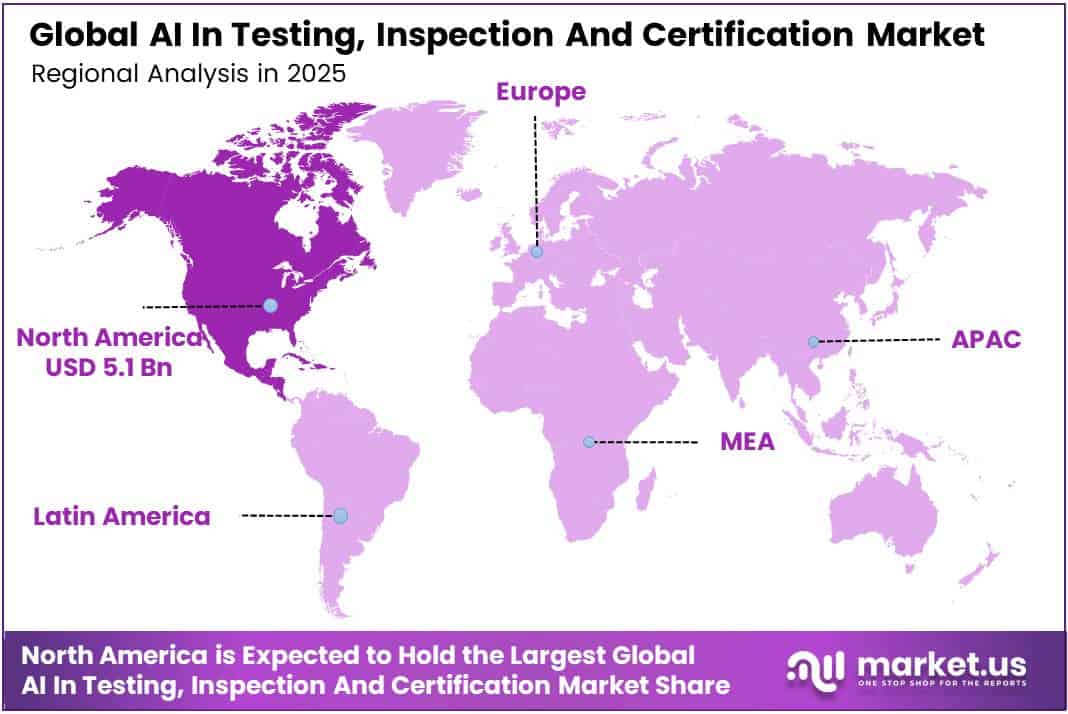
In 2025, the Global AI In Testing, Inspection And Certification Market was valued at USD 13.2 billion. The market is projected to grow at a CAGR of 17.7% during 2026–2035, reaching approximately USD 67.3 billion by 2035. North America dominated the global market in 2025, accounting for more than 38.2% of the total market share and generating approximately USD 5.1 billion in revenue.
Fast growth in digital use drives this demand. The ITU reported that about 6 billion people used the internet in 2025, a rise of more than 240 million in one year. The ITU also found that 5G now reaches more than half of the world’s people. Every new connected user adds load to AI-powered networks, apps, and services, and each of these systems needs testing before launch. Hardware spending tells the same story.
The WTO reported that AI-enabling goods such as chips and servers made up 47% of global merchandise trade growth in the first half of 2026, and trade in these goods jumped 67% year on year. More AI hardware in the field means more models to validate, more data sets to audit, and more products to certify against safety and quality rules.
North American region hosts the largest AI developers, cloud providers, and data center builders, so it creates the most AI systems that need independent checks. Trade data supports this lead. The WTO expects North American merchandise exports to grow 5.7% in 2026, the second-fastest pace after Asia, led by AI-linked goods. Strong digital use helps too.
The ITU found that 94% of people in high-income countries use the internet, which gives US and Canadian firms a deep base of users for AI products. Buyers in these markets want proof that AI tools work safely, fairly, and securely before they sign contracts.
Key Takeaways
- The AI in Testing, Inspection and Certification Market reached USD 13.2 billion in 2025 and will reach USD 67.3 billion by 2035. grow at a CAGR of 17.7% from 2026 to 2035.
- By deployment, Testing Services lead with a 54.6% share.
- By sourcing type, In-House AI Assurance leads with an 82.1% share.
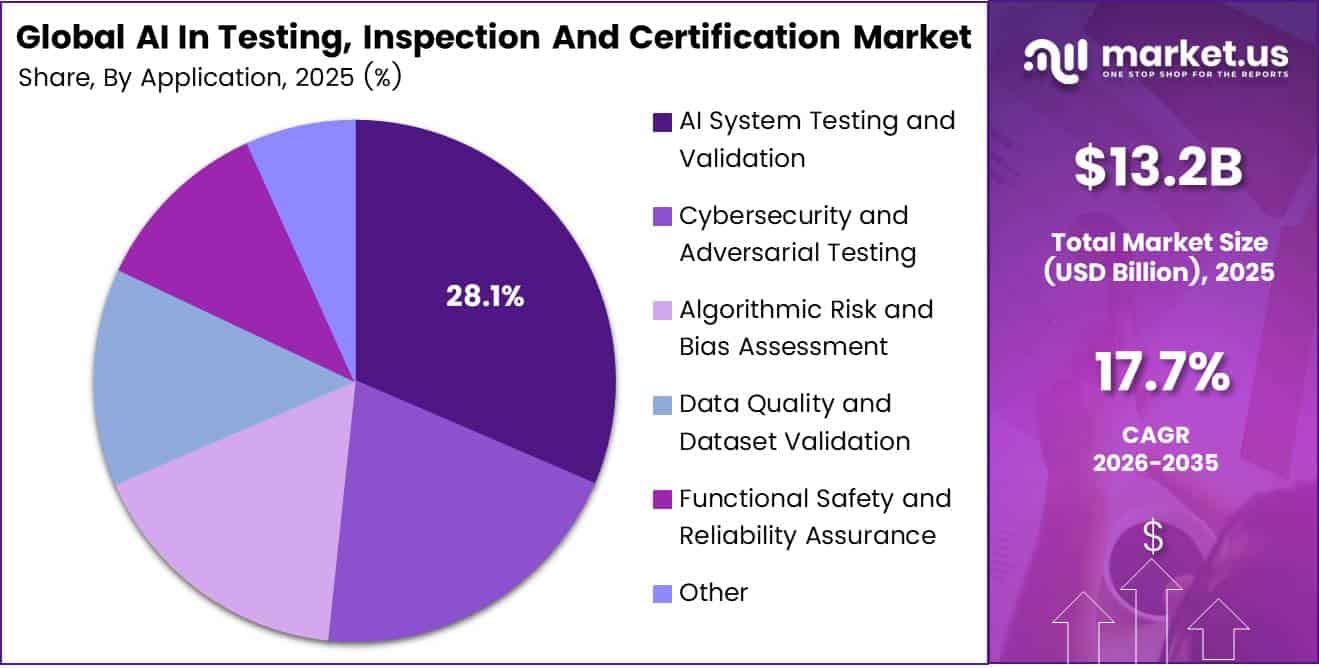
- By application, AI System Testing and Validation leads with a 28.1% share.
- By end-user industry, ICT and Telecom leads with a 22.0% share.
- North America leads with a 38.2% share and USD 5.1 billion in revenue.
By Deployment
Testing Services dominates with 54.6% due to mandatory model checks before every launch.
Testing Services leads because firms must prove an AI model works before they ship it. SGS, the world’s largest TIC company, earned revenue of CHF 6,945 million in 2025 with organic growth of 5.6%. It now adds data and AI checks through its CertX unit. Buyers order tests first, because a failed test stops a launch before any certificate matters.
Certification Services grows fastest because clients now want third-party proof they can show to regulators and buyers. SGS reported 19.2% growth in its Digital Trust business in 2025, with sales of at least CHF 350 million. Audit and certification work and a strategic partnership with NVIDIA drove that growth.
By Sourcing Type
In-House AI Assurance dominates with 82.1% due to tight control over sensitive training data.
In-House AI Assurance holds a clear lead because firms do not want to share private data and model code with outside parties. The EU AI Act raises the stakes. Since 2 August 2025, fines for banned AI practices can reach €35 million or 7% of global turnover. Large firms build their own review teams so they can catch problems early and keep full control.
Outsourced AI TIC services grow fastest because few firms can hire enough skilled AI auditors on their own. Independent providers keep adding staff to meet this demand. TÜV SÜD raised its average workforce by 5.4% to 27,974 full-time staff in 2025, and its staff outside Germany grew by 8.1%.
TÜV SÜD’s revenue also rose 6.1% to €3,639.2 million. Mid-size firms find it cheaper to rent this skill than to build it. An outside stamp also carries more weight with regulators and customers. As AI rules spread to more countries, this skills gap will keep pushing work to outside experts.
By Application
AI System Testing and Validation dominates with 28.1% due to rising AI failures in live use.
AI System Testing and Validation leads because companies must check that a model gives correct and steady results before and after launch. The OECD AI Incidents Monitor logged more than 2,000 new AI incidents in 2025, and each public failure pushes firms to test more often. Validation is the first step in almost every AI project, so it takes the largest share of budgets.
Breaking high-risk duties can cost up to €15 million or 3% of worldwide turnover. Some sources say the full high-risk regime applies from August 2026, while others say parts phase in through 2027–2028. Either way, the deadline pushes buyers to order red-team tests, attack simulations, and security reviews now, instead of waiting for an audit to find gaps.
By End-User Industry
ICT and Telecom dominates with 22.0% due to the largest base of deployed AI models.
ICT and Telecom holds the top share because tech and telecom firms build and run more AI models than any other sector. These firms also handle huge volumes of user data, so they face strict security and privacy checks. SGS’s Business Assurance unit reached CHF 780 million in 2025 with 4.2% organic growth, helped by information security certification.
Automotive and Transportation grows fastest because cars now rely on software and AI for driver aids and over-the-air updates. Since July 2024, UN Regulation No. 155 has required a certified Cybersecurity Management System for all newly produced vehicles across 54 signatory countries, including the EU, the UK, Japan and South Korea.
Key Market Segments
By Deployment
- Testing Services
- Certification Services
- Inspection Services
By Sourcing Type
- In-House AI Assurance
- Outsourced AI TIC Services
By Application
- AI System Testing and Validation
- Cybersecurity and Adversarial Testing
- Algorithmic Risk and Bias Assessment
- Data Quality and Dataset Validation
- Functional Safety and Reliability Assurance
- Other
By End-User Industry
- ICT and Telecom
- Automotive and Transportation
- Industrial Manufacturing and Machinery
- Life Sciences and Healthcare
- Energy and Utilities
- Aerospace and Defense
- Consumer Goods and Retail
- Food, Agriculture and Beverage
- Other
Geopolitical Impact Analysis
War in the Middle East shook 2026 trade plans. The WTO cut its 2026 merchandise trade forecast to 1.9% in March, fearing an oil shock. It later raised the forecast to 3.9% once AI spending proved stronger than expected. This swing made it hard for AI TIC providers to plan lab hardware purchases and auditor travel.
Tariffs raise the cost of test equipment. The US raised Section 301 tariffs on Chinese semiconductors to 50% in January 2025. AI test labs rely on GPUs, servers, and sensor rigs to run model validation and adversarial testing. Higher chip costs push up the price of building and refreshing these labs, and providers pass part of that cost to clients.
Shipping routes remain weak. UNCTAD found that Suez Canal transits fell to 33 per day, 57% below their peak. Ships rerouting around the Cape of Good Hope add about 10 days per trip. These delays slow delivery of calibration tools, lidar units, and automotive test hardware to labs in Europe and Asia.
Prices rose faster than volumes. The WTO reported that the dollar value of world merchandise trade rose 15% in the first half of 2026, while volume grew only 3.5%. The WTO also expects Middle East imports to fall 15.4% and West Asia exports to drop 17.2% in 2026. Higher energy and component prices raise the cost of compute-heavy AI testing. Lower Gulf trade delays some regional AI certification projects.
Regional Analysis
North America dominates the AI in Testing, Inspection and Certification Market, holding a 38.2% share and generating USD 5.1 billion in revenue. The US drives most of this value. It hosts the top AI model builders, the largest cloud platforms, and the fastest data center build-out in the world.
Asia Pacific is the fastest-growing region in the AI in Testing, Inspection and Certification Market. The WTO expects Asia to lead the world with 9.9% export growth and 9.5% import growth in 2026. China, South Korea, and Japan make most of the world’s AI chips, servers, and smart devices, and every product line needs validation.
Europe holds the second largest position, led by Germany, France, and the UK. The EU AI Act drives demand, with fines of up to EUR 35 million or 7% of global turnover for serious breaches. This pushes firms to buy formal conformity checks. DEKRA became the first accredited certification body for biometric AI systems under the Act.
Key Regions and Countries
North America
- US
- Canada
Europe
- Germany
- France
- The UK
- Spain
- Italy
- Rest of Europe
Asia Pacific
- China
- Japan
- South Korea
- India
- Australia
- Rest of APAC
Latin America
- Brazil
- Mexico
- Rest of Latin America
Middle East and Africa
- GCC
- South Africa
- Rest of MEA
Market Dynamics
Drivers
| Driver | (~) % Impact on CAGR Forecast | Geographic Relevance | Impact Timeline |
|---|---|---|---|
| Enterprise AI adoption expanding inspection automation | +1.1% | Global; strongest in Europe, North America, and East Asia | Short term (2 years or less) |
| Connected production lines enabling inline inspection | +0.8% | China, Germany, Japan, South Korea and United States | Short term (2 years or less) |
| Installed-asset aging increasing condition-assessment workloads | +0.6% | North America, Europe and mature industrial economies | Medium term (2 to 4 years) |
| Electrification increasing component-testing complexity | +0.5% | China, Europe, United States and India | Medium term (2 to 4 years) |
| Existing certificate archives enabling document automation | +0.4% | Global; large multisite testing organizations | Short term (2 years or less) |
Enterprise AI adoption expanding inspection automation
Enterprise adoption expands the customer base able to buy AI-enabled testing, inspection and certification, but it does not directly measure sector revenue. Eurostat reports enterprise AI usage rising from 13.48% in 2024 to 19.95% in 2025, a 6.47-percentage-point increase.
Adoption among large enterprises reached 55.03% in 2025, compared with 17% among small enterprises, which supports an initial commercial focus on large industrial accounts. The +1.1-percentage-point contribution is an analyst scenario assumption against the 17.7% baseline CAGR, not a measured institutional estimate.
The listed contributions total +3.4 points of embedded support, -1.7 points of restraint risk, -1.7 points of operational friction, and +2.2 points of opportunity upside. Adding only the conditional Opportunities implies 19.9%, while applying both downside groups implies 14.3%, rather than adding the Drivers to the baseline again.
Restraints
| Restraint | (~) % Impact on CAGR Forecast | Geographic Relevance | Impact Timeline |
|---|---|---|---|
| Upfront deployment costs blocking smaller buyers | -0.6% | Global; smaller laboratories and emerging-market operators | Short term (2 years or less) |
| Accreditation acceptance gates for unvalidated methods | -0.4% | Global; accredited testing and calibration laboratories | Medium term (2 to 4 years) |
| Customer confidentiality restrictions blocking external processing | -0.3% | Defense, aerospace and proprietary industrial supply chains | Short term (2 years or less) |
| Unexpired incumbent contracts delaying supplier replacement | -0.2% | Global; outsourced enterprise inspection accounts | Short term (2 years or less) |
| Unavailable insurance coverage for autonomous sign-off | -0.2% | Safety-critical and high-liability applications | Medium term (2 to 4 years) |
Upfront deployment costs blocking smaller buyers
The immediate sales barrier is an indivisible deployment bill covering instrument connectivity, computing infrastructure, software configuration and commissioning, set against a smaller buyer’s limited throughput over which to recover it.
Eurostat’s 2025 adoption figures of 17% for small enterprises and 55.03% for large enterprises indicate a 38.03-percentage-point adoption gap, although that gap cannot be attributed exclusively to costs. A buyer accepting a 24-month payback ceiling would reject an otherwise useful deployment with a 36-month payback.
The supplier would need to cut upfront customer expenditure by approximately 33% at unchanged annual savings, or restructure payment timing. This purchase-gate mechanism underpins the modeled -0.6 percentage-point sensitivity. Financing or usage-based contracts can reopen sales, but they shift working-capital requirements and utilization risk toward the provider.
Challenges
| Challenge | (~) % CAGR Friction Drag | Geographic Relevance | Mitigation Horizon |
|---|---|---|---|
| Rare-defect data and drift | -0.6% | Global; safety-critical and variable-production environments | Long term (4 years or more) |
| Hybrid inspection skills shortages | -0.4% | Global; specialist industrial inspection hubs | Medium term (2 to 4 years) |
| Legacy equipment interface fragmentation | -0.3% | Global; brownfield laboratories and factories | Medium term (2 to 4 years) |
| Adversarial manipulation of evidence | -0.2% | Global; remotely supplied inspection evidence | Long term (4 years or more) |
| Multisite rollout coordination complexity | -0.2% | Global; multinational inspection networks | Medium term (2 to 4 years) |
Rare-defect data and drift
Rare safety-relevant defects create a structural learning problem. Large image archives can still contain too few representative failures, while changes in lighting, materials, or production conditions erode performance after deployment. NIST’s discussion of AI-specific risks explicitly identifies unavailable ground truth, unrepresentative data, and maintenance needs arising from data, model, or concept drift.
To illustrate the quantitative friction, an analyst sampling scenario with a true defect frequency of 0.1% produces approximately 100 defect examples from 100,000 inspected units. Observing 0 misses across 100 independent, representative defective examples would still leave an approximate 95% upper confidence bound of 3% on the miss rate, which falls short of proving zero risk.
The modeled -0.6 percentage-point drag therefore reflects continuing data curation, targeted defect collection, shadow testing and selective human review rather than a ban on current sales. It favors providers that retain model-maintenance capacity and price exception handling into service contracts.
Opportunities
| Opportunity | (~) % Potential CAGR Upside | Geographic Relevance | Execution Window |
|---|---|---|---|
| Digital product passport evidence-assurance subscriptions | +0.7% | European Union and exporting supply chains | Medium term (2 to 4 years) |
| Independent assurance of AI systems | +0.5% | Global; enterprise and public-sector procurement | Medium term (2 to 4 years) |
| Second-life asset grading marketplaces | +0.4% | Europe, East Asia and North America | Medium term (2 to 4 years) |
| Parametric insurance verification partnerships | +0.3% | Global; infrastructure and industrial insurance | Long term (4 years or more) |
| White-label platforms for regional laboratories | +0.3% | India, Southeast Asia, Latin America and Africa | Medium term (2 to 4 years) |
Digital product passport evidence-assurance subscriptions
The white space is an independently verified, continuously updated evidence layer attached to product passports, rather than simply creating passport records or assuming every passport needs third-party certification.
Under an illustrative analyst operating model, which is not a Commission forecast, reusing authenticated supplier evidence and automating consistency checks could reduce review effort per passport update by 20%–30%. If review labor represents 40% of revenue and pricing stays unchanged, that translates into an 8–12 percentage-point gross-margin improvement before platform, assurance, and customer-acquisition costs.
The +0.7 percentage-point conditional upside assumes deliberate investment in supplier onboarding, interoperable evidence records and recurring update contracts. Capture remains contingent on actual product rules and on whether buyers are willing to purchase independent verification beyond minimum disclosure obligations.
Key Players Analysis
SGS SA leads Tier 1. It posted record 2025 sales of CHF 6,945 million with 5.6% organic growth. Its adjusted operating income hit CHF 1,108 million, a 16.0% margin, and free cash flow reached CHF 841 million. This cash funds its digital trust and AI assurance services.
Bureau Veritas SA ranks a close second in Tier 1. It earned EUR 6,466.4 million in 2025, with 6.5% organic growth and adjusted operating profit of EUR 1,052.9 million. It closed 9 bolt-on deals that add about EUR 96 million in yearly revenue, and it spent EUR 162 million on acquisitions. Its Certification division posted an 18.2% margin.
The German testing groups round out Tier 1. DEKRA SE grew revenue 3.4% to EUR 4.4 billion in 2025 and expanded its Digital Trust services, which combine cybersecurity, functional safety, and AI validation. TÜV SÜD AG reported revenue of EUR 3,639.2 million, up from EUR 3,429.0 million a year earlier.
UL Solutions Inc. leads Tier 2. Its 2025 revenue rose 6.4% to USD 3,053 million, and adjusted net income climbed 17.2% to USD 423 million. Intertek Group plc earned GBP 3,432 million, with its Consumer Products business delivering GBP 983.4 million. TÜV Rheinland, DNV, Eurofins, Applus+, ALS, Kiwa, and Lloyd’s Register compete through strong niche positions in industry, energy, marine, and lab testing.
Top Key Players in the Market
- SGS SA
- Bureau Veritas SA
- DEKRA SE
- TÜV SÜD AG
- TÜV Rheinland AG
- UL Solutions Inc.
- DNV AS
- Intertek Group plc
- Eurofins Scientific SE
- Applus+ Services SA
- ALS Limited
- Kiwa NV
- Lloyd’s Register Group Limited
Recent Developments
- In July 2025, SGS SA signed a deal to buy Applied Technical Services, a North American testing and calibration provider, at an enterprise value of USD 1,325 million, adding about USD 460 million in expected 2026 sales.
- In April 2026, Bureau Veritas SA agreed to buy LotusWorks, an Irish provider of quality assurance for data centers and chip plants, at an enterprise value of EUR 375 million, adding EUR 131 million in revenue and 750 staff.
- In April 2026, DEKRA SE reported EUR 127 million in total 2025 investments, including close to EUR 40 million in Germany, as it expanded AI validation and EU AI Act-accredited certification.
Report Scope
| Report Features | Description |
|---|---|
| Market Value (2025) | USD 13.2 billion |
| Forecast Revenue (2035) | USD 67.3 billion |
| CAGR (2026-2035) | 17.7% |
| Base Year for Estimation | 2025 |
| Historic Period | 2020-2024 |
| Forecast Period | 2026-2035 |
| Report Coverage | Revenue Forecast, Market Dynamics, Competitive Landscape, Recent Developments |
| Segments Covered | By Deployment (Testing Services, Certification Services, Inspection Services); By Sourcing Type (In-House AI Assurance, Outsourced AI TIC Services); By Application (AI System Testing and Validation, Cybersecurity and Adversarial Testing, Algorithmic Risk and Bias Assessment, Data Quality and Dataset Validation, Functional Safety and Reliability Assurance, Other); By End-User Industry (ICT and Telecom, Automotive and Transportation, Industrial Manufacturing and Machinery, Life Sciences and Healthcare, Energy and Utilities, Aerospace and Defense, Consumer Goods and Retail, Food, Agriculture and Beverage, Other) |
| Regional Analysis | North America – US, Canada; Europe – Germany, France, The UK, Spain, Italy, Rest of Europe; Asia Pacific – China, Japan, South Korea, India, Australia, Singapore, Rest of APAC; Latin America – Brazil, Mexico, Rest of Latin America; Middle East & Africa – GCC, South Africa, Rest of MEA |
| Competitive Landscape | SGS SA, Bureau Veritas SA, DEKRA SE, TÜV SÜD AG, TÜV Rheinland AG, UL Solutions Inc., DNV AS, Intertek Group plc, Eurofins Scientific SE, Applus+ Services SA, ALS Limited, Kiwa NV, Lloyd’s Register Group Limited |
| Customization Scope | Customization for segments and region/country-level will be provided. Moreover, additional customization can be done based on the requirements. |
| Purchase Options | We have three licenses to opt for: Single User License, Multi-User License (Up to 5 Users), Corporate Use License (Unlimited Users and Printable PDF) |





























