


Report Overview
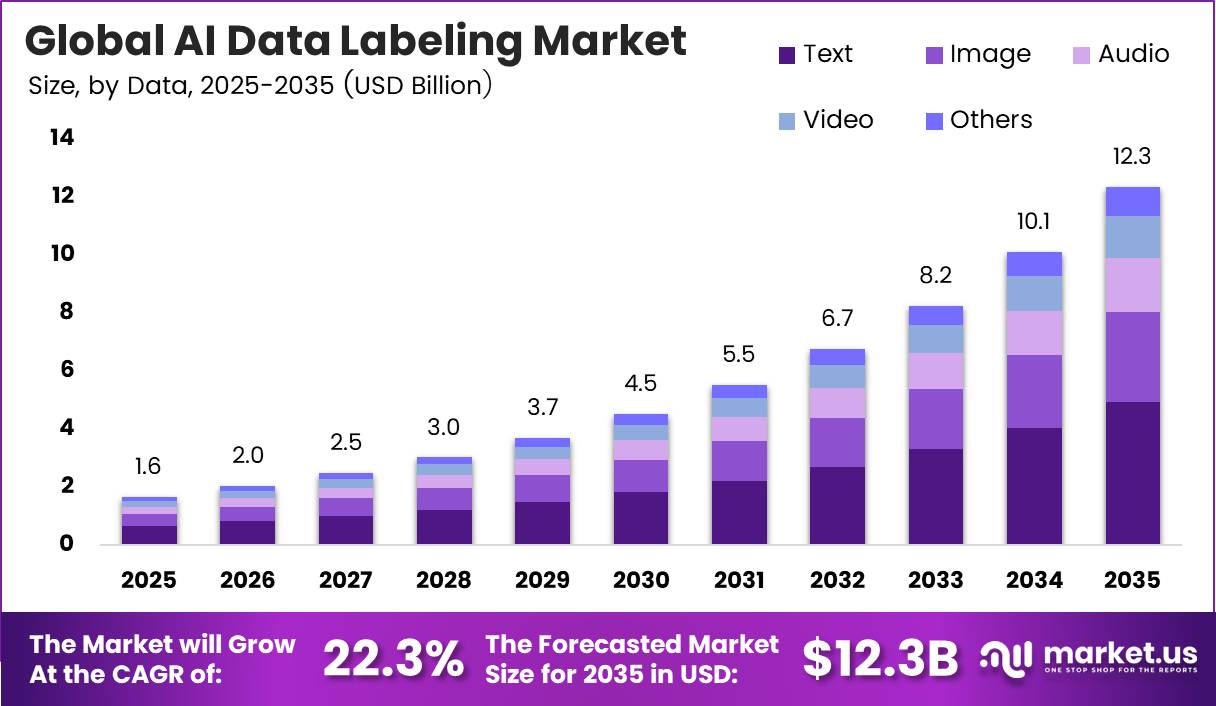
In 2025, the Global AI Data Labeling Market was valued at USD 1.6 billion. The market is projected to grow at a 22.3% CAGR during 2026–2035, reaching about USD 12.3 billion by 2035. North America dominated the global market in 2025, accounting for more than 34.7% of the total market share and generating approximately USD 0.6 billion in revenue.
Growth starts with the rise of digital users. According to the ITU, about 6 billion people used the internet in 2025, up from 5.8 billion in 2024. That adds more than 240 million new users in a single year. Each new user creates text, photos, voice notes and video. AI developers must clean and label this raw data before their models can learn from it. Compute demand tells the same story.
The IEA reported that data centres used about 415 TWh of power in 2024, close to 1.5% of world electricity. It expects this figure to more than double to about 945 TWh by 2030, with AI driving most of the rise. More compute needs larger and better training datasets, so every new model and every model update pulls more labeling work into the market.
North America region is home to most of the large AI model builders, and they are the biggest buyers of labeled data. The IEA estimates that the United States accounted for about 45% of global data centre power use in 2024. Public policy adds to this lead.
The US CHIPS and Science Act authorizes about USD 280 billion for chips and research, and that research covers AI, quantum computing, and robotics. Meta’s 2025 investor guidance set capital spending at USD 66 to 72 billion, and much of it goes to AI infrastructure that needs a steady supply of labeled data.
Key Takeaways
- The AI Data Labeling Market was valued at USD 1.6 billion in 2025 and will reach USD 12.3 billion by 2035. The market will grow at a CAGR of 22.3% from 2026 to 2035.
- By sourcing type, Outsourced led with a 54.8% share in 2025.
- By data, Text led with a 27.3% share in 2025.
- By labeling method, Manual led with a 78.1% share in 2025.
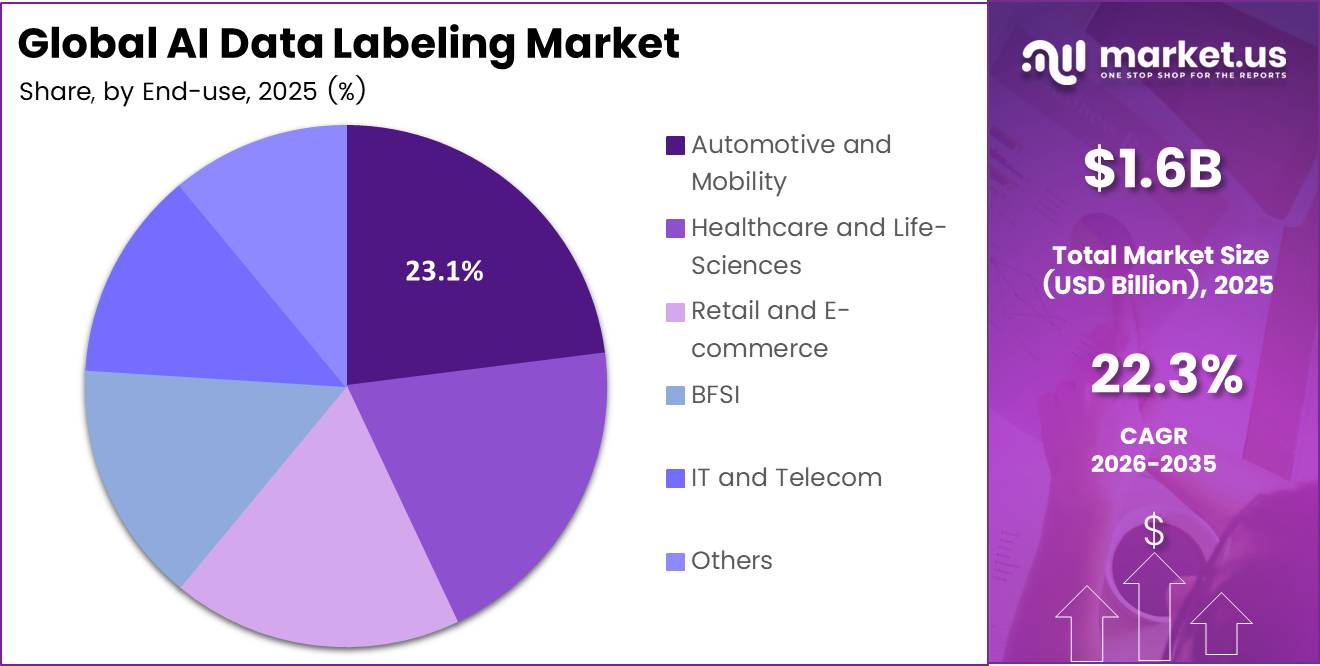
- By end-user industry, Automotive and Mobility led with a 23.1% share in 2025.
- North America led the market with a 34.7% share and USD 0.6 billion in revenue in 2025.
By Sourcing Type
Outsourced dominates with 54.8% due to a ready global workforce at scale.
Outsourced sourcing leads because most AI builders want large, trained labeling teams without hiring them full-time. Appen, a listed data partner, earned $234.3 million in operating revenue in 2024 by collecting, labeling, and checking data for clients. It now works with 26 large language model builders around the world. That shows how top AI labs hand this work to specialists instead of building big teams of their own.
Vendors also give buyers speed and flexible capacity. Appen ran its business with 835 full-time equivalent staff and 1,171 total employees, and it relies on a much larger crowd of contributors across North America, Asia Pacific, the UK, Europe, and Australia. This model lets clients start projects quickly, cover many languages, and pay only for the volume they use.
By Data
Text dominates with 27.3% due to large language model training demand.
Text holds the largest share because every chatbot, search tool, and writing assistant learns from labeled written content. Online activity keeps producing that content. ITU estimates that about 6 billion people used the internet in 2025, up from 5.8 billion in 2024. Each new user adds posts, reviews, messages, and support tickets that firms must sort, tag, and rate.
Fresh demand also comes from new users. ITU reports that the world’s online population grew by more than 240 million people in 2025, and many of them write in local languages that models still handle poorly. Developers need labeled text in these languages to cover new markets. That keeps text work in steady demand for safety reviews, ranking tasks, and translation checks.
Audio is the fastest-growing data type as voice assistants move to generative AI. Amazon says it has sold more than 600 million Alexa-enabled devices since 2014. More than 1 million customers had access to the new Alexa+ by June 2025. Voice models need labeled speech, accents, tone, and background noise to work well, so demand for audio transcription and tagging is rising quickly.
By Labeling Method
Manual dominates with 78.1% due to human judgment for complex edge cases.
Manual labeling leads because many AI tasks still need human judgment. People rank chatbot answers, flag harmful content, and mark unclear images far better than software can today. Appen’s generative AI revenue grew 601% in FY2024, and most of that work relies on human raters who check model outputs for accuracy, tone, and safety.
This human-led work has become a core revenue source. Generative AI made up 22% of Appen’s revenue in FY2024, up from just 4% in FY2023. Excluding one major lost client, operating revenue grew 16.0% to $220.9 million, mainly due to these projects. Buyers pay for skilled reviewers because a single labeling error can spread across a whole model.
By End-user Industry
Automotive and Mobility dominates with 23.1% due to sensor-heavy autonomous driving data needs.
Automotive and Mobility leads because self-driving systems need large volumes of labeled camera, lidar, and radar data. Waymo, Alphabet’s robotaxi unit, reached 100 million fully autonomous miles by July 2025. Every mile produces scenes of cars, people, signs, and lanes, and teams must tag them so the system learns to drive safely.
Commercial scale-up keeps this demand high. Waymo provided about 15 million paid rides in 2025, nearly 3 times the year before. It now logs roughly 400,000 rides each week and is aiming for 1 million weekly rides. Each new city adds new road layouts and weather, which calls for fresh labeled data.
Healthcare and Life Sciences is the fastest-growing industry as AI enters clinical use. A study of the FDA’s AI-enabled device list found 1,430 authorizations through 2025, including 331 in 2025 alone. Radiology accounted for 76.5% of them. Each device needs scans that expert clinicians have labeled, which pushes up demand for accurate, compliant medical annotation.
Key Market Segments
By Sourcing Type
- In-house
- Outsourced
By Data
- Text
- Image
- Audio
- Video
- Others
By Labeling Method
- Manual
- Automatic
By End-user Industry
- Automotive and Mobility
- Healthcare and Life Sciences
- Retail and E-commerce
- BFSI
- IT and Telecom
- Others
Geopolitical Impact Analysis
Trade friction between the US and China raises the cost of the hardware behind labeling platforms. The US raised Section 301 tariffs on Chinese semiconductors from 25% to 50% in 2025. Labeling firms run AI-assisted tools on GPU servers, and vendors in the automotive segment also buy sensor rigs, cameras, and LiDAR units. Higher chip tariffs push up the cost of these tools.
Shipping disruption slows hardware delivery to labeling hubs in India, Kenya and Europe. UNCTAD reported that container tonnage crossing the Suez Canal fell by 82% by February 2024. A round trip between India and Europe can stretch from 56 to 63 days, and that extra time requires 1 more vessel per service loop. The IMF PortWatch platform showed Suez transit volume down 37% year on year in early 2024.
The Red Sea crisis also changed overall trade volumes. UNCTAD found that ship capacity arriving at the Cape of Good Hope rose 89% by mid-2024. Ship tonnage through the Gulf of Aden fell 76% compared to late 2023. Longer routes burn more fuel, and higher fuel costs feed into the freight rates that labeling vendors pay to import hardware.
Power prices add another layer. The IEA links energy security risk to data centre costs. Labeling vendors pay for the cloud compute that runs annotation software and model-assisted review. When energy costs rise, platform fees rise too. Buyers then move more work to outsourced vendors in lower-cost countries, which supports the outsourced share of the market.
Regional Analysis
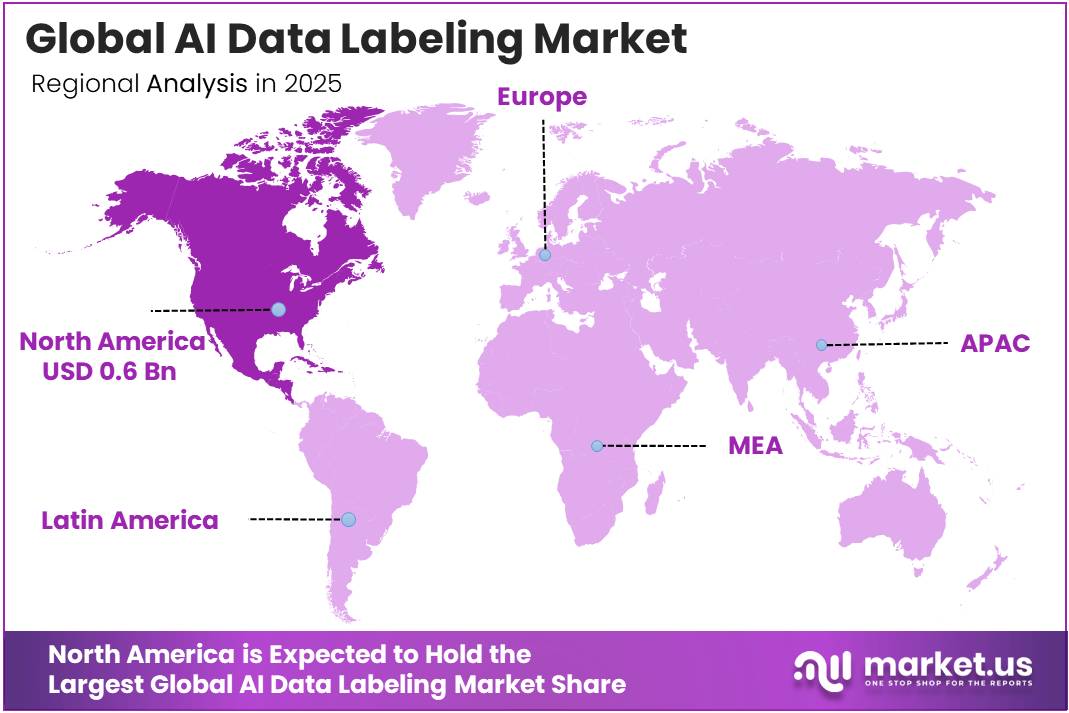
North America dominates the AI Data Labeling Market, holding a 34.7% share and generating USD 0.6 billion in revenue. The US hosts the biggest buyers of training data. Microsoft planned to spend about USD 80 billion on AI-enabled data centres in FY2025 and put more than half of that in the US. Alphabet guided about USD 75 billion in capital spending for 2025.
The U.S. vendors also lead on tools. Platforms such as Labelbox and Scale AI sell software and managed services to model builders around the world. This mix of capital, buyers, and vendors keeps North America ahead over the forecast period.
Asia Pacific is the fastest-growing region in the AI Data Labeling Market. India’s IndiaAI Mission has an outlay of INR 10,371.92 crore. It funds shared compute with more than 34,000 GPUs. India also supplies a large share of the world’s labeling workforce through firms such as iMerit and Cogito. China plans to grow its core AI industry to RMB 1 trillion by 2030.
Europe holds a strong second position, and regulation shapes its demand. The EU AI Act entered into force in August 2024. Rules for general-purpose AI models began to apply in August 2025. Fines can reach 7% of global turnover or EUR 35 million. These rules push firms to document training data quality, bias checks, and data sources.
Key Regions and Countries
North America
- US
- Canada
Europe
- Germany
- France
- The UK
- Spain
- Italy
- Rest of Europe
Asia Pacific
- China
- Japan
- South Korea
- India
- Australia
- Rest of APAC
Latin America
- Brazil
- Mexico
- Rest of Latin America
Middle East and Africa
- GCC
- South Africa
- Rest of MEA
Market Dynamics
Drivers
| Driver | (~) % Impact on CAGR Forecast | Geographic Relevance | Impact Timeline |
|---|---|---|---|
| Frontier-Model Dataset Scaling | +1.7% | Global, led by North America and East Asia | Short term (2 years or less) |
| Enterprise AI Adoption | +1.2% | North America, Europe, and developed Asia-Pacific | Short term (2 years or less) |
| Continuous Human Feedback | +1.0% | Global technology ecosystems | Short term (2 years or less) |
| Autonomous-System Data Growth | +0.8% | United States, China, Germany, Japan and South Korea | Medium term (2 to 4 years) |
| Clinical AI Pipelines | +0.6% | North America, Europe and developed Asia-Pacific | Medium term (2 to 4 years) |
| Content Safety Localization | +0.5% | Global multilingual markets | Short term (2 years or less) |
Frontier-Model Dataset Scaling
Stanford HAI reported in 2025 that notable-model training compute was doubling approximately every 5 months, large-language-model dataset size every 8 months, and training power requirements annually, while inference cost for a fixed capability level fell more than 280-fold between late 2022 and late 2024, widening the population of economically viable AI applications.
The OECD subsequently measured enterprise AI use rising from 8.7% in 2023 to 14.2% in 2024 and 20.2% in 2025, while the ILO identified data annotation, engineering and machine-learning modelling as areas of new employment demand.
Those milestones support a modeled +1.7% incremental contribution to the 22.3% baseline CAGR, with vendors shifting from one-off per-record contracts toward recurring managed-data pipelines; sustained workflow utilization could improve by an estimated 10% to 15% and expand gross margins by approximately 2 to 4 percentage points where automated pre-labeling is combined with human verification.
Restraints
| Restraint | (~) % Impact on CAGR Forecast | Geographic Relevance | Impact Timeline |
|---|---|---|---|
| Privacy and Residency Barriers | -1.1% | Europe, China, India and regulated global industries | Short term (2 years or less) |
| Copyright Clearance Uncertainty | -0.7% | United States, Europe and media-intensive markets | Short term (2 years or less) |
| Customer Platform Insourcing | -0.5% | North America, China and large technology hubs | Medium term (2 to 4 years) |
| Startup Funding Selectivity | -0.4% | North America, Europe and venture-led Asian markets | Short term (2 years or less) |
| Platform Labor Regulation | -0.3% | Europe, India, Kenya and the Philippines | Medium term (2 to 4 years) |
| Enterprise Procurement Gates | -0.2% | Global regulated enterprises | Short term (2 years or less) |
Privacy and Residency Barriers
The immediate constraint is that sensitive personal, biometric, and clinical records often cannot be transferred into globally distributed annotation workflows without a defensible processing basis, regional storage, and tightly documented processor controls.
GDPR provisions expose serious violations to penalties of up to €20 million or 4% of worldwide annual turnover and generally require notification of qualifying breaches within 72 hours, while the European Commission’s AI Act guidance requires governance over data origin, annotation, labeling, cleaning, representativeness and bias mitigation for high-risk systems.
These obligations can extend secure-vendor onboarding by an estimated 3 to 6 months, absorb approximately 8% to 12% of contract value in compliance, infrastructure and audit costs, and produce a modeled -1.1% CAGR deduction as smaller projects are delayed, localized or cancelled, compressing supplier margins by roughly 2 to 5 percentage points.
Challenges
| Challenge | (~) % CAGR Friction Drag | Geographic Relevance | Mitigation Horizon |
|---|---|---|---|
| Inter-Annotator Consistency | -0.9% | Global, especially regulated applications | Medium term (2 to 4 years) |
| Domain Expert Scarcity | -0.6% | North America, Europe and specialist talent hubs | Long term (4 years or more) |
| Automation Quality Trade-Offs | -0.5% | Global high-volume labeling operations | Medium term (2 to 4 years) |
| Annotator Workforce Attrition | -0.3% | India, Africa, Southeast Asia and Latin America | Medium term (2 to 4 years) |
| Ontology Version Drift | -0.3% | Global multimodal AI programs | Long term (4 years or more) |
| Adversarial Data Poisoning | -0.2% | Global critical infrastructure and public-sector systems | Long term (4 years or more) |
Inter-Annotator Consistency
Label ambiguity becomes structurally harder to control as projects add languages, modalities, edge cases, and specialist reviewers: NIST separates AI bias into 3 broad categories, and its generative-AI risk profile encompasses 13 risks and more than 400 possible risk-management actions, demonstrating how quality control extends beyond simple class accuracy.
WHO frames health-data quality through 10 dimensions and recommends rigorous pre-release evaluation, while the European Commission requires high-risk datasets to be relevant, representative, as error-free as possible, and appropriate to their geographic and functional context.
Without common ontologies, blind overlap testing and senior adjudication, disagreement-driven relabeling can consume an estimated 8% to 15% of production capacity, reduce first-pass acceptance by 5 to 10 percentage points and create a modeled -0.9% drag on achievable CAGR.
Suppliers therefore need persistent gold-standard sets, calibrated reviewer scoring, version-controlled instructions and automated drift detection, even though these controls can compress near-term operating margins by approximately 2 to 4 percentage points.
Opportunities
| Opportunity | (~) % Potential CAGR Upside | Geographic Relevance | Execution Window |
|---|---|---|---|
| Audit-Ready Regulatory Evidence | +1.1% | Europe with global regulated-market spillover | Medium term (2 to 4 years) |
| Low-Resource Language Data | +0.8% | India, Africa, Southeast Asia and Latin America | Medium term (2 to 4 years) |
| SME Self-Service Platforms | +0.7% | Global small and mid-sized enterprises | Medium term (2 to 4 years) |
| Agricultural Geospatial Curation | +0.5% | Asia-Pacific, Africa and Latin America | Long term (4 years or more) |
| Scientific AI Curation | +0.4% | North America, Europe and East Asia | Long term (4 years or more) |
| Specialist M&A Roll-Ups | +0.4% | North America, Europe and fragmented Asian markets | Medium term (2 to 4 years) |
Audit-Ready Regulatory Evidence
This remains future white space rather than a current driver because many high-risk AI obligations have not yet reached their principal application dates: the European Commission’s implementation timeline places major standalone high-risk requirements in December 2027 and product-integrated requirements in August 2028, while national AI regulatory sandboxes are scheduled to become operational by August 2027.
Packaging lineage records, annotator qualifications, disagreement logs, bias tests and immutable audit trails could command an estimated 15% to 25% realization premium over basic labeling, reduce customer audit-preparation effort by approximately 20% to 30%, expand provider gross margins by 4 to 7 percentage points and add up to +1.1% to the baseline CAGR if suppliers establish reusable compliance schemas before regulated procurement accelerates.
Key Players Analysis
Scale AI Inc. leads Tier 1. In June 2025, Meta invested USD 14.3 billion for a 49% non-voting stake in the company, which valued Scale AI at about USD 29 billion. Scale AI earned about USD 870 million in revenue in 2024. The deal moved founder Alexandr Wang to Meta, and Scale AI then cut about 14% of its staff to refocus its data business.
iMerit Technologies Pvt Ltd also sits in Tier 1 after a major exit. In June 2026, ExlService Holdings agreed to buy iMerit for up to USD 310 million. That total includes USD 170 million paid upfront and USD 140 million in earnouts over 2 years. EXL reported about USD 1.84 billion in revenue in 2024, which gives iMerit a much larger enterprise sales channel.
SuperAnnotate Ltd leads the Tier 2 challengers on recent funding. In July 2025, it raised USD 13.5 million from Dell Technologies Capital, which brought its Series B total to USD 50 million. Labelbox Inc, Dataloop AI Ltd and BasicAI Inc compete as software-first platforms with AI-assisted labeling tools.
CloudFactory Ltd, Sama Inc and Cogito Tech LLC compete on managed workforce services in Asia and Africa. Explosion AI GmbH (Prodigy) and Deep Systems LLC serve technical teams that label data in-house. These firms are private and publish few financial figures.
Top Key Players in the Market
- Scale AI Inc
- CloudFactory Ltd
- Sama Inc
- iMerit Technologies Pvt Ltd
- Cogito Tech LLC
- Labelbox Inc
- SuperAnnotate Ltd
- Explosion AI GmbH (Prodigy)
- Deep Systems LLC
- BasicAI Inc
- Dataloop AI Ltd
Recent Developments
- In June 2025, Meta Platforms completed a USD 14.3 billion investment in Scale AI for a 49% stake, which valued the company at about USD 29 billion.
- In July 2025, Scale AI cut about 14% of its staff in its data labeling business to restructure after the Meta deal.
- In July 2025, SuperAnnotate raised USD 13.5 million from Dell Technologies Capital and lifted its Series B total to USD 50 million.
- In June 2026, ExlService Holdings signed a definitive agreement to acquire iMerit for up to USD 310 million, which includes USD 170 million upfront.
Report Scope
| Report Features | Description |
|---|---|
| Market Value (2025) | USD 1.6 Billion |
| Forecast Revenue (2035) | USD 12.3 Billion |
| CAGR (2026-2035) | 22.3% |
| Base Year for Estimation | 2025 |
| Historic Period | 2020-2024 |
| Forecast Period | 2026-2035 |
| Report Coverage | Revenue Forecast, Market Dynamics, Competitive Landscape, Recent Developments |
| Segments Covered | By Sourcing Type (In-house, Outsourced); By Data (Text, Image, Audio, Video, Others); By Labeling Method (Manual, Automatic); By End-user Industry (Automotive and Mobility, Healthcare and Life Sciences, Retail and E-commerce, BFSI, IT and Telecom, Others) |
| Regional Analysis | North America – US, Canada; Europe – Germany, France, The UK, Spain, Italy, Rest of Europe; Asia Pacific – China, Japan, South Korea, India, Australia, Singapore, Rest of APAC; Latin America – Brazil, Mexico, Rest of Latin America; Middle East & Africa – GCC, South Africa, Rest of MEA |
| Competitive Landscape | Scale AI Inc, CloudFactory Ltd, Sama Inc, iMerit Technologies Pvt Ltd, Cogito Tech LLC, Labelbox Inc, SuperAnnotate Ltd, Explosion AI GmbH (Prodigy), Deep Systems LLC, BasicAI Inc, Dataloop AI Ltd |
| Customization Scope | Customization for segments, region/country-level will be provided. Moreover, additional customization can be done based on the requirements. |
| Purchase Options | We have three licenses to opt for: Single User License, Multi-User License (Up to 5 Users), Corporate Use License (Unlimited Users and Printable PDF) |





























