


Report Overview
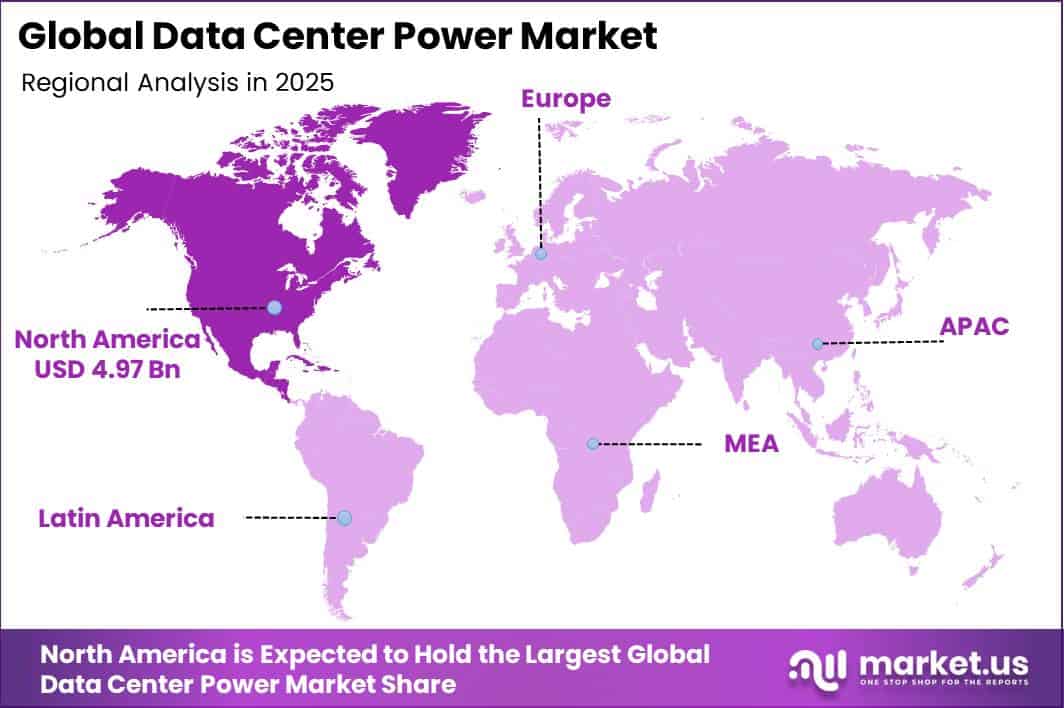
In 2025, the Global Data Center Power Market was valued at USD 13.4 billion. The market is projected to grow at a CAGR of 7.9% during 2026–2035, reaching approximately USD 28.6 billion by 2035. North America dominated the global market in 2025, accounting for more than 37.1% of the total market share and generating approximately USD 4.9 billion in revenue.
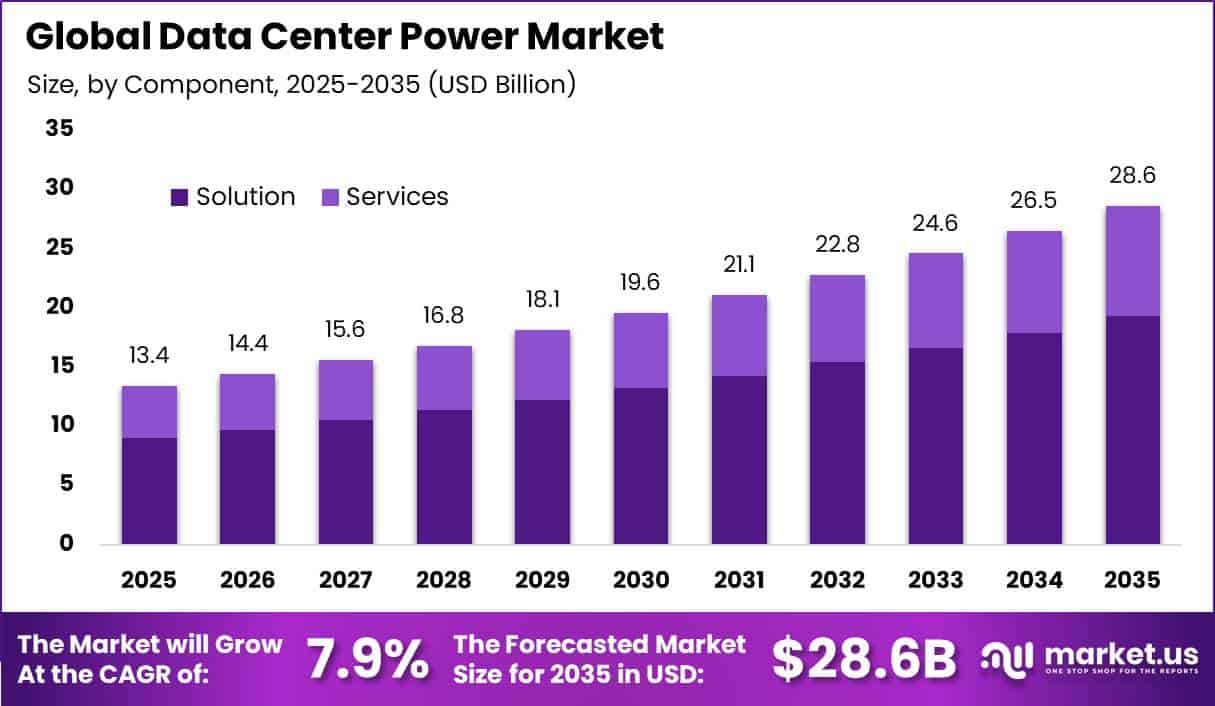
Market growth is mainly driven by rising electricity demand from AI, cloud computing, digital storage, and online services. According to the IEA, global data centers consumed around 415 TWh of electricity in 2024, representing 1.5% of global electricity use. Consumption is expected to reach about 945 TWh by 2030, adding nearly 530 TWh and more than doubling from the 2024 level.
AI-related data-center electricity demand alone is expected to increase by more than 4 times by 2030. This is increasing demand for UPS systems, batteries, generators, transformers, switchgear, PDUs, and power-monitoring equipment. U.S. data centers consumed approximately 176 TWh in 2023, accounting for 4.4% of national electricity use and exceeding the 70 TWh recorded in 2014 by more than 2.5 times.
Consumption could rise to 325–580 TWh by 2028, adding 149–404 TWh within 5 years. At 50% average capacity use, data-center power demand could reach 74–132 GW, while its share of U.S. electricity consumption may increase to 6.7%–12.0% by 2028, supporting continued investment in reliable and efficient power infrastructure.
Key Takeaway
- Data Center Power Market is valued at USD 13.4 billion in 2025, projected to reach USD 28.6 billion by 2035 at a 7.9% CAGR.
- The Solution segment was led by Component with a 67.5% share, driven by rising per-site electrical loads.
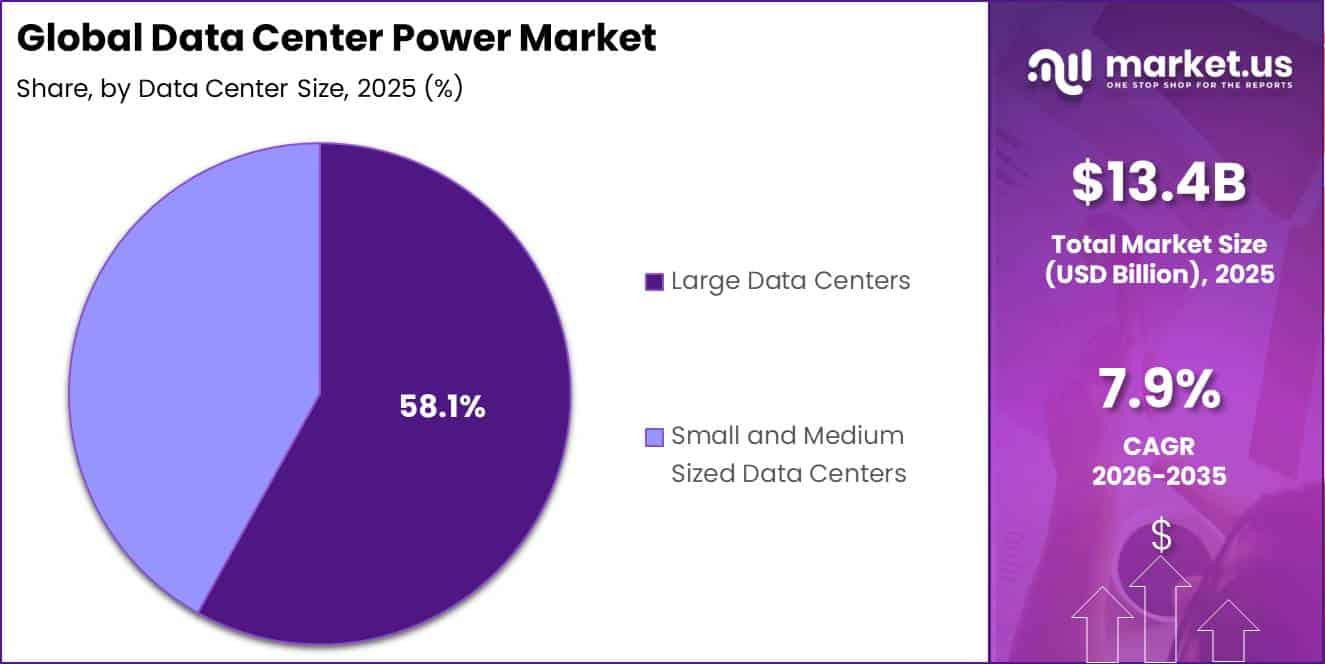
- Large Data Centers dominated with a 58.1% share, driven by higher power loads and greater need for advanced electrical infrastructure.
- BFSI led with a 24.3% share, supported by continuous transaction processing and strict requirements for reliable, uninterrupted data-center operations.
- North America led with a 37.1% share, generating about USD 4.9 billion in revenue in 2025.
By Component
The Solution segment held a dominant 67.5% share because physical power equipment must expand directly with rising data-center electricity loads. According to FERC, more than 50 GW of data-center capacity was operating in the U.S. by the end of 2025, representing a 24% CAGR since 2020.
The average size of new facilities also increased from around 25 MW in 2020 to nearly 80 MW in 2025, meaning the electrical load per new site more than tripled. The World Bank also reported that the number of hyperscale facilities more than tripled since 2015, reaching about 900 sites and representing 37% of global capacity in 2023.
Hyperscale-market revenue is projected to increase from USD 80 billion in 2022 to USD 935 billion by 2032. Since hyperscale data centers operate with very large and dense power requirements, their rapid expansion creates stronger demand for power hardware than for consulting or maintenance services, supporting the continued leadership of the Solution segment.
By Data Center Size
Large Data Centers held a dominant 58.1% share of the Data Center Power Market, mainly because larger facilities require much more electrical infrastructure for each site. According to FERC, operating U.S. data-center capacity exceeded 50 GW at the end of 2025, following a 24% compound annual growth rate since 2020.
The average capacity of new data centers also increased from about 25 MW in 2020 to nearly 80 MW in 2025, showing the rapid rise in power demand per facility. Large sites therefore require multiple UPS systems, backup generators, transformers, battery banks, switchgear, and power distribution equipment to maintain continuous and reliable operations.
The World Bank reported that hyperscale data centers reached around 900 facilities in 2023 and represented approximately 37% of global data-center capacity. Their combined capacity is expected to nearly triple by 2028.
By Industry Vertical
The BFSI segment held a leading 24.3% share of the Data Center Power Market because banks, payment companies, insurers, trading platforms, and fraud-monitoring systems require continuous and highly reliable data-center operations. According to the U.S. Federal Reserve, noncash payments reached 236.6 billion transactions in 2024, increasing by 31.9 billion from 2021, while their total value rose to USD 140.01 trillion.
Automated Clearing House transfers alone accounted for USD 104.06 trillion, representing about 74% of total noncash payment value. Processing transactions at this scale requires strong backup power infrastructure, including UPS systems, batteries, generators, switchgear, and power distribution equipment.
Globally, the World Bank reported that 79% of adults had a financial account in 2024, compared with 51% in 2011, showing the continued expansion of digital financial services. As more consumers and businesses depend on online banking, digital payments, card approvals, and trading platforms, financial institutions need data centers with very high uptime.
Key Market Segments
By Component
- Solution
- Power Distribution
- Cabling Infrastructure
- Power Backup
- Power Monitoring
- Services
By Data Center Size
- Large Data Centers
- Small and Medium Sized Data Centers
By Industry Vertical
- IT and Telecommunication
- BFSI
- Retail
- Manufacturing
- Healthcare
- Government
- Other
Geopolitical Impact Analysis
Geopolitical disruptions are increasing both costs and delivery risks across the Data Center Power Market. UPS systems, switchgear, transformers, PDUs, generators, batteries, and cabling depend heavily on copper, aluminum, steel, power electronics, and international shipping. UNCTAD reported that Suez Canal ship tonnage in early May 2025 remained 70% below its 2023 average as vessels continued to avoid the Red Sea.
Shipping rerouting increased the average maritime voyage distance from 4,831 miles in 2018 to 5,245 miles in 2024, while the Shanghai Containerized Freight Index averaged 2,496 points in 2024, around 149% above 2023. These conditions raise freight, fuel, insurance, and inventory costs while extending delivery times for critical data-center electrical equipment.
Energy and metal-price volatility is creating additional pressure on manufacturers and operators. The World Bank expects energy prices to rise 24% in 2026, with Brent crude averaging around USD 86 per barrel, compared with USD 69 in 2025. Copper, aluminum, and tin prices are also expected to reach record levels as demand from data centers and other electrical applications expands.
Copper is particularly important for transformers, busbars, cables, and electrical connections. At the same time, FERC reported a 67% year-on-year increase in Henry Hub natural-gas prices in 2025 and a 26% nationwide rise in wholesale electricity prices.
Regional Analysis
North America led the Data Center Power Market in 2025, accounting for a 37.1% revenue share valued at approximately USD 4.9 billion. The region benefits from a large concentration of hyperscale cloud, AI, colocation, and financial-services data centers that require reliable, high-capacity power infrastructure. According to the IEA, U.S. data-center electricity consumption is expected to increase by around 240 TWh, or 130%, between 2024 and 2030.
Data centers could represent almost 50% of total U.S. electricity-demand growth during this period. This expansion is increasing investment in UPS systems, battery storage, generators, transformers, switchgear, busways, PDUs, and power-monitoring equipment.
Asia Pacific is expected to be the fastest-growing regional market as cloud computing, AI infrastructure, and digital services expand rapidly. The IEA projects China’s data-center electricity demand to increase by about 175 TWh, or 170%, between 2024 and 2030, while Japan could add around 15 TWh, representing an 80% increase.
Southeast Asian data-center electricity demand is also expected to more than double by 2030. Singapore already has more than 1.4 GW of data-center capacity and has provisionally allocated an additional 200 MW to 4 operators. These capacity additions are creating strong demand for scalable and resilient power systems across Asia Pacific.
Key Regions and Countries
North America
- US
- Canada
Europe
- Germany
- France
- The UK
- Spain
- Italy
- Rest of Europe
Asia Pacific
- China
- Japan
- South Korea
- India
- Australia
- Rest of APAC
Latin America
- Brazil
- Mexico
- Rest of Latin America
Middle East & Africa
- GCC
- South Africa
- Rest of MEA
Market Dynamics
Drivers
| Driver | (~) % CAGR | Geographic Relevance | Impact Timeline |
|---|---|---|---|
| AI compute density growth | +2.2% | Global | Short term (2 years or less) |
| Hyperscale capacity additions | +1.5% | North America, China, Europe | Medium term (2 to 4 years) |
| Enterprise cloud migration | +1.0% | Global | Medium term (2 to 4 years) |
| Uptime compliance demand | +0.7% | North America, Europe, Asia Pacific | Short term (2 years or less) |
| Grid resilience upgrades | +0.5% | North America, Europe | Medium term (2 to 4 years) |
AI compute density growth
U.S. data centers consumed around 176 TWh in 2023 and could reach 325–580 TWh by 2028, according to Lawrence Berkeley National Laboratory. FERC also reported that average U.S. data-center size increased from about 25 MW in 2020 to nearly 80 MW in 2025. This expansion is increasing demand for UPS systems, switchgear, busways, batteries, and power controls, contributing an estimated +2.2% upside to the 7.9% baseline CAGR.
Restraints
| Restraint | (~) % CAGR | Geographic Relevance | Impact Timeline |
|---|---|---|---|
| Utility interconnection delays | -1.8% | North America, Europe | Medium term (2 to 4 years) |
| High financing costs | -1.0% | Global | Short term (2 years or less) |
| Local power-use limits | -0.8% | Europe, Singapore, Ireland | Medium term (2 to 4 years) |
| Transformer supply constraints | -0.7% | Global | Short term (2 years or less) |
| Permitting approval delays | -0.5% | North America, Europe | Short term (2 years or less) |
Utility interconnection delays
Utility interconnection delays are a major restraint because data centers cannot begin operations until grid capacity, substations, and transmission connections are approved and completed. FERC reported that U.S. data-center capacity exceeded 50 GW by the end of 2025, after growing at a 24% CAGR since 2020, putting pressure on grid expansion and connection queues.
The IEA expects global data-center electricity demand to more than double by 2030, increasing the need for faster grid upgrades. Delays in approvals and network construction can postpone customer investment and revenue for UPS, generator, transformer, and switchgear suppliers. These constraints could reduce the market’s forecast growth by around 1.8% compared with the 7.9% baseline CAGR.
Challenges
| Challenge | (~) % CAGR | Geographic Relevance | Mitigation Horizon |
|---|---|---|---|
| Electrical component lead times | -1.1% | Global | Medium term (2 to 4 years) |
| Copper cost volatility | -0.7% | Global | Short term (2 years or less) |
| Specialist workforce shortages | -0.6% | North America, Europe, Asia Pacific | Long term (4 years or more) |
| Cooling power integration | -0.5% | Global | Medium term (2 to 4 years) |
| Cross-border logistics risk | -0.4% | Europe, Middle East, Asia Pacific | Short term (2 years or less) |
Electrical component lead times
Electrical component lead times remain a major market challenge because transformers, switchgear, and protection systems must be delivered before data-center power commissioning can begin. UNCTAD reported that Suez Canal tonnage in May 2025 remained about 70% below 2023 levels, increasing shipping times, inventory needs, and delivery uncertainty.
The World Bank reported that copper prices rose 15% quarter-on-quarter in the first quarter of 2026, increasing costs for cables, busbars, transformers, and UPS systems. At the same time, the IEA expects data-center electricity demand to rise, placing further pressure on equipment supply. Without stronger sourcing, modular production, and inventory planning, these constraints could reduce potential market growth by around 1.1%.
Opportunities
| Opportunity | (~) % CAGR | Geographic Relevance | Execution Window |
|---|---|---|---|
| Behind-the-meter power systems | +1.7% | North America, Europe, Asia Pacific | Medium term (2 to 4 years) |
| Modular power-as-a-service | +1.3% | Global | Medium term (2 to 4 years) |
| Edge infrastructure electrification | +0.9% | Asia Pacific, Europe, Latin America | Long term (4 years or more) |
| Battery lifecycle services | +0.7% | Global | Medium term (2 to 4 years) |
| Microgrid control platforms | +0.6% | North America, Middle East, Asia Pacific | Long term (4 years or more) |
Behind-the-meter power systems
FERC reported more than 50 GW of operating U.S. data-center capacity at the end of 2025, while UNCTAD noted that Suez transits remained 70% below 2023 levels in May 2025. Localized power systems and bundled equipment, monitoring, installation, and service contracts can reduce outage and supply-chain risks while creating recurring revenue. Successful adoption could add about +1.7% CAGR upside above the 7.9% baseline.
Key Players Analysis
The Data Center Power Market is led by major integrated electrical-infrastructure suppliers, including Schneider Electric, Eaton, ABB, Vertiv, Siemens, and Huawei, which together are estimated to account for around 60–70% of global data-center power-equipment sales. Schneider Electric remained a broad market leader, generating €40.1 billion in revenue in 2025, with organic growth of 8.9%, supported by strong Data Center & Networks demand.
Eaton’s Electrical Americas business recorded USD 13.2 billion in sales, increasing 16%. ABB invested USD 1.3 billion, equal to 4.0% of revenue, in R&D and increased capital expenditure by 25% to USD 1.0 billion. Siemens generated €78.9 billion in revenue and spent €6.6 billion on R&D, while Smart Infrastructure carried an order backlog of about €19 billion.
Vertiv is emerging as a faster-growing specialist competitor. Its sales increased 27.7% to USD 10.2 billion, including USD 8.39 billion from products, while backlog doubled to USD 15.0 billion. The company spent USD 441.7 million, or around 4.3% of revenue, on engineering and R&D and plans USD 425–525 million in capital expenditure for 2026.
Tier-2 competitors collectively hold an estimated 20–30% share. Mitsubishi Electric reported ¥5,521.7 billion in revenue, including ¥396.1 billion from Energy Systems, highlighting rising data-center investment as a key demand driver.
Top Key Players in the Market
- ABB Group
- Schneider Electric SE
- Eaton Corporation plc
- Vertiv Group Corp.
- Huawei Technologies Co., Ltd.
- Mitsubishi Electric Corporation
- Siemens AG
- Legrand Group
- Toshiba Corporation
- Fuji Electric Co., Ltd.
Recent Developments
- In 2026, Legrand announced the acquisition of Green4T and Kratos Industries in February. Brazil-based Green4T has nearly 750 employees and generates around €45 million in annual sales, while U.S.-based Kratos Industries employs nearly 325 people and records approximately USD 100 million in annual sales.
- In 2025, Eaton completed its acquisition of Fibrebond on April 1 for approximately USD 1.4 billion, strengthening its position in modular data-center power infrastructure. At the time of the transaction, Fibrebond had around USD 1.2 billion in backlog, providing more than 3 years of revenue coverage based on trailing 12-month sales.
Report Scope
| Report Features | Description |
|---|---|
| Market Value (2025) | USD 13.4 Billion |
| Forecast Revenue (2035) | USD 28.6 Billion |
| CAGR (2026-2035) | 7.9% |
| Base Year for Estimation | 2025 |
| Historic Period | 2020-2024 |
| Forecast Period | 2026-2035 |
| Report Coverage | Revenue Forecast, Market Dynamics, Competitive Landscape, Recent Developments |
| Segments Covered | By Component (Solution (Power Distribution, Cabling Infrastructure, Power Backup, Power Monitoring), Services); By Data Center Size (Large Data Centers, Small and Medium Sized Data Centers); By Industry Vertical (IT and Telecommunication, BFSI, Retail, Manufacturing, Healthcare, Government, Other) |
| Regional Analysis | North America – US, Canada; Europe – Germany, France, The UK, Spain, Italy, Rest of Europe; Asia Pacific – China, Japan, South Korea, India, Australia, Singapore, Rest of APAC; Latin America – Brazil, Mexico, Rest of Latin America; Middle East & Africa – GCC, South Africa, Rest of MEA |
| Competitive Landscape | ABB Group, Schneider Electric SE, Eaton Corporation plc, Vertiv Group Corp., Huawei Technologies Co., Ltd., Mitsubishi Electric Corporation, Siemens AG, Legrand Group, Toshiba Corporation, Fuji Electric Co., Ltd. |
| Customization Scope | Customization for segments, region/country-level will be provided. Additional customization can be done based on requirements. |
| Purchase Options | We have three licenses to opt for: Single User License, Multi-User License (Up to 5 Users), Corporate Use License (Unlimited Users and Printable PDF) |





























