


Report Overview
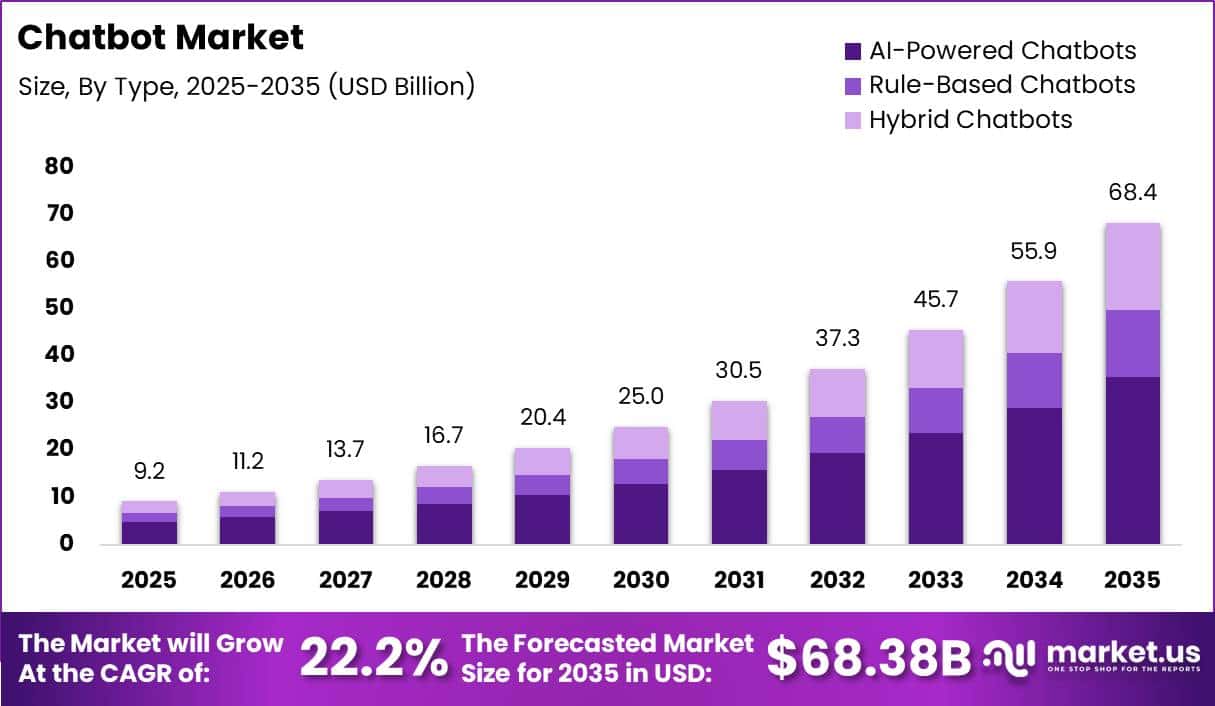
In 2025, the Global Chatbot Market was valued at USD 9.2 billion. The market is projected to grow at a CAGR of 22.2%% during 2026–2035, reaching approximately USD 68.3 billion by 2035. North America dominated the global market in 2025, accounting for more than 35.0% of the total market share and generating approximately USD 3.2 billion in revenue.
According to the OECD, the share of companies using AI increased from 5.6% in 2020 to 14% in 2024 and 20.2% in 2025. The Stanford HAI AI Index 2025 reported that 78% of organizations used AI in 2024, compared with 55% in 2023, while 71% used generative AI in at least one business function. Global corporate AI investment reached USD 252.3 billion in 2024, increasing by 44.5% year over year. U.S. private AI investment alone reached USD 109.1 billion, nearly 12 times China’s USD 9.3 billion.
Growing digital commerce is also strengthening chatbot demand. According to UNCTAD, global business e-commerce sales reached approximately USD 27 trillion in 2022, rising 25% from 2019. The World Bank reported that digital services employment grew by 7% annually between 2000 and 2022, around six times faster than total employment. Generative AI venture funding also increased from USD 29 billion in 2023 to USD 56 billion in 2024, supporting continued investment in chatbot and conversational AI platforms.
Key Takeaway
- The Chatbot Market was valued at USD 9.2 billion in 2025 and is projected to reach USD 68.3 billion by 2035, growing at a CAGR of 22.2%.
- AI-powered chatbots accounted for around 52.0% of the market, the leading technology segment.
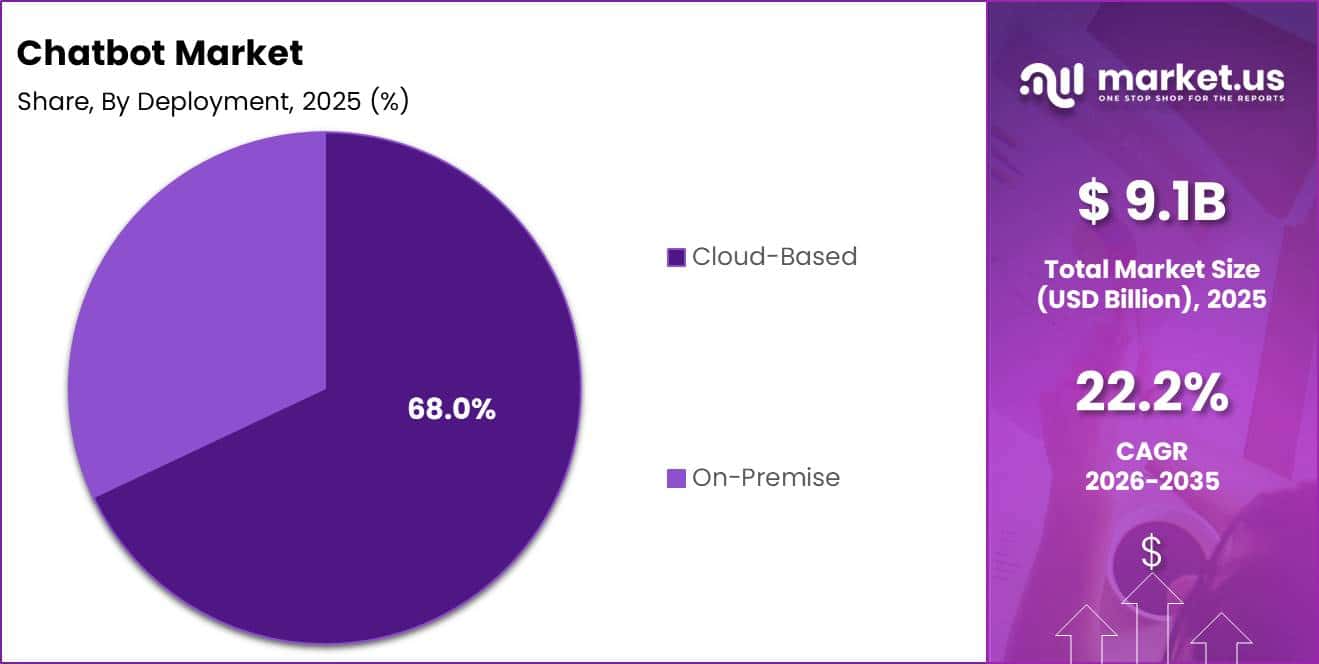
- Cloud-based deployment held about a 68.0% share, the leading and fastest-growing deployment segment.
- Customer support represented around 35.0% of applications, while sales and marketing is the fastest-growing segment.
- BFSI led end-user segments with around 22.0% share, while healthcare is the fastest-growing end-user segment.
- North America led the market in 2025 with over 35.0% share and USD 3.2 billion in revenue.
By Type
AI–powered chatbots accounted for around 52.0% of the global chatbot market, making them the leading and fastest-growing technology segment. Their strong position is supported by the rapid expansion of mobile connectivity and digital service usage. According to the International Telecommunication Union, the world recorded 9.2 billion mobile-cellular subscriptions in 2025, equal to 112 subscriptions per 100 inhabitants. Mobile broadband subscriptions also reached 99 per 100 inhabitants, showing that connected services are now widely accessible.
In 2024, more than 5.5 billion people were using the internet, while four out of every five people aged above 10 owned a mobile phone. This large connected population is increasing demand for fast and convenient customer support across mobile applications, websites, messaging platforms, and voice assistants.
By Deployment
Cloud-based deployment accounted for about 68.0% of the global chatbot market, making it the leading and fastest-growing deployment segment. This dominance is supported by the rapid expansion of public cloud infrastructure and software-as-a-service platforms. According to IDC, worldwide public cloud services generated USD 669.2 billion in revenue in 2023 and were forecast to reach USD 800 billion in 2024 and USD 1.6 trillion by 2028, representing a CAGR of 19.5%.
Cloud infrastructure spending also continues to increase as businesses shift their applications, data, and customer service operations away from traditional systems. In Q1 2024, spending on public cloud infrastructure reached USD 26.3 billion and represented 56.1% of total infrastructure spending. In comparison, spending on non-cloud infrastructure increased by only 5.7% during the same period.
By Application
Customer support accounted for around 35.0% of the global chatbot market, making it the leading application segment. Its strong position is supported by the large global services economy, which employs just over 50% of the world’s workforce, according to modeled ILO and World Bank data. Business services, retail, transport, and administrative activities generate high volumes of routine customer requests, including billing questions, order updates, appointment changes, and account-related issues.
Global e-commerce sales were expected to reach USD 6.3 trillion in 2024, increasing by 9.4% year on year. This growth continues to expand digital customer interactions and puts pressure on companies to provide faster support without significantly increasing labor costs. Chatbots help businesses manage common inquiries, reduce pressure on human agents, and provide 24/7 assistance across websites, mobile applications, and messaging platforms.
By End User
The BFSI segment accounted for around 22.0% of the global chatbot market, making it the leading end-user segment. Its strong position is supported by the rapid growth of digital banking, insurance, and payment services. According to the Bank for International Settlements, global cashless payments reached hundreds of billions of transactions in 2023, while several economies recorded more than 200–300 cashless payments per person during the year.
Healthcare represents the fastest-growing end-user segment in the chatbot market. According to the World Health Organization, global healthcare spending reached USD 9.8 trillion in 2021, equal to 10.3% of global GDP. Rising investment in telemedicine, digital patient portals, and remote care is increasing demand for automated communication tools. Healthcare chatbots are being used for appointment scheduling, patient registration, medication reminders, test-result updates, symptom guidance, and follow-up care.
Key Market Segments
By Type
- Rule-Based Chatbots
- Decision Tree Bots
- Scripted Bots
- AI-Powered Chatbots
- LLM-Based Bots
- NLP-Based Bots
- ML-Based Bots
- Hybrid Chatbots
By Deployment
- Cloud-Based
- API-Integrated
- Standalone SaaS
- On-Premise
By Application
- Customer Support
- FAQ Automation
- Ticket Resolution
- Sales & Marketing
- Lead Qualification
- Personalized Recommendations
- HR & Internal Operations
- E-commerce
- Healthcare
By End User
- BFSI
- Retail & E-commerce
- IT & Telecom
- Travel & Hospitality
- Media & Entertainment
- Others
Geopolitical Impact Analysis
Geopolitical tensions are increasing the cost and supply risks linked to the servers, semiconductors, networking systems, and electricity required for chatbot operations. In February 2024, UNCTAD reported that weekly container ship transits through the Suez Canal fell by 67%, while total Panama Canal transits dropped by 49% from their peak.
These disruptions forced vessels to use longer routes, reducing shipping capacity and delaying deliveries of cloud hardware manufactured in Asia. UNCTAD also reported that additional shipping capacity demand increased by around 12% between December 2023 and June 2024. The China Containerized Freight Index rose by approximately 120% between October 2023 and June 2024, highlighting the cost pressure on imported servers and replacement components.
Trade restrictions are creating further pressure on technology supply chains. The U.S. Trade Representative increased tariffs on selected Chinese semiconductor products to 50% in 2025, potentially raising procurement costs for hardware used in AI and chatbot data centres. Electricity costs also remain an important operating concern.
According to the International Energy Agency, data centres consumed 415 TWh of electricity in 2024, equal to around 1.5% of global electricity use. The United States accounted for 45% of this demand, followed by China at 25% and Europe at 15%. Consumption is projected to reach approximately 945 TWh by 2030.
Data-centre electricity demand also increased by 17% in 2025, compared with 3% growth in overall global electricity demand. These pressures may increase chatbot subscription and processing costs while encouraging cloud providers to invest in regional infrastructure, efficient processors, and diversified hardware supply chains.
Regional Analysis
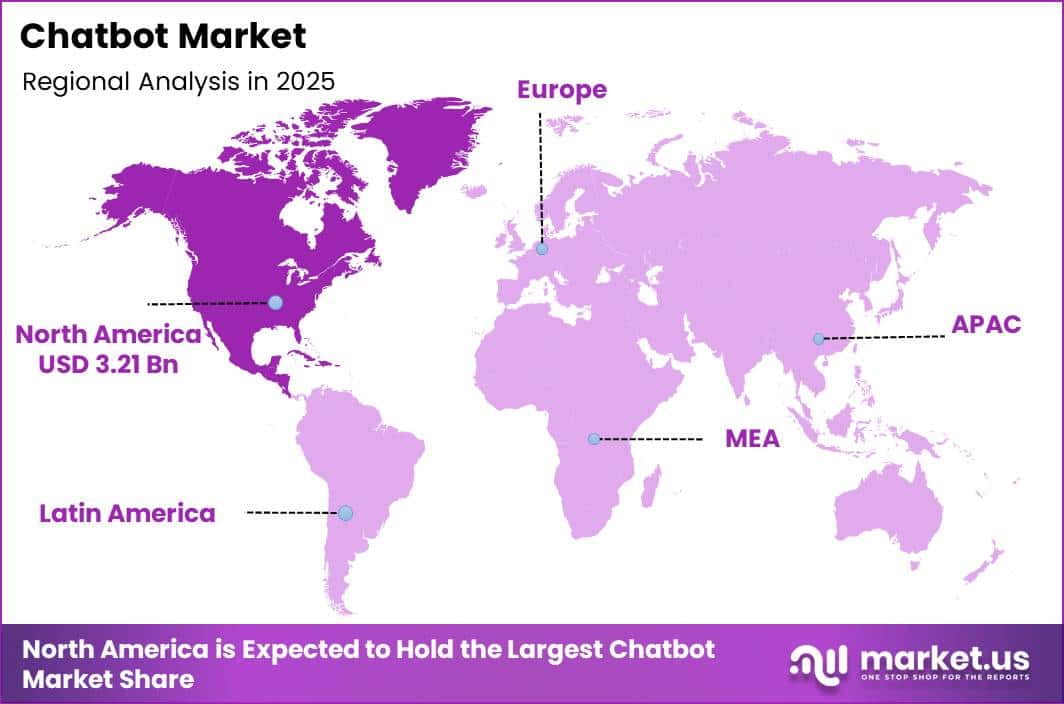
North America accounted for around 35.0% of the global chatbot market and generated approximately USD 3.2 billion in revenue in 2025, making it the leading regional market. Its strong position is supported by high enterprise technology spending, widespread cloud adoption, and early use of artificial intelligence across customer service, banking, telecommunications, and retail.
Large companies in the United States and Canada increasingly use chatbots across websites, mobile applications, digital banking platforms, internal help desks, and omnichannel support systems. The presence of advanced cloud infrastructure, major technology providers, and clear data protection and financial compliance requirements also supports larger and more structured chatbot deployments.
Asia Pacific represents the fastest-growing regional market. The region benefits from a large mobile-first population, extensive use of messaging applications, and rapid expansion of e-commerce, digital payments, and online banking. These trends generate high volumes of customer interactions that businesses increasingly manage through automated support, sales, and service chatbots.
Key Regions and Countries
North America
- US
- Canada
Europe
- Germany
- France
- The UK
- Spain
- Italy
- Rest of Europe
Asia Pacific
- China
- Japan
- South Korea
- India
- Australia
- Rest of APAC
Latin America
- Brazil
- Mexico
- Rest of Latin America
Middle East & Africa
- GCC
- South Africa
- Rest of MEA
Market Dynamics
Drivers
| Driver | (~) % CAGR | Geographic Relevance | Impact Timeline |
|---|---|---|---|
| LLM-Powered Enterprise Workflow Automation | +4.2% | Global, led by North America & Western Europe | Short term (≤ 2 years) |
| Surging Demand for 24/7 Omnichannel Customer Engagement | +3.5% | Global, highest velocity in APAC & North America | Short term (≤ 2 years) |
| No-Code/Low-Code Platforms Democratising Chatbot Deployment | +2.8% | Global, accelerating in SME-dense markets — India, SEA, LATAM | Short term (≤ 2 years) |
| Enterprise AI Maturity Shift from Pilot to Full Production | +2.2% | North America, Western Europe, East Asia | Medium term (2–4 years) |
| BFSI & Healthcare Push for Automated Compliance Interaction | +1.8% | North America, EU, GCC | Medium term (2–4 years) |
| Multilingual NLP Expansion Unlocking Emerging Market Penetration | +1.5% | India, Southeast Asia, Sub-Saharan Africa, LATAM | Medium term (2–4 years) |
LLM-Powered Enterprise Workflow Automation
The move from scripted chatbots to large language model-powered conversational systems is a major driver of chatbot market growth. In December 2025, OpenAI reported that enterprise message volumes increased by approximately 8 times year over year, while reasoning-token consumption through its API rose by nearly 320 times per organization. These figures show that businesses are moving beyond basic question answering and embedding conversational AI into CRM, ERP, customer service, and IT management workflows.
The productivity benefits are supporting larger enterprise contracts. ChatGPT Enterprise users reported saving around 40–60 minutes per active working day, while data science and engineering professionals saved approximately 60–80 minutes daily. The supplied benchmark also indicates a median generative AI return of around 55% for product development. A Microsoft-sponsored IDC study found that organizations generated about USD 3.7 for every USD 1 invested in generative AI, while leading adopters achieved approximately USD 10.3.
This transition is also changing chatbot pricing from per-seat licences toward consumption-based and outcome-based contracts. Based on the supplied estimates, an automated chatbot interaction costs around USD 0.5, compared with approximately USD 6.0 for a human-agent interaction, creating a nearly 12-times cost difference. LLM-based systems may also reduce average handling time by up to 70% and deliver investment payback within 6–9 months, encouraging faster upgrades and higher contract values.
Restraints
| Restraint | (~) % CAGR | Geographic Relevance | Impact Timeline |
|---|---|---|---|
| Fragmented Cross-Jurisdictional AI & Data Privacy Regulation | -3.1% | EU, US, India, China — divergent national frameworks | Short term (≤ 2 years) |
| Enterprise Trust Deficit from LLM Hallucination Risk | -2.4% | Global, most acute in BFSI, Legal & Healthcare verticals | Short term (≤ 2 years) |
| High CapEx Burden for Secure On-Premises Deployment | -1.8% | Regulated industries globally; GCC, India, EU | Medium term (2–4 years) |
| Consumer Reluctance to Share Sensitive Data with Automated Systems | -1.3% | Global, more pronounced in Western Europe & Japan | Short term (≤ 2 years) |
| SME Budget Constraints Limiting Full-Stack Deployment | -1.0% | LATAM, Sub-Saharan Africa, South & Southeast Asia | Medium term (2–4 years) |
Fragmented Cross-Jurisdictional AI & Data Privacy Regulation
Different AI and privacy rules across major markets are creating an immediate challenge for chatbot providers. The EU AI Act, Regulation (EU) 2024/1689, entered into force on 1 August 2024. Prohibited practices and AI literacy requirements applied from 2 February 2025, while general-purpose AI obligations began on 2 August 2025.
Financial penalties make compliance a serious procurement concern. Violations involving prohibited AI practices can attract fines of up to EUR 35 million or 7% of worldwide annual turnover. Other breaches, including failures related to transparency obligations, can result in penalties of up to EUR 15 million or 3% of global turnover. These risks sit alongside GDPR fines of up to EUR 20 million or 4% of worldwide revenue.
Compliance is also becoming more complex across India, China, and more than 20 U.S. states with comprehensive privacy laws. India notified its DPDP Rules on 14 November 2025, providing an 18-month phased compliance period. As a result, cross-border chatbot validation may increase from an estimated 4–6 weeks to 4–6 months, while implementation costs could rise by around 18–25%, delaying enterprise purchasing and commercial deployment.
Challenges
| Challenge | (~) % CAGR | Geographic Relevance | Mitigation Horizon |
|---|---|---|---|
| AI & NLP Talent Scarcity | -2.6% | Global, most acute in India, US, EU development hubs | Long term (≥ 4 years) |
| Legacy System Integration Complexity | -2.1% | Global, highest friction in manufacturing, government, BFSI | Medium term (2–4 years) |
| Conversational Quality & Context Retention Gaps | -1.7% | Global, amplified in multilingual & domain-specific deployments | Medium term (2–4 years) |
| Cybersecurity & Prompt Injection Vulnerabilities | -1.4% | Global, elevated risk in public-sector & financial deployments | Long term (≥ 4 years) |
| Organisational Change Management Resistance | -1.1% | Global, more pronounced in large enterprises & public institutions | Medium term (2–4 years) |
AI & NLP Talent Scarcity
The shortage of skilled conversational AI professionals represents a major long-term challenge for the chatbot market. Between 2023 and 2025, the number of workers in occupations requiring AI skills increased nearly 7 times, from around 1 million to 7 million. Demand for natural language processing expertise rose by 155% during the same period, while NLP specialist vacancy rates reached 15% in 2024, nearly twice the wider labour market average.
Rising competition for qualified professionals is also increasing development costs. According to the PwC AI Jobs Barometer, workers with advanced AI skills earned a 56% wage premium in 2024, compared with 25% in the previous year. Skills required for highly AI-exposed roles are changing more than 2 times faster than those in less-exposed occupations, with the pace of change accelerating by 75% year over year.
The OECD identifies limited AI skills as the second-largest barrier to enterprise AI adoption, behind cost. UK government projections indicate that AI-related employment could rise from 158,000 jobs in 2024 to 3.9 million by 2035. This imbalance may extend chatbot customization and model fine-tuning schedules by an estimated 30–45% compared with pre-2023 timelines, delaying the launch of specialized enterprise solutions.
Opportunities
| Opportunity | (~) % CAGR | Geographic Relevance | Execution Window |
|---|---|---|---|
| Agentic AI Monetisation Layer on Installed Chatbot Platforms | +4.5% | Global, led by North America, Western Europe, East Asia | Short term (≤ 2 years) |
| Healthcare & Life Sciences Vertical Specialisation | +2.9% | North America, EU, India, GCC | Medium term (2–4 years) |
| SME & Emerging Market Penetration via Micro-Tier SaaS Pricing | +2.3% | India, SEA, LATAM, Sub-Saharan Africa | Medium term (2–4 years) |
| Voice-Enabled Multimodal Chatbot Expansion | +2.0% | Global, fastest uptake in APAC & North America | Medium term (2–4 years) |
| Public Sector & E-Governance Chatbot Deployment | +1.6% | EU, India, GCC, Southeast Asia | Long term (≥ 4 years) |
| M&A Roll-Up of Vertical-Specific Chatbot Vendors | +1.2% | North America, Western Europe | Long term (≥ 4 years) |
Agentic AI Monetisation Layer on Installed Chatbot Platforms
The shift from reactive chatbots to autonomous agentic AI systems represents a major future growth opportunity. These systems can independently plan, execute, and adjust multi-step workflows using several tools with limited human involvement. However, commercial adoption remains at an early stage. Only 17% of organizations have deployed AI agents, while 42% expect to adopt them within the next 12 months and another 22% plan deployment during the following year. This gap indicates substantial untapped demand.
Existing chatbot providers are well positioned to benefit because agentic capabilities can be added to platforms already used by enterprise customers. This allows vendors to expand their services without bearing the full customer acquisition cost associated with new clients. Traditional chatbot interactions cost approximately USD 0.5 per query and are commonly priced by usage or user seats. Agentic platforms can instead charge for completed tasks, automated workflows, and API tool-call chains, potentially increasing average contract values by an estimated 3–5 times compared with conventional chatbot agreements.
The performance benefits also strengthen this opportunity. Agentic AI deployments in customer experience operations have achieved resolution rates around 3–5 times higher than traditional rule-based chatbots. In addition, 72% of customer experience leaders expect AI agents to become a primary support channel within two years. These trends suggest that chatbot vendors have a limited but high-value opportunity to introduce agentic solutions across their existing customer bases.
Key Players Analysis
Tier-1 companies in the chatbot market are led by large cloud and artificial intelligence platform providers with multi-billion-dollar operations. Microsoft reported USD 281.7 billion in FY2025 revenue, including USD 106.3 billion from Intelligent Cloud and more than USD 168 billion from overall cloud activities. Supported by Azure OpenAI and Copilot, Microsoft is estimated to hold a 20–25% share of enterprise chatbot and conversational AI infrastructure.
AWS generated USD 116.4 billion in trailing 12-month revenue and USD 42.8 billion in operating income in 2025, with a 36.8% operating margin. Its AI-related cloud investment exceeds USD 30 billion annually, while quarterly capital expenditure reached USD 31.4 billion. Salesforce recorded USD 37.9 billion in FY2025 revenue, including USD 35.7 billion, or 94%, from subscriptions and support. It also reported USD 13.1 billion in operating cash flow and USD 63.4 billion in remaining performance obligations.
Tier-2 companies, including OpenAI, Google, Nuance, LivePerson, Intercom, Drift/Salesloft, Freshworks, and Zendesk, are estimated to control a combined 30–40% of the commercial chatbot market. OpenAI has reportedly secured a USD 38 billion multi-year cloud and AI agreement.
Google Gemini subscription revenue was estimated at USD 1.2 billion in 2025, up from USD 0.3 billion in 2024, with around 750 million active users. Smaller application providers generate hundreds of millions of dollars in annual revenue and collectively hold an estimated 10–15% share through specialized support, sales, healthcare, and CRM solutions.
Top Key Players in the Market
- OpenAI (ChatGPT)
- Google (Gemini)
- Microsoft (Copilot)
- IBM Watson Assistant
- Salesforce (Einstein)
- Amazon Lex
- Nuance Communications
- LivePerson
- Intercom
- Drift (Salesloft)
- Freshworks
- Zendesk
Recent Developments
- In April 2026, Microsoft reported that Microsoft 365 Copilot had reached 20 million paid enterprise seats, increasing from 15 million in the previous quarter. The company added approximately 5 million seats within one quarter, while Accenture committed to more than 740,000 seats. Microsoft also recorded USD 31.9 billion in quarterly capital expenditure, reflecting continued investment in AI and cloud capacity supporting enterprise chatbot and agent deployments.
- In February 2026, Amazon reported that AWS revenue increased by 24% year over year to USD 35.6 billion in Q4 2025. Full-year AWS revenue reached USD 128.7 billion, rising by 20%, while Amazon’s total net sales increased by 12% to USD 716.9 billion in 2025. The company also outlined approximately USD 200 billion in 2026 capital expenditure, largely supporting AI computing, custom chips, and data-centre expansion.
Report Scope
| Report Features | Description |
|---|---|
| Market Value (2025) | USD 9.2 Billion |
| Forecast Revenue (2035) | USD 68.3 Billion |
| CAGR (2026-2035) | 22.2% |
| Base Year for Estimation | 2025 |
| Historic Period | 2020-2024 |
| Forecast Period | 2026-2035 |
| Report Coverage | Revenue Forecast, Market Dynamics, Competitive Landscape, Recent Developments |
| Segments Covered | By Type (Rule-Based Chatbots – Decision Tree Bots, Scripted Bots; AI-Powered Chatbots – LLM-Based Bots, NLP-Based Bots, ML-Based Bots; Hybrid Chatbots); By Deployment (Cloud-Based – API-Integrated, Standalone SaaS; On-Premise); By Application (Customer Support – FAQ Automation, Ticket Resolution; Sales & Marketing – Lead Qualification, Personalized Recommendations; HR & Internal Operations; E-commerce; Healthcare); By End User (BFSI, Retail & E-commerce, Healthcare, IT & Telecom, Travel & Hospitality, Media & Entertainment, Others) |
| Regional Analysis | North America – US, Canada; Europe – Germany, France, The UK, Spain, Italy, Rest of Europe; Asia Pacific – China, Japan, South Korea, India, Australia, Singapore, Rest of APAC; Latin America – Brazil, Mexico, Rest of Latin America; Middle East & Africa – GCC, South Africa, Rest of MEA |
| Competitive Landscape | OpenAI (ChatGPT), Google (Gemini), Microsoft (Copilot), IBM Watson Assistant, Salesforce (Einstein), Amazon Lex, Nuance Communications, LivePerson, Intercom, Drift (Salesloft), Freshworks, Zendesk |
| Customization Scope | Customization for segments, region/country-level will be provided. Moreover, additional customization can be done based on the requirements. |
| Purchase Options | We have three licenses to opt for: Single User License, Multi-User License (Up to 5 Users), Corporate Use License (Unlimited Users and Printable PDF) |





























