


Report Overview
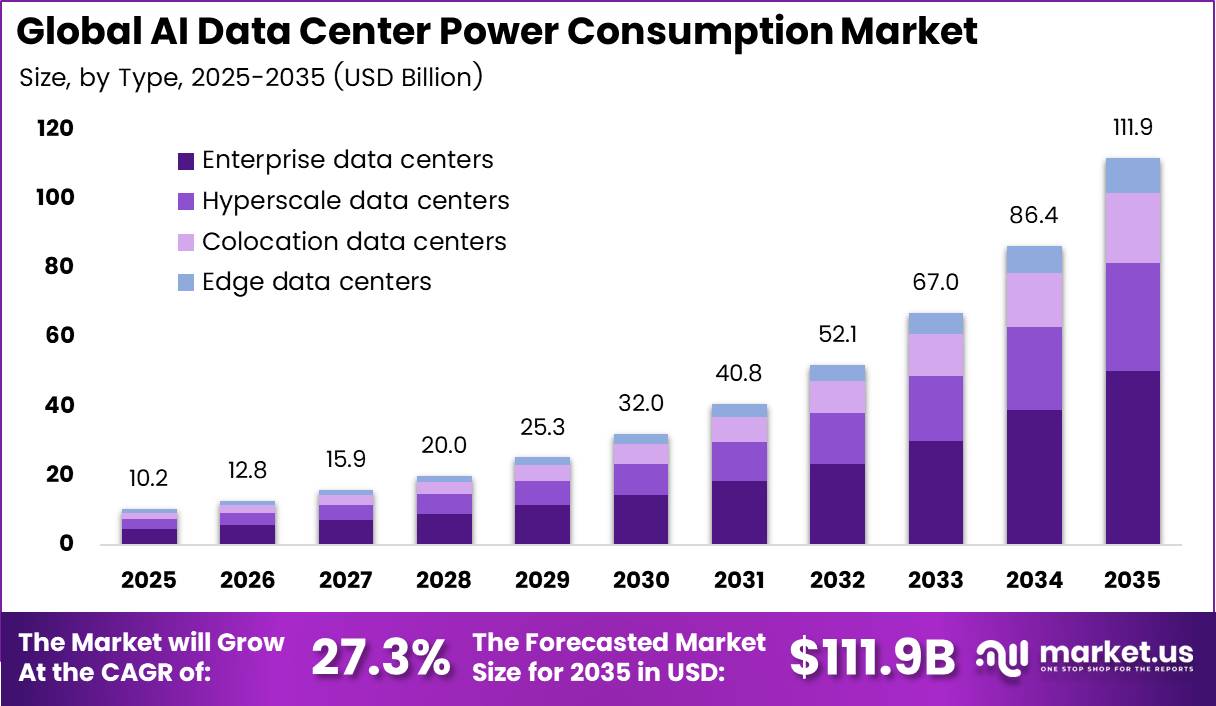
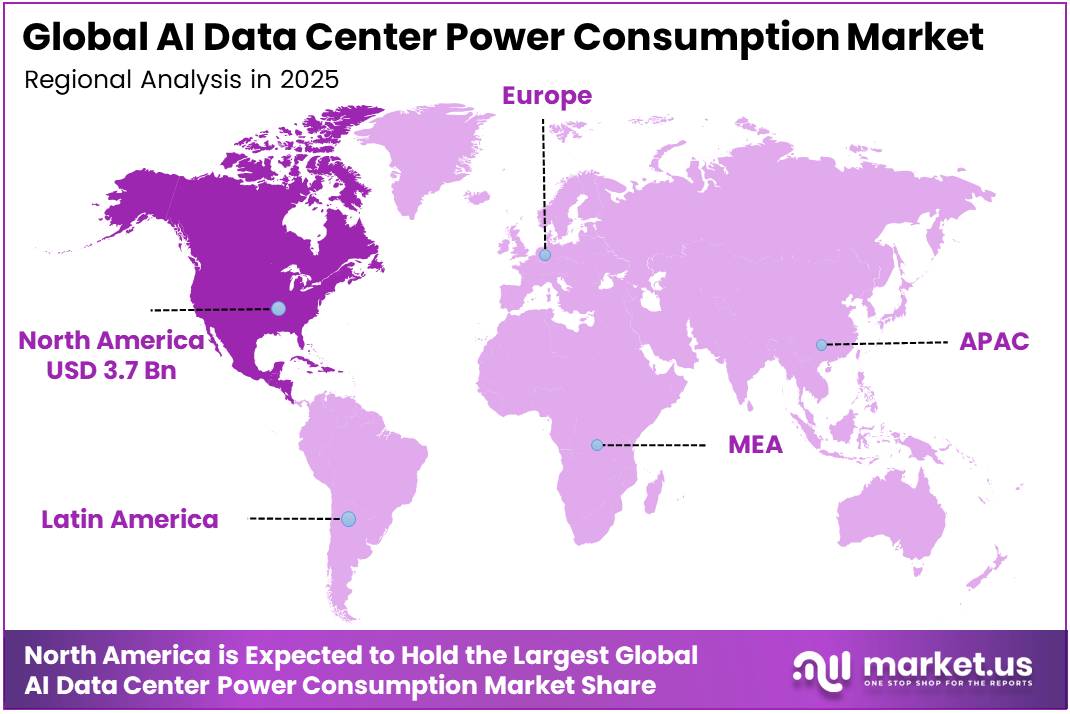
In 2025, the Global AI Data Center Power Consumption Market was valued at USD 10.2 billion. The market is projected to grow at a CAGR of 27.3% during 2026–2035, reaching approximately USD 111.9 billion by 2035. North America dominated the global market in 2025, accounting for more than 36.2% of the total market share and generating approximately USD 3.7 billion in revenue.
AI workloads drive this growth. The IEA reported that data centres used about 415 TWh of electricity in 2024, or about 1.5% of global power use. The agency expects this figure to reach about 945 TWh by 2030, rising about 15% each year. That pace is more than four times faster than power demand from all other sectors.
The IEA also expects power use in accelerated servers, which mainly run AI tasks, to grow 30% each year. Conventional servers will grow only 9% each year. This gap pushes operators to buy more power systems, cooling units, and backup supply built for dense AI racks.
The United States anchors this lead. According to the IEA, the US accounted for about 45% of global data centre electricity use in 2024. The IEA expects US data centre consumption to grow by about 240 TWh by 2030, a rise of 130% from 2024 levels. The agency also expects data centres to drive almost half of all US electricity demand growth through 2030.
Key Takeaways
- The Global AI Data Center Power Consumption Market was valued at USD 10.2 billion in 2025 and will reach USD 111.9 billion by 2035. at a CAGR of 27.3% from 2026 to 2035.
- By capacity, the Above 5 MW segment leads with a 54.8% share.
- By type, enterprise data centers lead with a 36.8% share.
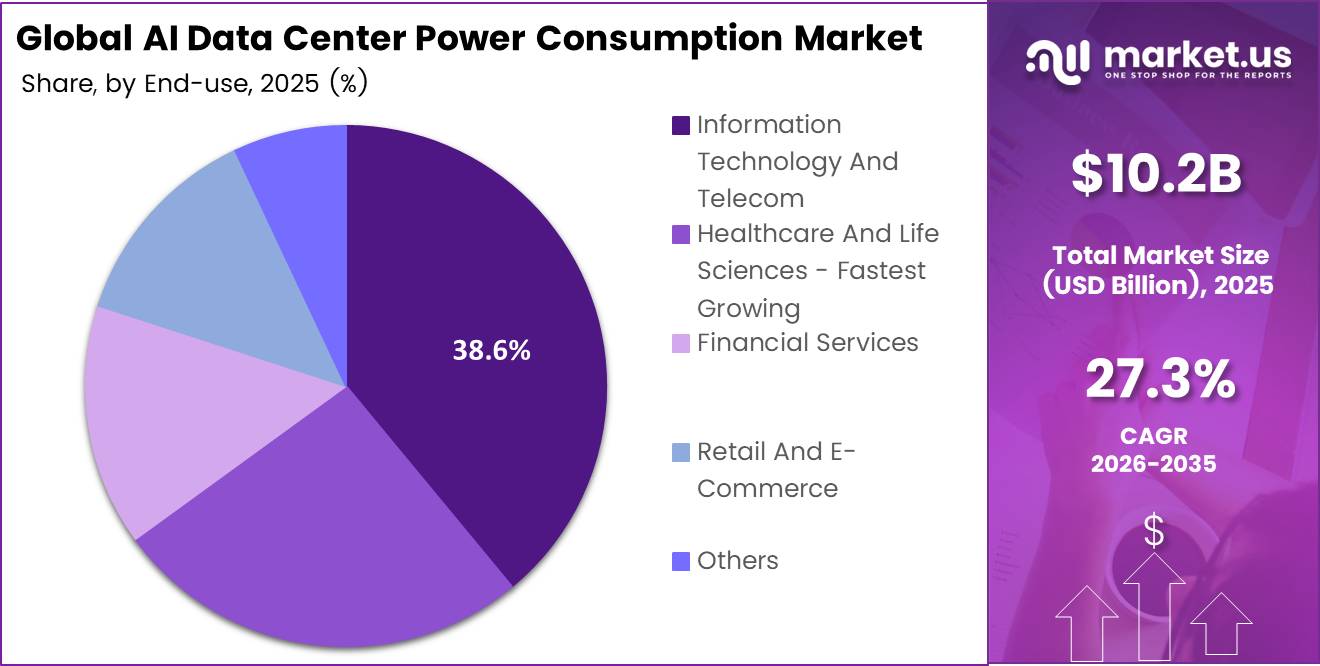
- By end-user industry, Information Technology and Telecom leads with a 38.6% share.
- North America leads the market with a 36.2% share and USD 3.7 billion in revenue.
By Capacity
Above 5 MW dominates with 54.8% due to large AI clusters requiring concentrated power.
Your supplied segmentation places Above 5 MW first by share and growth. Large AI facilities need substantial power because they run many high-performance servers together. Operators also need electricity for cooling, network equipment, and backup systems.
Above 5 MW also gains momentum as operators bring power-hungry AI servers into larger clusters. The IEA projects annual electricity demand growth of 30% for accelerated servers. That trend strengthens the case for larger facilities, although grid access, construction schedules, and electricity prices can limit expansion.
By Type
Enterprise data centers dominate with 36.8% due to direct control over sensitive business workloads.
Enterprise data centers lead your supplied segmentation because companies value direct control over business records, system access, and operating rules. Many organizations already maintain their own computing facilities, giving them an established base for adding AI tools.
Hyperscale data centers hold the fastest-growing position in your input. Their operators can spread spending on power, cooling, and networks across large customer groups. Microsoft’s 2025 annual report states that the company operates more than 400 data centers across 70 regions. This reach shows the scale that major cloud providers can bring to AI delivery and helps explain the expansion opportunity.
Microsoft also reports adding over 2 GW of capacity during the year. Such investment supports the growth outlook as customers rent AI computing rather than build every facility themselves. However, these figures describe Microsoft’s infrastructure, not a measured growth rate for the whole hyperscale segment.
By End User Industry
Information Technology and Telecom dominates with 38.6% due to cloud platforms and continuous network workloads.
Information Technology and Telecom leads your supplied segmentation because cloud services, software platforms, and network operations create a broad base of computing demand. These businesses use AI to support customer service, detect threats, manage traffic, and improve digital products. Their services often run continuously, which creates steady demand for servers and supporting power systems.
Healthcare and Life Sciences carries the fastest-growing designation in your input. Research teams and care providers increasingly work with large collections of medical records, scans, and genetic data. The NIH’s latest All of Us release includes more than 535,000 whole genome sequences linked to nearly 482,000 electronic health records.
Key Market Segments
By Capacity
- Above 5 MW
- 1 to 5 MW
- Less than 500 kW
- 500 kW to 1 MW
By Type
- Enterprise data centers
- Hyperscale data centers
- Colocation data centers
- Edge data centers
By End User Industry
- Information Technology And Telecom
- Healthcare And Life Sciences
- Financial Services
- Retail And E-Commerce
- Others
Geopolitical Impact Analysis
Trade policy now drives up the cost of power gear for AI data centers. The US started applying Section 232 duties to the full customs value of standard power transformers, at 25%. Products made mostly of copper, such as busbar, winding wire, and power cable, face duties of up to 50%. Chinese-origin equipment faces an extra 25% under Section 301. A transformer listed as duty-free can therefore cost close to 50% more once these duties stack up.
Shipping disruption adds delays for switchgear, UPS units, and cooling parts sourced from Asia. UNCTAD found that container tonnage crossing the Suez Canal fell 82% by early 2024 as carriers sailed around the Cape of Good Hope. Vessel tonnage passing the Cape rose 60%. UNCTAD showed that a round trip between India and Europe can stretch from 56 to 63 days, which requires one extra vessel on each loop.
The IMF measured a 50% drop in total Suez trade volume in early 2024. Fewer ships on the shortest route raise freight costs for heavy, bulky items like generators and battery cabinets. Builders now order these items months earlier and hold larger stocks, which ties up working capital.
Fuel security also shapes pricing. The IEA expects natural gas and coal to meet over 40% of the added electricity demand from data centres until 2030. Coal generation for data centres alone will rise by nearly 90 TWh. Any supply shock in gas or coal markets passes straight into power bills at AI sites. This pushes operators toward onsite fuel cells and renewable supply contracts.
Regional Analysis
North America dominates the AI Data Center Power Consumption Market, holding a 36.2% share and generating USD 3.7 billion in revenue. The US hosts the largest group of hyperscale operators and AI chip buyers. These firms keep building multi-gigawatt campuses that need large power and cooling systems.
Grid limits now shape how they build. Utilities cannot add transmission lines fast enough, so operators turn to on-site power. American Electric Power signed an agreement with Bloom Energy for up to 1 GW of solid oxide fuel cells to run AI data centers off the grid.
Asia Pacific is the fastest-growing region in the market. China leads the region and accounted for about 25% of global data centre electricity use in 2024. The IEA expects Chinese data centre demand to grow by 175 TWh by 2030, a rise of 170%. Japan’s demand will rise by about 15 TWh, an increase of more than 80%. India, South Korea, and Australia add new hyperscale capacity to support cloud and AI services.
Europe holds a solid second place as AI adoption grows across Germany, France, and the UK. The IEA puts Europe at about 15% of global data centre electricity use in 2024. The agency expects European demand to rise by about 45 TWh by 2030, an increase of 70%.
Key Regions and Countries
North America
- US
- Canada
Europe
- Germany
- France
- The UK
- Spain
- Italy
- Rest of Europe
Asia Pacific
- China
- Japan
- South Korea
- India
- Australia
- Rest of APAC
Latin America
- Brazil
- Mexico
- Rest of Latin America
Middle East and Africa
- GCC
- South Africa
- Rest of MEA
Market Dynamics
Drivers
| Driver | (~) % Impact on CAGR Forecast | Geographic Relevance | Impact Timeline |
|---|---|---|---|
| Accelerated AI server deployment | +1.6% | Global; United States and China strongest | Short term (2 years or less) |
| Enterprise inference commercialization | +0.9% | North America, Europe, Asia-Pacific | Short term (2 years or less) |
| Sovereign AI infrastructure procurement | +0.6% | Europe, Middle East, India, Southeast Asia | Medium term (2 to 4 years) |
| Multimodal training workload expansion | +0.5% | United States, China, advanced Asian economies | Short term (2 years or less) |
| Dedicated AI colocation adoption | +0.4% | Global cloud and enterprise hubs | Medium term (2 to 4 years) |
Accelerated AI server deployment
Accelerated server deployment increases the installed electrical load supporting AI services and shifts data-center commercialization from floor-space leasing toward power-reserved, compute-ready capacity. According to IEA analysis, accelerated-server electricity consumption grows approximately 30% annually in its base case and accounts for almost half of the projected increase in overall data-center electricity consumption; the user-supplied 27.3% market CAGR.
The U.S. Department of Energy’s December 2024 assessment projected overall U.S. data-center electricity use of 325–580 TWh by 2028, while Lawrence Berkeley National Laboratory’s 2024 analysis identified accelerated server deployment and operation as major determinants of that range.
The table’s +1.6% is an analyst-assigned sensitivity of 1.6 percentage points, not an institutional forecast; all table percentages use this convention. Across the four sections, positive sensitivities total 6.0 percentage points and negative sensitivities total 4.0 percentage points, producing a purely mechanical envelope of 23.3%–33.3% around the supplied baseline, rather than a revised forecast.
Restraints
| Restraint | (~) % Impact on CAGR Forecast | Geographic Relevance | Impact Timeline |
|---|---|---|---|
| Unavailable firm grid connections | -1.3% | United States, Ireland, continental European hubs | Short term (2 years or less) |
| Project-finance underwriting failures | -0.5% | Global; leveraged developers most exposed | Short term (2 years or less) |
| Advanced accelerator export restrictions | -0.4% | Restricted destinations and affected supply routes | Short term (2 years or less) |
| Site-level water withdrawal prohibitions | -0.3% | Water-stressed development locations | Medium term (2 to 4 years) |
| Backup-generation permitting refusals | -0.2% | Air-quality-constrained metropolitan locations | Short term (2 years or less) |
Unavailable firm grid connections
The immediate hard stop is an unavailable firm electricity connection: a completed AI facility cannot translate installed computing equipment into normal operating consumption without an authorized, deliverable power supply.
The IEA estimates that approximately 20% of planned data-center projects could face delays unless electricity-system constraints are addressed. According to the U.S. Department of Energy’s July 2024 recommendations, hyperscale connection requests of 300–1,000 MW or more, sought on 1–3-year development schedules, were stretching local grids’ ability to deliver capacity at the required pace.
EirGrid’s published connection process separately demonstrates that access requires a formal application and assessment, with changes in requested maximum import capacity potentially triggering reassessment; its current framework should not be reduced to an assumed blanket national prohibition. The analyst-assigned -1.3-percentage-point sensitivity therefore represents deferred energization and revenue recognition.
Challenges
| Challenge | (~) % CAGR Friction Drag | Geographic Relevance | Mitigation Horizon |
|---|---|---|---|
| High-density thermal integration complexity | -0.6% | Global; dense accelerator campuses | Medium term (2 to 4 years) |
| Electrical equipment delivery variability | -0.3% | North America, Europe, rapidly expanding Asian hubs | Medium term (2 to 4 years) |
| Specialist commissioning workforce shortages | -0.2% | Global; emerging development clusters | Medium term (2 to 4 years) |
| Rapid hardware refresh coordination | -0.1% | Global hyperscale and colocation operators | Short term (2 years or less) |
| Transient electrical load management | -0.1% | Global; concentrated AI computing clusters | Medium term (2 to 4 years) |
High-density thermal integration complexity
High-density thermal integration creates continuing operating friction because accelerator heat rejection must remain coordinated across cold plates, coolant distribution, facility loops, and residual air cooling; unlike an unavailable grid connection, this vulnerability permits operation but complicates reliable scaling.
NVIDIA’s April 2025 disclosure places full-rack power density at 120 kW, illustrating the concentration of heat that infrastructure teams must manage. According to the U.S. Department of Energy’s 2026 electrical modeling guidance, climate-control loads can represent 10–40% of total data-center electricity consumption.
Accordingly, cooling electricity cannot be treated as a fixed multiplier across all AI installations. The analyst-assigned -0.6-percentage-point friction sensitivity captures slower repeatable deployment and operating optimization, rather than assuming that inefficient cooling itself reduces measured electricity consumption.
Opportunities
| Opportunity | (~) % Potential CAGR Upside | Geographic Relevance | Execution Window |
|---|---|---|---|
| Operating-campus flexibility aggregation | +0.7% | United States, Europe, flexible-load electricity markets | Medium term (2 to 4 years) |
| Metered power-assurance subscriptions | +0.5% | Global multi-tenant AI facilities | Medium term (2 to 4 years) |
| Independent power-services consolidation | +0.3% | Fragmented regional infrastructure-service markets | Medium term (2 to 4 years) |
| Recoverable-heat offtake partnerships | +0.3% | Northern Europe and suitable industrial clusters | Long term (4 years or more) |
| Dedicated scientific AI campuses | +0.2% | Research-intensive economies and public institutions | Long term (4 years or more) |
Operating-campus flexibility aggregation
The untapped opportunity is a standardized, multi-operator service that monetizes schedulable AI workloads at already-connected campuses, rather than treating the existence of demand response as a new technology or counting connection relief again.
In an analyst scenario informed by those institutional findings, not a result reported by them, an aggregator shifts 10% of eligible workload electricity from peak periods carrying a 30% premium to otherwise comparable off-peak periods; with no rebound consumption or migration overhead, this reduces the eligible electricity bill by approximately 2.9%.
If electricity represents an assumed 25% of service revenue, the corresponding gross-margin improvement is approximately 0.7 percentage points before orchestration costs and any additional flexibility payments. These conditional unit economics underpin the analyst-assigned +0.7-percentage-point CAGR upside.
Key Players Analysis
NVIDIA, Eaton, and ABB form Tier 1. NVIDIA sets the power load that every AI site must support. The company reported fiscal 2026 revenue of USD 215.9 billion, up 65%. Its Data Center segment earned USD 193.7 billion, up 68%. NVIDIA spent USD 18.5 billion on R&D, or about 8.6% of revenue. Its Data Center revenue reached USD 89.0 billion in the second quarter of fiscal 2027, up 117%.
ABB reported 2025 revenue of USD 33.2 billion and invested USD 1.3 billion in R&D, about 4.0% of sales. Eaton grows through deals. The company bought liquid cooling firm Boyd Thermal for USD 9.5 billion, or 22.5 times its estimated 2026 adjusted EBITDA. Boyd Thermal expects 2026 sales of USD 1.7 billion, including USD 1.5 billion from liquid cooling.
Bloom Energy leads Tier 2 in onsite power. Its product revenue jumped 215% to USD 935 million in a recent quarter, with product gross margin at 37.2%. Bloom says its DC-native fuel cell design can cut non-compute capital spending by USD 3.6 billion at a 1 GW site. Its deal with American Electric Power is worth USD 2.65 billion.
Other Tier 2 firms include Schneider-rival Legrand, Vertiv peers Delta Electronics and Rittal, and generator makers Caterpillar and Cummins. Infineon, Danfoss, Mitsubishi Electric, Fujitsu, Huawei, and nVent compete in power chips, drives, cooling, and enclosures. These firms hold strong regional or product positions.
Top Key Players in the Market
- ABB Ltd.
- Bloom Energy Corp.
- Caterpillar Inc.
- Cummins Inc.
- Danfoss AS
- Delta Electronics Inc.
- Eaton Corp. Plc
- Fujitsu Ltd.
- Huawei Technologies Co. Ltd.
- Infineon Technologies AG
- Legrand SA
- Mitsubishi Electric Corp.
- nVent Electric Plc
- NVIDIA Corp.
- Rittal GmbH and Co. KG
Recent Developments
- In October 2025, Bloom Energy and Brookfield formed a USD 5 billion strategic partnership, under which Brookfield will invest to deploy Bloom fuel cells at AI data centers worldwide. Bloom Energy expanded its work with Oracle into a master agreement covering up to 2.8 GW of fuel cell capacity, including a first deployment of 1.2 GW.
- In November 2025, Eaton signed an agreement to acquire Boyd Thermal from Goldman Sachs Asset Management for USD 9.5 billion, adding a liquid cooling business with more than 5,000 employees.
Report Scope
| Report Features | Description |
|---|---|
| Market Value (2025) | USD 10.2 Billion |
| Forecast Revenue (2035) | USD 111.9 Billion |
| CAGR (2026-2035) | 27.3% |
| Base Year for Estimation | 2025 |
| Historic Period | 2020-2024 |
| Forecast Period | 2026-2035 |
| Report Coverage | Revenue Forecast, Market Dynamics, Competitive Landscape, Recent Developments |
| Segments Covered | By Capacity (Above 5 MW, 1 to 5 MW, Less than 500 kW, 500 kW to 1 MW); By Type (Enterprise data centers, Hyperscale data centers, Colocation data centers, Edge data centers); By End User Industry (Information Technology and Telecom, Healthcare and Life Sciences, Financial Services, Retail and E-Commerce, Others) |
| Regional Analysis | North America – US, Canada; Europe – Germany, France, The UK, Spain, Italy, Rest of Europe; Asia Pacific – China, Japan, South Korea, India, Australia, Singapore, Rest of APAC; Latin America – Brazil, Mexico, Rest of Latin America; Middle East & Africa – GCC, South Africa, Rest of MEA |
| Competitive Landscape | ABB Ltd., Bloom Energy Corp., Caterpillar Inc., Cummins Inc., Danfoss AS, Delta Electronics Inc., Eaton Corp. Plc, Fujitsu Ltd., Huawei Technologies Co. Ltd., Infineon Technologies AG, Legrand SA, Mitsubishi Electric Corp., nVent Electric Plc, NVIDIA Corp., Rittal GmbH and Co. KG |
| Customization Scope | Customization for segments, region/country-level will be provided. Moreover, additional customization can be done based on the requirements. |
| Purchase Options | We have three licenses to opt for: Single User License, Multi-User License (Up to 5 Users), Corporate Use License (Unlimited Users and Printable PDF) |





























