


Report Overview
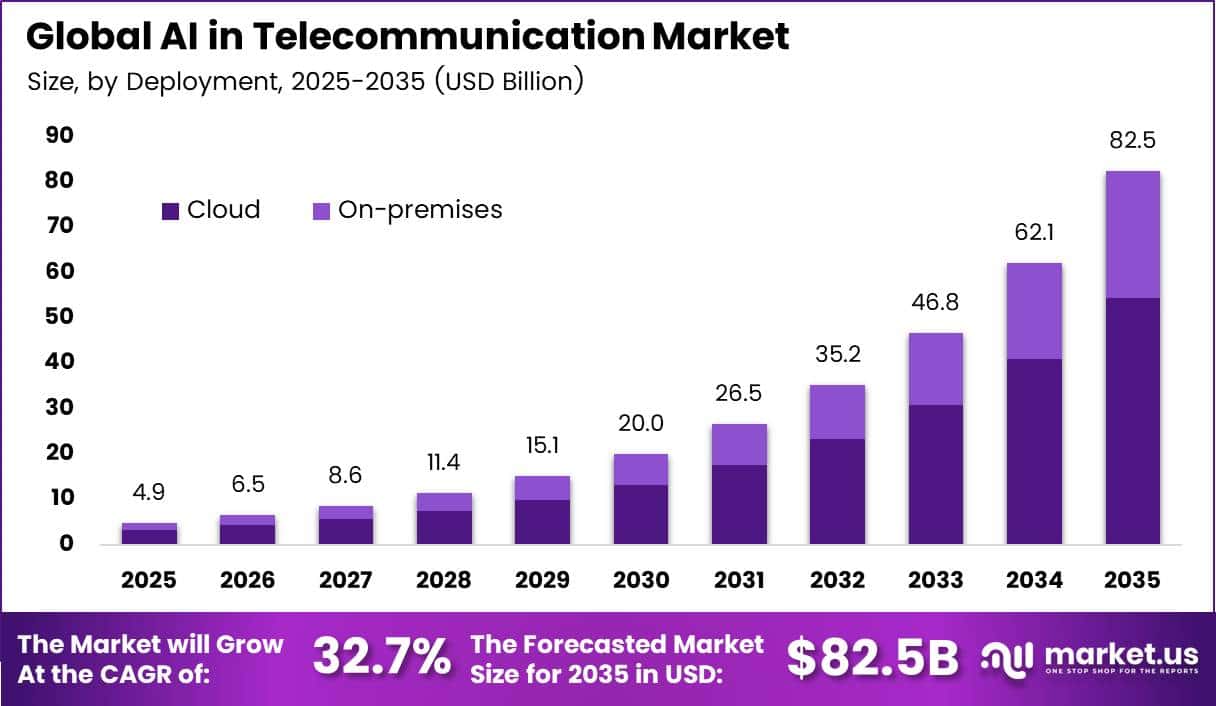
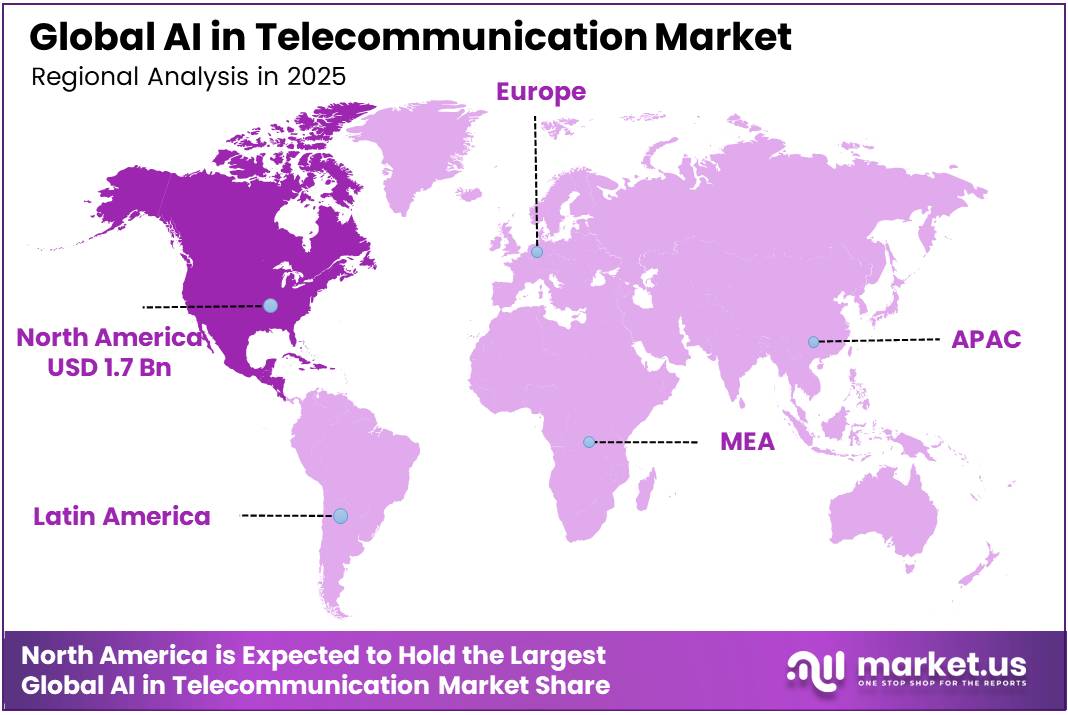
In 2025, the Global AI in Telecommunication Market was valued at USD 4.9 billion. The market is projected to grow at a CAGR of 32.7% during 2026–2035, reaching approximately USD 82.5 billion by 2035. North America dominated the global market in 2025, accounting for more than 35.0% of the total market share and generating approximately USD 1.7 billion in revenue.
Fast growth in network users drives this demand. According to the ITU, about 6 billion people used the Internet in 2025, up from 5.8 billion in 2024. The online population grew by more than 240 million people in a single year. The ITU also reported around 3 billion 5G subscriptions, about one third of all mobile broadband subscriptions. 5G networks now cover 55% of the world’s population.
North America region has strong digital access and deep capital spending. The ITU found that 84% of people in high-income countries have 5G access, compared with only 4% in low-income countries. US carriers keep investing in networks. AT&T plans to reach more than 60 million fiber locations by the end of 2030, according to its corporate filings.
Key Takeaways
- The Global AI in Telecommunication Market reached USD 4.9 billion in 2025 and will reach USD 82.5 billion by 2035. The market will grow at a CAGR of 32.7% from 2026 to 2035.
- By deployment, cloud leads the market with a 62.1% share.
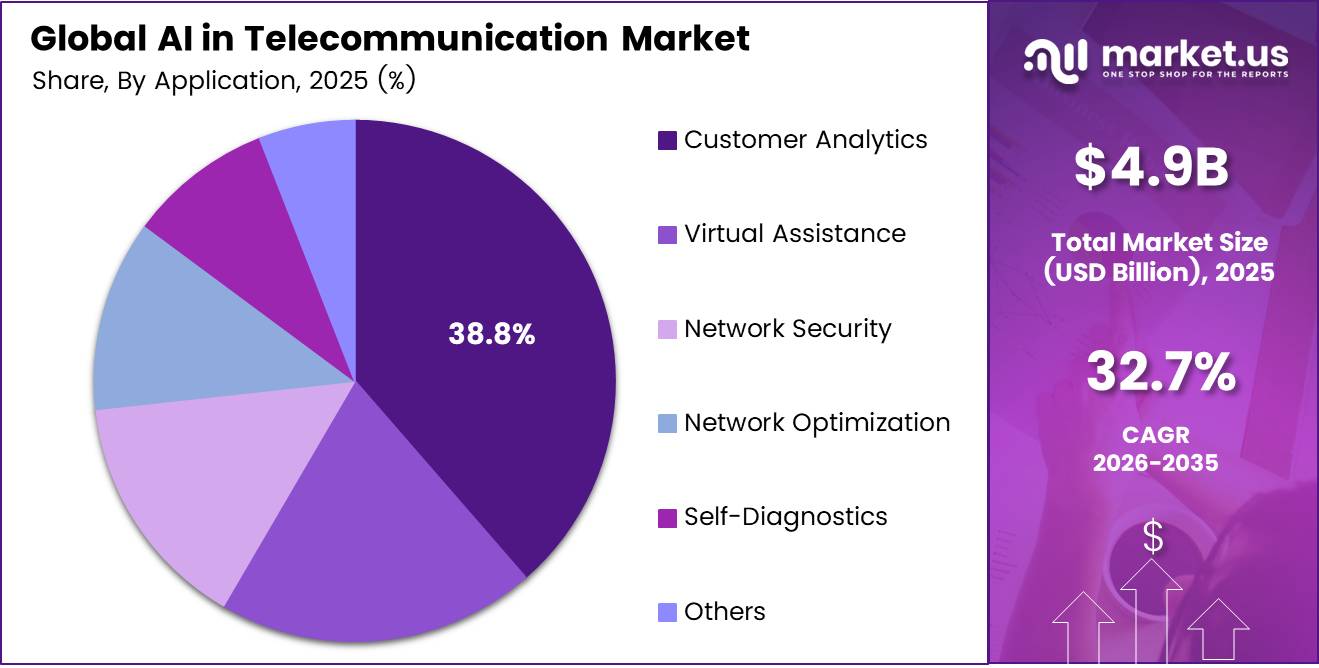
- By application, customer analytics leads with a 38.8% share.
- North America dominates with a 35.0% share and USD 1.7 billion in revenue.
By Deployment
Cloud dominates with 62.1% due to flexible, low-cost shared AI computing power.
Telecom operators choose Cloud because it lets them run large AI models without building costly data centers of their own. Microsoft reports that Azure and other cloud services revenue grew 34% in fiscal 2025, and Azure passed $75 billion in yearly revenue for the first time. This rapid rise shows how quickly large firms, carriers included, move AI workloads onto rented cloud platforms.
Business buyers of telecom services are also adopting cloud quickly. Eurostat finds that 52.7% of EU enterprises paid for cloud services in 2025, a rise of 7.4 percentage points from 2023. Among large firms, the share climbs to 84.7%, which pushes operators to offer cloud-ready AI tools to their enterprise clients.
On-premises keeps a steady role where carriers must hold sensitive subscriber data inside their own facilities. Strict privacy laws, national security rules, and low-delay network tasks lead many operators to run AI on local servers. Hybrid setups now let teams train models in the cloud and run them on-site, so On-premises demand grows more slowly as cloud tools mature.
By Application
Customer Analytics dominates with 38.8% due to massive subscriber data driving churn prediction.
Customer Analytics leads because operators serve huge customer bases and need AI to spot churn risk, shape offers, and price plans. ITU counts 9.2 billion mobile-cellular subscriptions worldwide in 2025, or 112 for every 100 people. Every account produces usage data, and AI turns that data into useful sales and retention insight.
Virtual Assistance grows fastest as carriers move routine support to chatbots and voice agents that answer simple questions day and night. Rising fraud adds urgency. The FBI’s IC3 reports that 2025 losses topped $20 billion, with 452,868 cyber-enabled fraud complaints. Smart assistants help operators verify callers, flag scams, and cut service wait times at lower cost.
Network Security, Network Optimization, and Self-Diagnostics add strong, steady demand. ITU estimates around 3 billion 5G subscriptions, and 5G networks now reach 55% of the world’s population. These complex networks need AI to guard traffic, balance loads, and find and fix faults automatically.
Key Market Segments
By Deployment
- Cloud
- On-premises
By Application
- Customer Analytics
- Virtual Assistance
- Network Security
- Network Optimization
- Self-Diagnostics
- Others
Geopolitical Impact Analysis
US and China trade tensions now shape the cost of AI hardware for telecom networks. In April 2025, the US added a baseline tariff of 10% on most imports. Tariffs on Chinese goods briefly reached 145% before falling to about 30% in May 2025, according to WTO trade monitoring. These duties raise the price of servers, GPUs, and radio parts that operators need to run AI at the network edge.
Export controls on chips add a second layer of risk. US limits on advanced AI processors cut Chinese vendors off from top GPUs. China answered by restricting exports of gallium and germanium. China supplies about 98% of the world’s primary gallium, a key input for RF chips and 5G radio units, according to World Bank commodity data.
Shipping problems also slow equipment delivery. UNCTAD reported that container tonnage crossing the Suez Canal fell 82% by February 2024 for large ships. Rerouting around the Cape of Good Hope adds about 10 to 14 days to Asia-to-Europe trips. The IMF measured a 50% drop in Suez trade volume in early 2024. These delays push back data center and base station builds that AI platforms rely on.
Metal prices raise network costs further. Copper prices passed USD 11,000 per ton in 2025, according to World Bank Pink Sheet data. Copper goes into cables, power systems, and cooling units in AI-ready telecom sites. Higher input costs lead operators to choose cloud AI models over on-premises hardware.
Regional Analysis
North America dominates the AI in Telecommunication Market, holding a 35.0% share and generating USD 1.7 billion in revenue. The US drives most of this demand. Large carriers keep spending heavily on fiber and wireless upgrades.
Asia Pacific is the fastest-growing region in the AI in Telecommunication Market. China runs the world’s largest 5G network, with more than 4 million base stations, according to its industry ministry. India has rapidly expanded 5G coverage and has over 1.1 billion telecom subscribers, according to TRAI. Japan and South Korea lead in AI-RAN trials.
Europe holds a strong second position. Operators in Germany, France, the UK, Spain, and Italy use AI to cut network energy use and meet climate goals. The EU Digital Decade program targets 5G coverage for 100% of populated areas by 2030. Nokia and Ericsson anchor the regional supply base. Nokia closed its USD 2.3 billion Infinera deal in February 2025. Strict data rules under the EU AI Act shape how operators deploy AI tools.
Key Regions and Countries
North America
- US
- Canada
Europe
- Germany
- France
- The UK
- Spain
- Italy
- Rest of Europe
Asia Pacific
- China
- Japan
- South Korea
- India
- Australia
- Rest of APAC
Latin America
- Brazil
- Mexico
- Rest of Latin America
Middle East and Africa
- GCC
- South Africa
- Rest of MEA
Market Dynamics
Drivers
| Driver | (~) % Impact on CAGR Forecast | Geographic Relevance | Impact Timeline |
|---|---|---|---|
| Outcome-based network operations adoption | +1.3% | Global; advanced mobile networks | Short term (2 years or less) |
| Radio-network energy optimization | +0.8% | Europe, Asia-Pacific, energy-constrained markets | Short term (2 years or less) |
| Customer-service AI deployment | +0.7% | Global; large subscriber bases | Short term (2 years or less) |
| Network threat-detection demand | +0.6% | Global; enterprise-heavy operators | Short term (2 years or less) |
| Predictive capacity-planning adoption | +0.4% | Asia-Pacific, North America, Europe | Medium term (2 to 4 years) |
Outcome-based network operations adoption
Increasing service complexity makes manual configuration less scalable, shifting AI procurement toward recurring managed-service contracts tied to network outcomes rather than isolated software licenses. Ericsson’s February 2024 launch established an intent-based framework translating business requirements into real-time network actions.
Ericsson’s June 2025 announcement also documented automated resource activation and deactivation in commercial network software, reinforcing the transition toward continuously optimized operations. The table’s +1.3-percentage-point sensitivity is an analyst scenario assumption, not a company forecast. Across all sections, percentage entries denote percentage-point adjustments to the user-supplied 32.3% baseline CAGR.
The combined driver-and-opportunity upside is capped at +6.8 percentage points, implying 39.1%, while combined restraints and challenges deduct 5.3 percentage points, implying 27.0%; these are separate stress cases, not additions to an already fully explained baseline. Evidence is limited to information available through 13 October 2026.
Restraints
| Restraint | (~) % Impact on CAGR Forecast | Geographic Relevance | Impact Timeline |
|---|---|---|---|
| Restricted advanced-compute procurement | -0.9% | China, Macau, restricted parent entities | Short term (2 years or less) |
| Unlawful personal-data processing barriers | -0.6% | European Economic Area; exposed global vendors | Short term (2 years or less) |
| Unavailable electricity connection capacity | -0.5% | Grid-constrained data-center locations | Medium term (2 to 4 years) |
| Prohibited employee emotion-recognition applications | -0.4% | European Union; workforce-monitoring applications | Short term (2 years or less) |
| Entity-listed customer transaction exclusions | -0.3% | Designated entities; restricted destinations | Short term (2 years or less) |
Restricted advanced-compute procurement
Advanced-compute licensing creates a transaction-level barrier where telecom AI deployments depend on controlled accelerators, rather than merely increasing implementation difficulty. The U.S. Bureau of Industry and Security’s December 2024 package introduced controls covering 24 semiconductor-equipment categories, 3 software-tool categories, and specified high-bandwidth memory, constraining alternative supply routes for affected buyers.
The analyst-assigned -0.9-percentage-point sensitivity reflects delayed or foregone accelerator-dependent deployment contracts in exposed accounts, not a global prohibition on telecom AI. Commercial consequences include deferred acceptance milestones and deployment revenue; the separate entity-list row concerns legally excluded counterparties and excludes hardware-licensing delays already captured here.
Challenges
| Challenge | (~) % CAGR Friction Drag | Geographic Relevance | Mitigation Horizon |
|---|---|---|---|
| Legacy cross-domain integration complexity | -0.8% | Global; incumbent multi-vendor operators | Medium term (2 to 4 years) |
| Production telemetry quality gaps | -0.6% | Global; heterogeneous network estates | Medium term (2 to 4 years) |
| Telecom AI skills shortages | -0.5% | Global; smaller operator organizations | Long term (4 years or more) |
| Model drift under change | -0.4% | Global; rapidly evolving traffic environments | Long term (4 years or more) |
| Probabilistic output assurance requirements | -0.3% | Global; service-critical AI applications | Medium term (2 to 4 years) |
Legacy cross-domain integration complexity
AI products can sell into individual network domains while still encountering expensive integration work when operators attempt estate-wide deployment: the structural vulnerability is inconsistent interfaces and control semantics across radio, transport, core, and service-management systems.
An illustrative analyst delivery model raises implementation effort from 100 to 120 normalized engineering units when custom connectors and regression testing are required, a 20% workload increase rather than an observed industry average; the associated -0.8-percentage-point CAGR friction represents slower replication, not cancelled initial sales.
Opportunities
| Opportunity | (~) % Potential CAGR Upside | Geographic Relevance | Execution Window |
|---|---|---|---|
| AI-enriched network API products | +0.9% | Global; federated operator ecosystems | Medium term (2 to 4 years) |
| Enterprise edge-inference managed services | +0.7% | Industrial Asia-Pacific, Europe, North America | Medium term (2 to 4 years) |
| Federated telecom model-development services | +0.6% | Multi-operator regional alliances | Long term (4 years or more) |
| Smaller-operator shared AI platforms | +0.5% | Emerging markets; regional fixed-line operators | Medium term (2 to 4 years) |
| Specialist application portfolio consolidation | +0.3% | Fragmented regional software ecosystems | Long term (4 years or more) |
AI-enriched network API products
The untapped opportunity is not basic API availability, which already exists, but separately monetized AI decision products combining network signals with enterprise workflows, such as risk-ranked transaction verification or context-aware service selection.
In an illustrative analyst unit-economic scenario, reusable orchestration reduces delivery cost per completed enterprise decision from 100 to 85 normalized units, a 15% reduction; with unchanged pricing and an initial delivery-cost ratio of 60%, gross margin rises from 40% to 49%, or 9 percentage points, before incremental selling expenses, revenue sharing, and compliance costs.
These are explicit scenario assumptions, not GSMA performance claims; the conditional +0.9-percentage-point CAGR upside requires new AI-product revenue and excludes basic API sales and internal network-operations savings.
Key Players Analysis
Tier 1 leaders control the computing and cloud layer. NVIDIA reported FY2025 revenue of USD 130.5 billion, with data center sales of USD 115.2 billion. In October 2025, it invested USD 1 billion in Nokia at USD 6.01 per share to build AI-RAN products. Amazon Web Services earned USD 107.6 billion in 2024. Alphabet spent USD 52.5 billion on CapEx in 2024, mostly on AI infrastructure.
IBM and Cisco lead in enterprise AI and network software. IBM posted 2024 revenue of USD 62.8 billion and closed its USD 6.4 billion HashiCorp purchase in 2025. Cisco completed its USD 28 billion Splunk deal in 2024 to add AI-driven security and observability. Microsoft spends heavily on Azure AI capacity that telcos rent.
Network vendors make up the next leadership group. Ericsson reported 2024 net sales of SEK 247.9 billion and spends about SEK 50 billion a year on R&D. Nokia booked EUR 2.8 billion in AI and cloud customer orders in Q2 2026. Huawei and ZTE lead AI network tools in Asia.
Tier 2 challengers hold strong niche or regional roles. AT&T paid USD 5.75 billion for Lumen’s fiber assets. T-Mobile US closed its USD 4.4 billion UScellular deal in 2025. Amdocs earned about USD 5.0 billion in FY2024 from telecom software. SAP, Verizon, and Subex focus on billing, analytics, and fraud control.
Top Key Players in the Market
- IBM Corporation
- Cisco Systems Inc.
- Microsoft Corporation
- NVIDIA Corporation
- Amazon Web Services Inc.
- Google LLC (Alphabet)
- Ericsson AB
- Nokia Corporation
- Huawei Technologies Co. Ltd.
- ZTE Corporation
- AT&T Inc.
- Verizon Communications Inc.
- T-Mobile US Inc.
- SAP SE
- Amdocs Ltd.
- Subex Ltd.
Recent Developments
- In February 2026, AT&T Inc. closed its USD 5.75 billion all-cash purchase of Lumen’s Mass Markets fiber business, adding over 1 million fiber subscribers.
- In October 2025, NVIDIA Corporation agreed to invest USD 1 billion in Nokia at USD 6.01 per share to build AI-RAN products for 5G-Advanced and 6G networks.
- In August 2025, T-Mobile US Inc. closed its purchase of UScellular’s wireless operations, valued at about USD 4.4 billion.
- In February 2025, Nokia Corporation closed its USD 2.3 billion purchase of Infinera to expand its optical network business for AI data centers.
Report Scope
| Report Features | Description |
|---|---|
| Market Value (2025) | USD 4.9 Billion |
| Forecast Revenue (2035) | USD 82.5 Billion |
| CAGR (2026-2035) | 32.7% |
| Base Year for Estimation | 2025 |
| Historic Period | 2020-2024 |
| Forecast Period | 2026-2035 |
| Report Coverage | Revenue Forecast, Market Dynamics, Competitive Landscape, Recent Developments |
| Segments Covered | By Deployment (Cloud, On-premises); By Application (Customer Analytics, Virtual Assistance, Network Security, Network Optimization, Self-Diagnostics, Others) |
| Regional Analysis | North America – US, Canada; Europe – Germany, France, The UK, Spain, Italy, Rest of Europe; Asia Pacific – China, Japan, South Korea, India, Australia, Singapore, Rest of APAC; Latin America – Brazil, Mexico, Rest of Latin America; Middle East & Africa – GCC, South Africa, Rest of MEA |
| Competitive Landscape | IBM Corporation, Cisco Systems Inc., Microsoft Corporation, NVIDIA Corporation, Amazon Web Services Inc., Google LLC (Alphabet), Ericsson AB, Nokia Corporation, Huawei Technologies Co. Ltd., ZTE Corporation, AT&T Inc., Verizon Communications Inc., T-Mobile US Inc., SAP SE, Amdocs Ltd., Subex Ltd. |
| Customization Scope | Customization for segments, region/country-level will be provided. Moreover, additional customization can be done based on the requirements. |
| Purchase Options | We have three licenses to opt for: Single User License, Multi-User License (Up to 5 Users), Corporate Use License (Unlimited Users and Printable PDF) |





























