


Report Overview
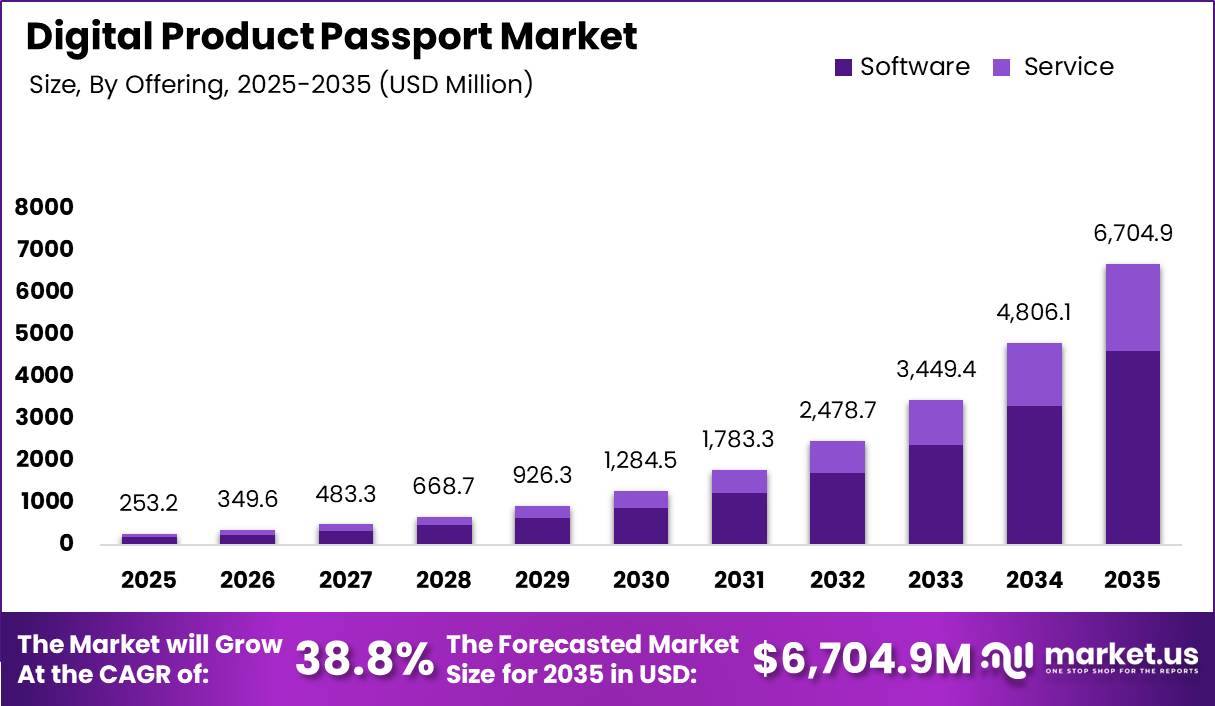
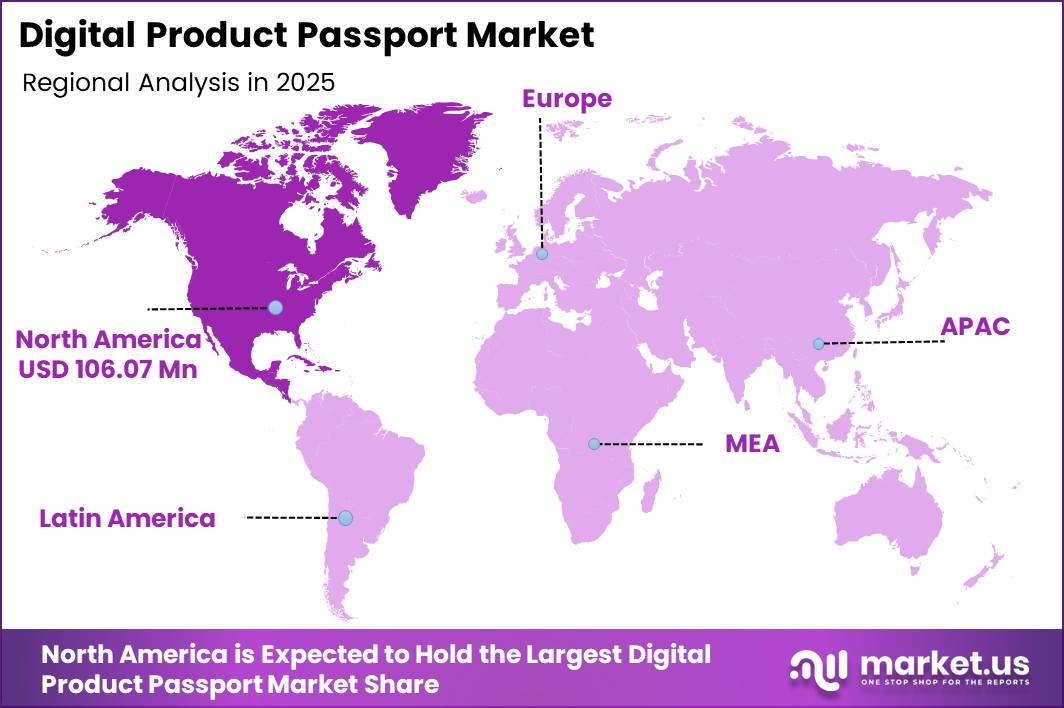
In 2025, the Global Digital Product Passport Market was valued at USD 253.2 Million. The market is projected to grow at a CAGR of 38.8% during 2026–2035, reaching approximately USD 6,704.9 Million by 2035. North America dominated the global market in 2025, accounting for more than 41.8% of the total market share and generating approximately USD 106.07 Million in revenue.
The large size of major end-use industries also supports market expansion. Global motor vehicle production reached 96.4 million units in 2025, according to OICA, highlighting the significant automotive base that may require product-level tracking, lifecycle records, and regulatory data. The growing volume of electronic waste is also increasing the need to track components, raw materials, repair history, reuse opportunities, and recycling processes across electronics supply chains.
North America regional growth is supported by strong adoption across manufacturing, automotive, electronics, and retail industries, where companies face increasing pressure to improve regulatory compliance, supply chain visibility, product transparency, and sustainability reporting.
Key Takeaway
- The Global Digital Product Passport Market was valued at USD 253.2 Million in 2025 and is projected to reach USD 6,704.9 Million by 2035.
- The market is expected to grow at a CAGR of 38.8% between 2026 and 2035.
- The software segment held a dominant 69.0% share by offering.
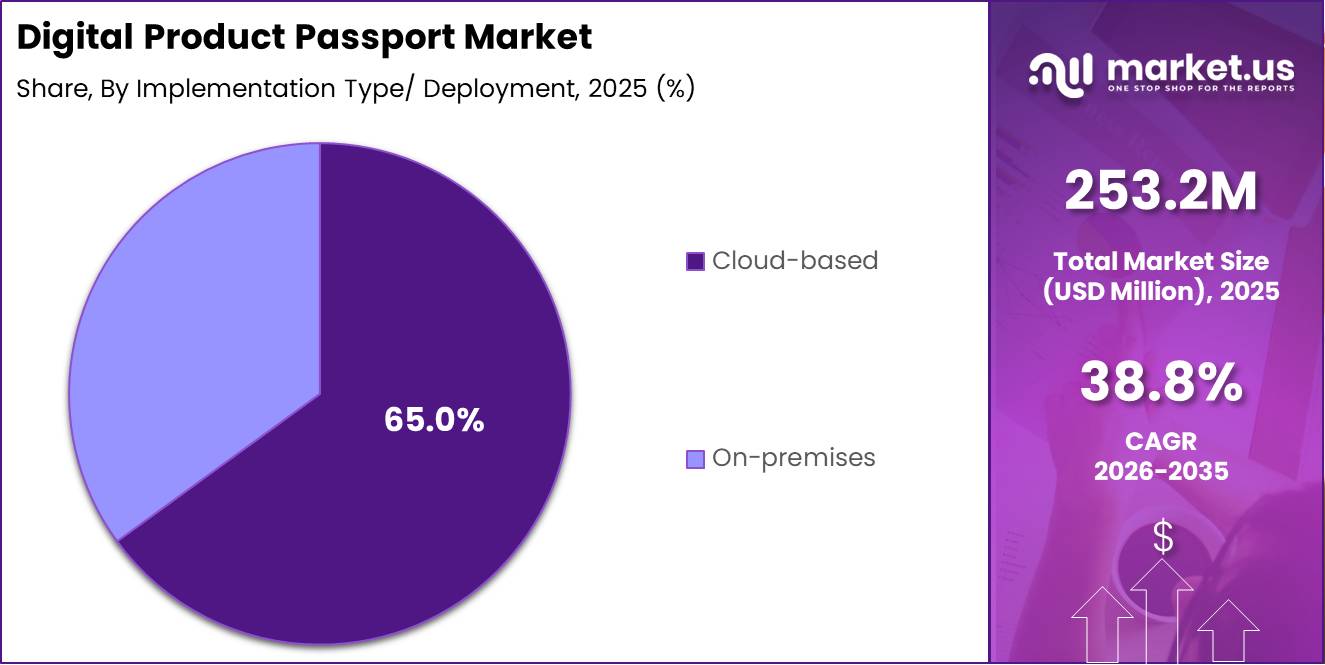
- The cloud-based segment held a dominant 65.0% share by implementation type.
- The end-of-life stage accounted for 25.0% of the market by lifecycle stage.
- The consumer electronics segment held a dominant 39.0% share by industry vertical.
- North America led the market in 2025 with more than 41.8% share, generating approximately USD 106.07 Million.
By Offering
The Software segment held a dominant 69.0% share of the Digital Product Passport market because each passport requires a centralized platform to collect, store, manage, and exchange structured product data. These software platforms connect product identifiers with bills of materials, carbon footprint records, repair history, sourcing details, and end-of-life instructions.
Demand for software is further supported by the European Union’s Ecodesign for Sustainable Products Regulation, which is creating a dedicated framework for Digital Product Passport service providers. Third-party platforms will be required to securely process and share passport data with customs authorities, market regulators, supply chain partners, and customers.
By Implementation Type / Deployment
The Cloud–based segment held a dominant 65.0% share of the Digital Product Passport market, supported by the growing need to manage product data across global supply chains. In 2025, world merchandise exports reached USD 26.3 trillion, increasing by 7.2% from the previous year. This large volume of international trade creates strong demand for systems that can quickly verify product origin, material composition, sustainability claims, and compliance records across borders.
Cloud platforms allow manufacturers, logistics companies, retailers, customs authorities, and business partners to access and exchange Digital Product Passport information through connected application programming interfaces. Compared with on-premise systems, cloud deployment requires lower upfront investment and offers greater flexibility as data volumes and user numbers increase.
By Lifecycle Stage
The End-of-life stage accounted for 25.0% of the Digital Product Passport market because recyclers and regulators require accurate product data to manage waste safely and recover valuable materials. In 2022, the world generated 62 billion kg of electronic waste, while only 22.3% was formally collected and recycled.
This left more than 48 billion kg outside recognized recycling systems and contributed to an estimated USD 37 billion in economic losses from unrecovered materials and environmental damage. Basel Convention guidelines also emphasize the need for reliable information when distinguishing reusable electronics from waste and managing cross-border movements.
Digital Product Passports make this information machine-readable and accessible in real time. As global e-waste is expected to reach 82 billion kg by 2030, demand for end-of-life passport solutions is likely to increase steadily, supported by stricter compliance requirements and stronger material recovery targets.
By Industry Vertical
The Consumer Electronics segment held a dominant 39.0% share of the Digital Product Passport market because it combines high production volumes, complex material structures, and short product replacement cycles. In 2025, global smartphone shipments reached approximately 1.2 billion units, showing the scale of electronic devices entering the market each year.
The need for product-level traceability is further supported by rising electronic waste. According to the Global E-waste Monitor, the world generated 62 million tonnes of electronic waste in 2022, while only 22.3% was formally collected and recycled. This left more than 48 million tonnes outside recognized recycling systems, increasing the risk of losing valuable metals and critical raw materials.
Key Market Segments
By Offering
- Software
- DPP management platforms
- Product lifecycle management (PLM) integration tools
- Data capture and tagging software (barcodes, RFID, QR codes)
- Services
- Consulting and advisory services
- Implementation and integration services
- Managed and support services
By Implementation Type / Deployment
- Cloud-based
- On-premises
By Lifecycle Stage
- Product design
- Production
- Distribution
- Usage/in-service
- End-of-life (recycling, reuse, disposal)
By Industry Vertical (Granular)
- Consumer electronics
- Automotive
- Textiles and fashion
- Food and beverage
- Others
Geopolitical Impact Analysis
Geopolitical tensions are increasing the costs and delivery risks associated with Digital Product Passport solutions by disrupting the supply of servers, networking equipment, cloud infrastructure, and electronic devices. In 2025, global trade in goods and commercial services increased by 4% to USD 32.2 trillion. However, this activity remains exposed to shipping disruptions, tariff changes, and energy price volatility.
UNCTAD reported that attacks in the Red Sea reduced Suez Canal trade volumes by 42% and weekly container ship transits by 67%. Average spot freight rates on major Asia–Europe routes from Shanghai increased by up to 256%, while overall container shipping spot rates rose by 122% between December 2023 and early 2024.
According to the World Shipping Council, rerouting vessels around the Cape of Good Hope can add as much as 17 days to transit times. These delays increase inventory requirements, working capital needs, and delivery times for data-centre hardware and passport-enabled products.
Energy market instability linked to the Russia–Ukraine conflict has also affected operating expenses. European natural gas prices rose to more than 2.5 times their 2019 level at peak periods, increasing electricity and data-centre costs for cloud-based platforms. WTO data indicates that applied MFN tariffs on ICT goods commonly range from 3% to 6%, while selected electronics and networking products affected by US–China trade measures have faced tariffs of up to 25%.
Regional Analysis
North America led the Digital Product Passport market in 2025, accounting for more than 41.89% of global revenue and generating approximately USD 106.07 million. The region’s leadership is supported by advanced digital infrastructure, strong regulatory preparedness, and a large industrial base across automotive, electronics, manufacturing, and retail.
Asia-Pacific is emerging as the fastest-growing regional market due to its leading position in global automotive and electronics manufacturing. The region produced more than 61% of worldwide vehicle output in 2025, with production increasing by 7.6% to approximately 59.2 million units. China alone produced 34.5 million vehicles, representing a 10.4% year-on-year increase.
North American electronics production was valued at USD 359 billion in 2024 and was expected to grow by another 8.2% in 2025. Asia’s electronics equipment and component production reached USD 1,494 billion in 2024, including USD 801 billion from China, while manufacturing activity continued to expand in countries such as Vietnam and India.
Key Regions and Countries
North America
- US
- Canada
Europe
- Germany
- France
- The UK
- Spain
- Italy
- Rest of Europe
Asia Pacific
- China
- Japan
- South Korea
- India
- Australia
- Rest of APAC
Latin America
- Brazil
- Mexico
- Rest of Latin America
Middle East & Africa
- GCC
- South Africa
- Rest of MEA
Market Dynamics
Drivers
| Driver | (~) % CAGR | Geographic Relevance | Impact Timeline |
|---|---|---|---|
| EU ESPR-linked DPP mandates | +7.0% | European Union, spillover to exporters | Short term (≤ 2 years) |
| EU battery passport deadline 2027 | +5.0% | EU, EV and industrial battery exporters | Short to medium term (1–3 years) |
| Circular economy and ESG pressure | +4.5% | Europe, North America, developed APAC | Medium term (2–4 years) |
| QR, NFC and cloud maturity | +3.0% | Global | Short term (≤ 2 years) |
| OEM traceability and recall risk | +2.5% | Automotive, electronics, textiles OEMs | Short to medium term (1–3 years) |
| Early-mover pilots in textiles | +1.8% | EU textiles and apparel | Medium term (2–4 years) |
EU ESPR-linked DPP mandates
The Ecodesign for Sustainable Products Regulation, which entered into force in 2024 and anchors Digital Product Passports as a core compliance mechanism, is forcing manufacturers selling into the EU to redesign product data architectures within a 2–4-year window, adding roughly +7.0% to the baseline CAGR as DPP platforms shift from optional pilots to mandatory infrastructure across early product groups such as textiles, tyres, and furniture.
Between 2024 and the baseline year 2026, EU working plans for 2025–2030 have prioritized several high-volume categories, implying that thousands of SKUs per large OEM must each carry a unique digital record, often driving IT budgets for compliance and product data management up by 20–35% and lifting vendor revenues via per-item or per-license pricing.
Operationally, this regulatory push is accelerating business-model shifts away from one-off consulting and custom integration toward recurring SaaS and data-hosting models, with some early providers already reporting that over 60% of new DPP-related contracts are multi-year subscriptions with transaction-based fees tied to QR, barcode, or NFC-tagged units shipped into the EU.
Restraints
| Restraint | (~) % CAGR | Geographic Relevance | Impact Timeline |
|---|---|---|---|
| High initial integration and compliance costs | -5.5% | EU-focused manufacturers and exporters | Short term (≤ 2 years) |
| Legacy IT and data silos | -3.5% | Global, especially traditional manufacturing | Medium term (2–4 years) |
| Regulatory uncertainty beyond EU | -2.8% | North America, Asia outside EU supply chains | Medium term (2–4 years) |
| SME affordability constraints | -2.2% | EU and emerging markets SMEs | Short to medium term (1–3 years) |
| Data ownership and liability concerns | -1.9% | Global | Medium term (2–4 years) |
| Vendor lock-in fears | -1.5% | Large multinational OEMs | Short to medium term (1–3 years) |
High initial integration and compliance costs
Because the EU Battery Regulation makes full digital battery passports mandatory from February 18, 2027, manufacturers and supply chains have been in an accelerated build-out phase through 2025–2026, with many large EV and industrial battery makers reporting DPP-related capex and opex in the low hundreds of basis points of revenue, translating into an effective drag of around -5.5% on near-term CAGR as projects are phased and some deployments are deferred.
This cost overhang compresses margins by an estimated 1–2 percentage points in the early years for smaller and mid-tier players and leads to staggered rollouts or temporary carve-outs (for example, prioritizing EU-bound product lines while postponing non-EU lines), which directly restrains the overall pace of DPP market adoption despite the positive long-term regulatory pull.
Challenges
| Challenge | (~) % CAGR | Geographic Relevance | Mitigation Horizon |
|---|---|---|---|
| Interoperability and standards fragmentation | -4.0% | Global, especially cross-border supply chains | Medium term (2–4 years) |
| Complex multi-tier supply chains | -3.2% | Automotive, electronics, textiles | Long term (≥ 4 years) |
| Data quality and verification burden | -2.7% | Global | Medium term (2–4 years) |
| Cybersecurity and access management | -2.3% | Global | Long term (≥ 4 years) |
| Shortage of DPP-savvy talent | -2.0% | Europe, North America | Medium term (2–4 years) |
| Misaligned incentives across value chain | -1.6% | Global | Long term (≥ 4 years) |
Interoperability and standards fragmentation
Because the ESPR and EU Battery Regulation define high-level objectives but leave many implementation details to delegated acts and industry initiatives, there is still fragmented guidance on data models, APIs, and access rights as of 2026, creating an estimated friction drag of around -4.0% on the market’s achievable CAGR while companies hedge between competing schemas.
OEMs supplying into both EU and non-EU markets must reconcile multiple overlapping frameworks (for example, EU-mandated QR-linked passports with other regional sustainability disclosures), leading to duplicated IT spend where as much as 20–30% of DPP budget in large firms is allocated to custom integrations and mapping rather than to scalable product features, and pushing many buyers to delay multi-plant rollouts by 12–24 months until standards stabilize.
Strategically, this fragmentation forces DPP vendors to maintain parallel connectors and data schemas, raising their own cost-to-serve by roughly 10–20% and encouraging architectures that prioritize modular, standards-agnostic middleware over tightly coupled vertical solutions, which tempers short-term revenue growth but positions the ecosystem for more durable, cross-industry platforms once interoperability frameworks solidify.
Opportunities
| Opportunity | (~) % CAGR | Geographic Relevance | Execution Window |
|---|---|---|---|
| End-to-end lifecycle data monetization | +6.0% | Global, especially EU-linked supply chains | Medium term (2–4 years) |
| Expansion beyond EU-regulated sectors | +4.2% | North America, APAC, Latin America | Long term (≥ 4 years) |
| Circular business models enablement | +3.8% | Europe, developed Asia | Medium to long term (3–5 years) |
| SME-focused low-cost DPP platforms | +3.0% | EU and emerging markets | Short to medium term (1–3 years) |
| Integration with ESG finance and insurance | +2.6% | Global financial centers | Medium term (2–4 years) |
| White-label solutions for industry associations | +2.1% | Sectoral clusters worldwide | Medium term (2–4 years) |
End-to-end lifecycle data monetization
While current DPP rollouts are primarily compliance-driven, there is substantial untapped upside in monetizing the granular lifecycle data captured under ESPR and battery passport requirements, with early EU battery passport pilots already generating datasets on manufacturing, usage, repair, second life, and recycling stages for tens of thousands of units ahead of the February 18, 2027 mandate.
By evolving from static records to analytics layers, vendors can help OEMs reduce warranty costs by an estimated 5–10% and cut recall-related logistics expenses per affected unit by 15–25% using precise batch-level traceability, creating room for subscription tiers priced on a per-asset or per-report basis and yielding an incremental CAGR upside of roughly +6.0% over the baseline as value shifts from pure compliance to performance optimization.
Over the medium term, integration of DPP data with ecosystem partners such as recyclers and refurbishers can unlock additional margin expansion of 2–4 percentage points for OEMs through higher residual values and more efficient material recovery, strengthening the business case for DPP platforms that bundle compliance with advanced analytics, benchmarking, and resale or recycling marketplace functionality.
Key Players Analysis
Tier-1 companies in the Digital Product Passport market include major enterprise software, cloud, and industrial technology providers that integrate passport functions into ERP, PLM, and supply chain platforms. SAP reported 2025 revenue of €36.8 billion, including €21.0 billion from cloud services, equal to 57% of total revenue, while its cloud backlog reached €77 billion.
IBM, Microsoft, Oracle, Siemens, and Accenture also hold strong positions, collectively generating more than USD 300 billion from software, cloud, and digital services in 2025. Oracle recorded FY2025 revenue of USD 57.4 billion, with cloud contributing 43%, while R&D spending reached USD 9.9 billion. Microsoft generated USD 46.7 billion in cloud revenue, representing 27% year-on-year growth, and invested USD 24.2 billion mainly in cloud and AI infrastructure.
Together, Tier-1 providers are estimated to account for 55% to 65% of related platform and integration revenue. Tier-2 companies include DNV, AVL, iPoint-systems, Circularise, Minespider, Optel Group, Kezzler, Atos/Eviden, and Spherity. These firms generally operate within the USD 100 million to USD 1,000 million annual revenue range and focus on traceability, sustainability, certification, blockchain, and regulatory compliance.
They often allocate around 10% to 15% of revenue to R&D and product development. Tier-2 providers are estimated to capture 35% to 45% of Digital Product Passport software, consulting, and certification revenue, particularly across batteries, textiles, plastics, metals, chemicals, electronics, and packaged goods.
Top Key Players in the Market
- SAP (Germany)
- Siemens (Germany)
- IBM (US)
- Microsoft (US)
- Oracle (US)
- Accenture (Ireland)
- Atos/Eviden (France)
- DNV (US/Norway)
- AVL (Austria)
- iPoint-systems (Germany)
- Circularise (Netherlands)
- Minespider (Germany)
- Optel Group (Canada)
- Kezzler (Norway)
- Spherity (Germany)
Recent Developments
- In March 2026, Minespider and TETHYS launched a Digital Product Passport pilot at the Çataltepe polymetallic mining project in Türkiye. The system records product origin, processing information, ESG indicators, and shipment-level chain-of-custody data. The mine is expected to process approximately 15,000 tonnes of ore each month and produce around 1,000 to 1,200 tonnes of concentrate.
- In May 2025, BASF announced Path. Era, a scalable digital battery passport ecosystem developed using Catena-X standards and made available through Cofinity-X. The platform supports secure and standardized battery data exchange, easier supplier onboarding, reduced manual data handling, regulatory compliance, and improved traceability across the battery value chain.
Report Scope
| Report Features | Description |
|---|---|
| Market Value (2025) | USD 253.2 Million |
| Forecast Revenue (2035) | USD 6,704.9 Million |
| CAGR (2026–2035) | 38.8% |
| Base Year for Estimation | 2025 |
| Historic Period | 2020-2024 |
| Forecast Period | 2026-2035 |
| Report Coverage | Revenue Forecast, Market Dynamics, Competitive Landscape, Recent Developments |
| Segments Covered | By Offering (Software, Services); By Implementation Type/Deployment (Cloud-based, On-premises); By Lifecycle Stage (Product design, Production, Distribution, Usage/in-service, End-of-life); By Industry Vertical (Consumer electronics, Automotive, Textiles and fashion, Food and beverage, Others) |
| Regional Analysis | North America – US, Canada; Europe – Germany, France, The UK, Spain, Italy, Rest of Europe; Asia Pacific – China, Japan, South Korea, India, Australia, Singapore, Rest of APAC; Latin America – Brazil, Mexico, Rest of Latin America; Middle East & Africa – GCC, South Africa, Rest of MEA |
| Competitive Landscape | SAP, Siemens, IBM, Microsoft, Oracle, Accenture, Atos/Eviden, DNV, AVL, iPoint-systems, Circularise, Minespider, Optel Group, Kezzler, Spherity |
| Customization Scope | Customization for segments, region/country-level will be provided. Moreover, additional customization can be done based on the requirements. |
| Purchase Options | We have three licenses to opt for: Single User License, Multi-User License (Up to 5 Users), Corporate Use License (Unlimited Users and Printable PDF) |





























