


Report Overview
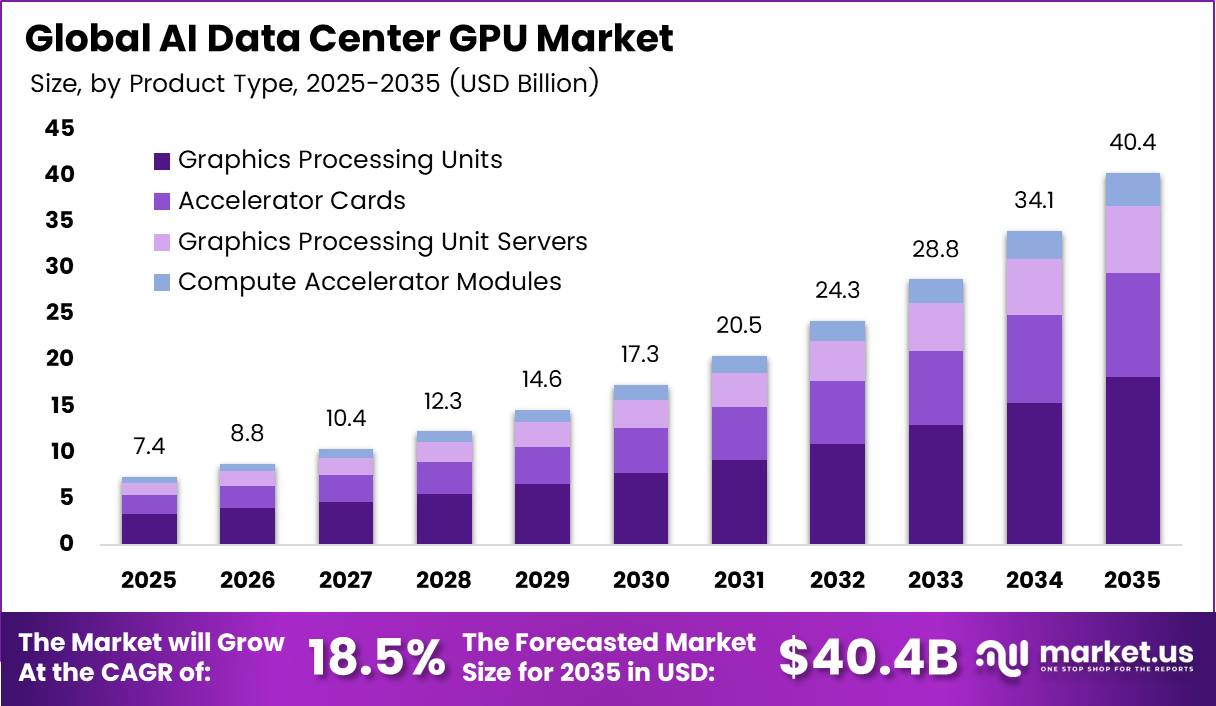
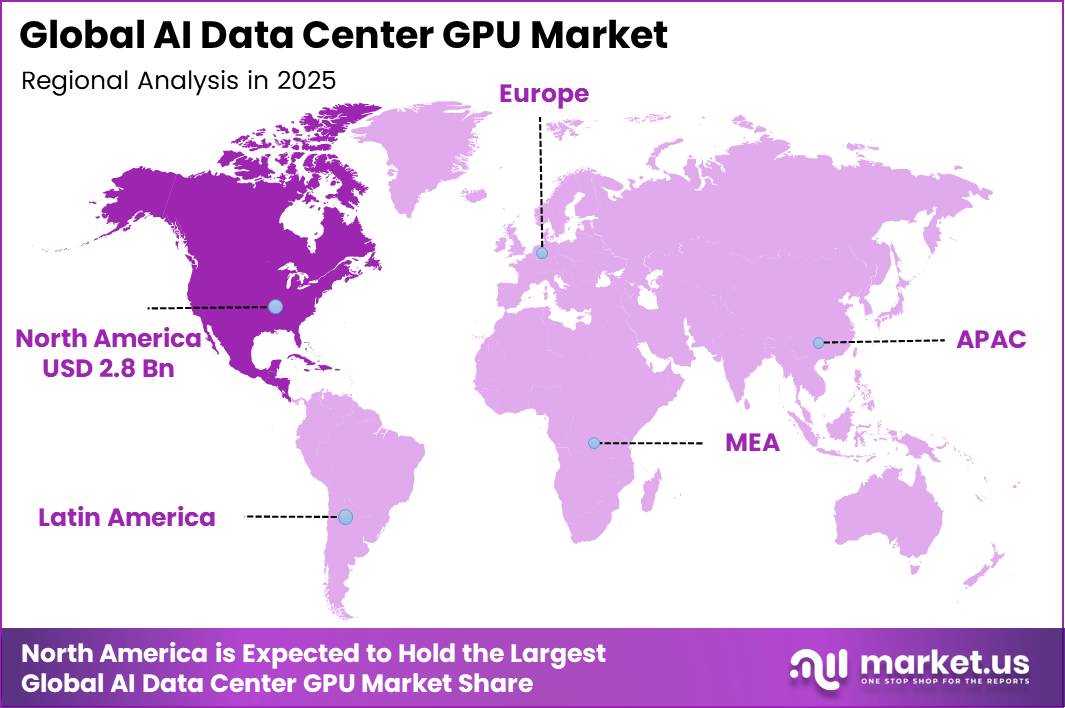
In 2025, the Global AI Data Center GPU Market was valued at USD 7.4 billion. The market is projected to grow at a CAGR of 18.5% during 2026–2035, reaching approximately USD 40.4 billion by 2035. North America dominated the global market in 2025, accounting for more than 37.7% of the total market share and generating approximately USD 2.8 billion in revenue.
The data center build-out for AI drives this growth. The IEA reported that global data center power use will roughly double from 415 TWh in 2024 to about 945 TWh by 2030. That equals just under 3% of all power used in the world. The IEA also expects power use in accelerated servers, which run mostly on GPUs, to grow 30% each year.
Power use in regular servers will grow only 9% each year. Accelerated servers will cover almost half of the net rise in data center power demand. Each new AI facility needs dense GPU clusters, so higher power demand points straight to higher GPU spending. A regular data center draws 10 to 25 MW. A large AI facility can draw more than 100 MW.
North America region hosts the biggest cloud and AI model builders. The IEA found that the United States and China together will make up nearly 80% of global data center power growth to 2030. Berkeley Lab, part of the US Department of Energy, projects that AI data centers will drive more than 40% of US power demand growth through 2030.
Key Takeaways
- The Global AI Data Center GPU Market reached USD 7.4 billion in 2025 and will reach USD 40.4 billion by 2035. grow at a CAGR of 18.5% from 2026 to 2035.
- Graphics Processing Units lead the Product Type segment with a 24.3% share.
- Inference leads the Function segment with a 71.2% share.
- Cloud leads the Deployment Mode segment with a 62.3% share and is also the fastest-growing sub-segment.
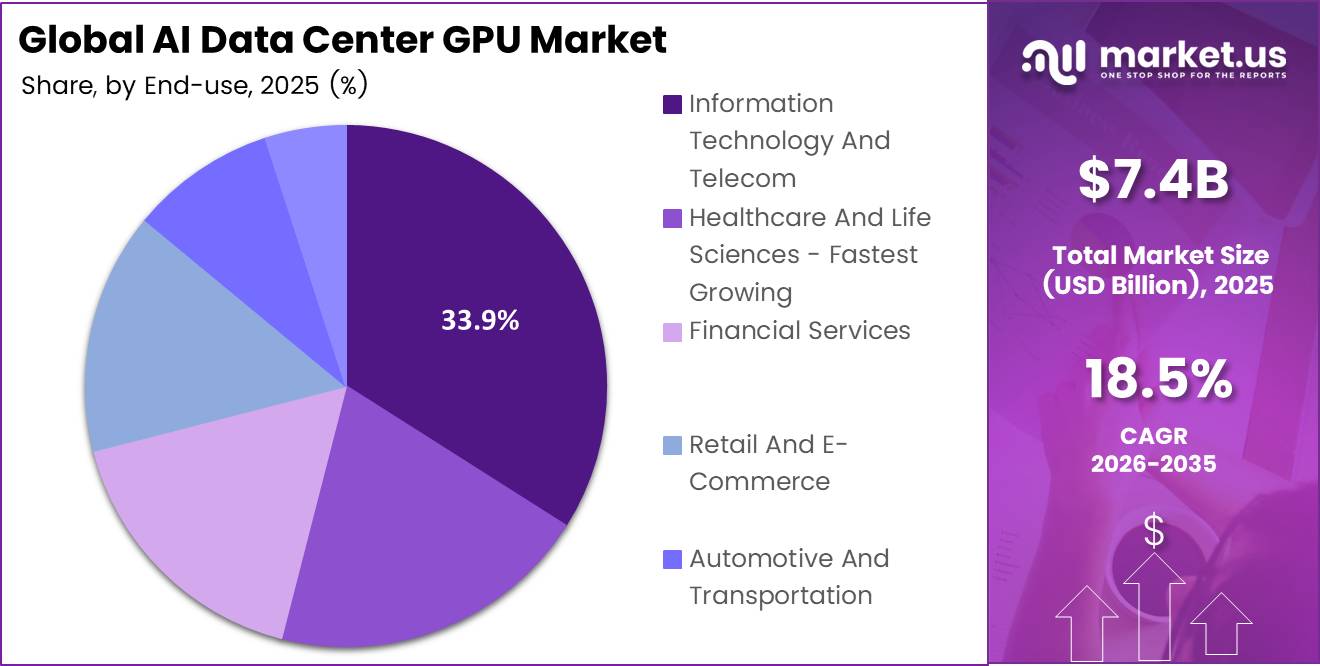
- Information Technology and Telecom leads the End User Industry segment with a 33.9% share.
- North America leads with a 37.7% share and USD 2.8 billion in revenue.
By Product Type
Graphics Processing Units dominate with 24.3% due to mature software support across AI workloads.
Accelerator Cards are growing fastest as buyers want more speed for each watt and each rack. NVIDIA posted record quarterly Data Center revenue of $62.3 billion in the fourth quarter, up 75% from a year earlier. Cloud firms and large companies add plug-in cards to their current servers to raise output without building new halls.
Fast links between chips also push this shift. NVIDIA’s Data Center networking revenue jumped 142% as NVLink connections spread across GB200 and GB300 systems. These links let many cards work as one large engine. Server makers now design around dense card setups, which keeps demand for accelerator cards rising quickly.
By Function
Inference dominates with 71.2% due to daily use of live AI apps.
Inference holds the largest share because every chatbot reply, search answer, and code suggestion runs on inference chips. Microsoft says its AI business passed $37 billion in annual revenue run rate, up 123%. Each new user adds steady, round-the-clock compute load.
Training is growing faster as model builders race to release larger and smarter models. The IEA projects that electricity use in accelerated servers will grow 30% per year, against only 9% for regular servers. Training runs drive much of that power demand because they keep thousands of chips busy for weeks at a time.
By Deployment Mode
Cloud dominates with 62.3% due to hyperscaler spending on rented GPU capacity.
Cloud leads because most firms prefer to rent GPU power rather than buy costly hardware. Microsoft’s fiscal 2026 capital spending reached about $115.95 billion, up 79.6%. In one quarter, roughly two-thirds of its $31.9 billion capex went to short-lived assets, mainly GPUs and CPUs.
Cloud is also the fastest-growing mode, because buyers can scale up in hours instead of waiting months for chips. Microsoft Cloud revenue hit $54.5 billion in one quarter, up 29%. Pay-as-you-go pricing lets startups and mid-sized firms test AI without high upfront costs.
The spending plans stay large. Microsoft expects to invest roughly $190 billion in calendar 2026, including about $25 billion linked to higher component prices. On-premises setups still serve banks and defence users with strict data rules. Even so, cloud keeps winning new workloads because of its speed and flexibility.
By End User Industry
Information Technology and Telecom dominates with 33.9% due to large data centre and network ownership.
IT and telecom firms lead because they own and run most of the world’s data centres. The IEA puts data centre power use at about 415 terawatt hours in 2024, roughly 1.5% of global electricity. That demand has grown 12% a year over the past five years, mostly driven by tech and telecom operators.
Healthcare and life sciences are growing fastest as hospitals and drug makers put AI into daily work. The US FDA list covers 1,357 AI-enabled medical devices cleared or approved through December 2025. Imaging, drug discovery, and genomics all need heavy GPU compute to train and run their models.
Large funding moves add to this demand. NVIDIA announced commitments worth $1 billion to build US capacity for research in fields including healthcare. As more medical tools reach approval, hospitals and research groups will keep buying GPU capacity.
Key Market Segments
By Product Type
- Graphics Processing Units
- Accelerator Cards
- Graphics Processing Unit Servers
- Compute Accelerator Modules
By Function
- Inference
- Training
By Deployment Mode
- On-premises
- Cloud
By End User Industry
- Information Technology And Telecom
- Healthcare And Life Sciences
- Financial Services
- Retail And E-Commerce
- Automotive And Transportation
- Research And Academia
Geopolitical Impact Analysis
Export controls now shape where GPUs can ship. In April 2025, the US government required licenses for NVIDIA H20 chips going to China. NVIDIA reported a charge of about USD 4.5 billion for excess H20 stock and purchase commitments in its Q1 FY2026 SEC filing. Sales to customers based outside the United States fell to 31% of NVIDIA revenue in FY2026, down from 48% in FY2024.
Raw material curbs add cost risk. In December 2024, China banned exports of gallium and germanium to the United States. China supplies about 98% of the world’s primary gallium, according to US Geological Survey data. GPU makers use these metals in power parts, optical links, and the compound chips inside AI networking gear.
Shipping problems stretch delivery times. UNCTAD reported that Red Sea attacks cut Suez Canal transits by more than 50% from their peak. Ships that go around the Cape of Good Hope add about 10 to 14 days to Asia-to-Europe trips. Most GPU servers come out of factories in Taiwan, Mexico, and Southeast Asia, so these delays slow rack deliveries to European data centers.
Tariffs raise system prices. In 2025, US trade actions under Section 232 targeted semiconductors and gave exemptions to firms that build in the US. Copper, which data center power and cooling systems use heavily, reached record prices in 2025, according to World Bank commodity tracking. Higher input costs push up the total cost of each AI cluster.
Regional Analysis
North America dominates the AI Data Center GPU Market, holding a 37.7% share and generating USD 2.8 billion in revenue. The United States hosts Microsoft, Alphabet, Oracle, and the largest AI labs. These firms buy GPUs in very large volumes. The IEA expects US data centers to account for nearly half of US power demand growth through 2030.
The CHIPS and Science Act set aside USD 52.7 billion to rebuild US chip production, which cuts supply risk for buyers in the region. Canada adds its own demand through its national AI compute strategy and low-cost hydro power. Power stays the main limit in this region. US utilities face long waits for new grid connections in key hubs such as Northern Virginia.
Asia Pacific is a key growth engine, led by China, Japan, South Korea, and India. Taiwan makes most of the world’s advanced AI chips through TSMC. China keeps building data centers fast but must rely more on local chips because of US export limits.
Key Regions and Countries
North America
- US
- Canada
Europe
- Germany
- France
- The UK
- Spain
- Italy
- Rest of Europe
Asia Pacific
- China
- Japan
- South Korea
- India
- Australia
- Rest of APAC
Latin America
- Brazil
- Mexico
- Rest of Latin America
Middle East and Africa
- GCC
- South Africa
- Rest of MEA
Market Dynamics
Drivers
| Driver | (~) % Impact on CAGR Forecast | Geographic Relevance | Impact Timeline |
|---|---|---|---|
| Hyperscaler AI capacity expansion | +1.3% | Global; North America-led | Short term (2 years or less) |
| Production inference workload growth | +0.9% | Global cloud markets | Short term (2 years or less) |
| Frontier-model training intensity | +0.7% | United States, Europe, China | Medium term (2 to 4 years) |
| Installed accelerator refresh cycles | +0.5% | Established hyperscale regions | Short term (2 years or less) |
| Established scientific-computing migration | +0.4% | North America, Europe, Japan | Medium term (2 to 4 years) |
Hyperscaler AI capacity expansion
Hyperscalers’ committed infrastructure programs convert AI experimentation into sustained GPU procurement and shift cloud business models toward reserved accelerator capacity and managed AI services.
According to Meta’s engineering disclosures in 2024, the company introduced clusters containing 24,576 GPUs and targeted 350,000 NVIDIA H100 GPUs by year-end, within a fleet approaching 600,000 H100-equivalents; these were disclosed deployment targets, not independently verified final installation counts.
According to Microsoft’s annual report for 2025, it added more than 2 GW of capacity and operated more than 400 data centers across 70 regions, although those infrastructure metrics encompass more than GPU-only installations. NVIDIA’s fiscal 2025 disclosures identify production Blackwell system shipments beginning in the fourth quarter, connecting capacity commitments to a commercially shipping architecture transition.
The analyst-estimated contribution is +1.3 percentage points relative to the supplied 18.5% baseline CAGR, rather than an observed causal statistic. All table percentages represent conditional percentage-point sensitivities: Drivers total +3.8 points, Opportunities total +2.3 points, Restraints total -3.0 points, and Challenges total -2.3 points; mechanically adding all sensitivities produces 19.3%, while positive-only and negative-only stress cases produce 24.6% and 13.2%, respectively.
Restraints
| Restraint | (~) % Impact on CAGR Forecast | Geographic Relevance | Impact Timeline |
|---|---|---|---|
| Advanced-computing export licensing barriers | -1.1% | China, Macau; restricted-parent entities globally | Short term (2 years or less) |
| Unavailable firm grid connections | -0.7% | Power-constrained data center hubs | Medium term (2 to 4 years) |
| Unfinanceable independent GPU projects | -0.5% | Debt-dependent operators globally | Short term (2 years or less) |
| Customer substitution with captive ASICs | -0.4% | Large hyperscaler procurement markets | Medium term (2 to 4 years) |
| Site-level development prohibitions | -0.3% | Land- and water-constrained jurisdictions | Medium term (2 to 4 years) |
Advanced-computing export licensing barriers
Export licensing creates a direct transaction barrier rather than merely an implementation delay: affected GPU shipments cannot proceed without the required authorization. According to the U.S. Bureau of Industry and Security’s April 2024 clarification, its advanced-computing controls reinforce restrictions introduced, including controls on products incorporating regulated integrated circuits.
The analyst-estimated -1.1 percentage-point sensitivity against the supplied 18.5% baseline captures conditional lost sales, not a blanket assumption that every China-related transaction is prohibited; authorization outcomes and eligible products remain transaction-specific.
Challenges
| Challenge | (~) % CAGR Friction Drag | Geographic Relevance | Mitigation Horizon |
|---|---|---|---|
| Advanced Packaging Capacity Synchronization | -0.8% | Taiwan-centered supply chain; global buyers | Medium term (2 to 4 years) |
| Distributed Cluster Networking Efficiency | -0.5% | Global large-cluster deployments | Medium term (2 to 4 years) |
| Liquid Cooling Retrofit Complexity | -0.4% | Existing data center estates globally | Medium term (2 to 4 years) |
| Accelerator Software Portability Friction | -0.3% | Multivendor enterprise deployments | Medium term (2 to 4 years) |
| Specialist Operations Talent Shortages | -0.3% | Established and emerging AI hubs | Long term (4 years or more) |
Advanced Packaging Capacity Synchronization
The structural vulnerability lies in coordinating accelerator die production, advanced packaging, and complete-system acceptance: additional wafer output does not become deployable GPU capacity unless downstream integration expands in step.
According to Meta’s engineering disclosures in 2024, its large training-cluster designs each contained 24,576 GPUs, making synchronization commercially consequential because deployment occurs at substantial cluster scale. The analyst-estimated friction is -0.8 percentage points relative to the supplied 18.5% baseline, assigned only to packaging and integration synchronization, not to grid-access prohibitions or export restrictions counted elsewhere.
Opportunities
| Opportunity | (~) % Potential CAGR Upside | Geographic Relevance | Execution Window |
|---|---|---|---|
| Confidential AI service monetization | +0.8% | Regulated enterprise markets globally | Medium term (2 to 4 years) |
| Industrial digital-twin service expansion | +0.5% | Manufacturing-intensive economies | Medium term (2 to 4 years) |
| Regional shared-compute consortia | +0.4% | Underserved enterprise regions; India, Southeast Asia | Medium term (2 to 4 years) |
| Certified secondary-life GPU services | +0.3% | Price-sensitive enterprise markets | Medium term (2 to 4 years) |
| GPU-native database acceleration services | +0.3% | Data-intensive enterprise markets globally | Long term (4 years or more) |
Confidential AI service monetization
The untapped opportunity is not the invention of confidential GPUs, which already exist, but converting sensitive workloads still withheld from shared infrastructure into recurring, attested AI services with workload-specific commercial guarantees.
According to NVIDIA’s technical analysis, raw GPU computation and memory bandwidth can remain comparable to non-confidential execution, but CPU–GPU encrypted transfer bandwidth was approximately 4 GB/s in the described configuration, making workload selection essential.
For deliberately selected compute-heavy workloads, an analyst scenario not a source-reported outcome assumes a 10% service-price premium, baseline delivery costs equal to 70% of revenue, and a 5% increase in delivery cost per completed job: gross margin would rise from 30% to approximately 33.2%, an expansion of about 3.2 percentage points.
The conditional market upside is +0.8 percentage points above the supplied 18.5% baseline only if providers secure genuinely incremental regulated workloads, demonstrate acceptable performance, and monetize assurance through service contracts; repackaging existing GPU workloads would not constitute incremental market growth.
Key Players Analysis
NVIDIA leads Tier 1 by a wide margin. The company posted FY2026 revenue of USD 215.9 billion, up 65%. Data Center revenue grew 68%, and fourth-quarter Data Center revenue hit USD 62.3 billion. In Q2 FY2027, NVIDIA reported Data Center revenue of USD 89.0 billion, up 117%. Data Center networking grew 142% in FY2026 as NVLink fabric for GB200 and GB300 systems ramped up.
AMD holds the second spot among GPU vendors. It posted 2025 revenue of USD 34.6 billion, up 34%, and Data Center revenue of USD 16.6 billion. AMD closed its USD 4.9 billion purchase of ZT Systems in March 2025 to build full rack-scale AI systems.
Hyperscalers also act as Tier 1 players because they buy GPUs and design their own chips. Microsoft, Alphabet, and Oracle each guided to capital spending of tens of billions of dollars a year to expand AI data centers. Alphabet designs its own TPU chips, and Microsoft builds its own Maia accelerators. Broadcom supplies custom AI chips and networking parts to these cloud firms.
Tier 2 challengers include Intel, Qualcomm, Huawei, and Inspur. Intel took a USD 5 billion equity investment from NVIDIA in September 2025 to co-develop data center products. Huawei sells Ascend chips into China as US limits restrict NVIDIA sales there. Inspur ranks among the largest AI server makers in China.
Top Key Players in the Market
- NVIDIA Corporation
- Intel Corporation
- Microsoft Corporation
- Broadcom Inc.
- Qualcomm Incorporated
- Advanced Micro Devices Inc.
- Huawei Technologies Co. Ltd.
- Alphabet Inc. (Google LLC)
- Oracle Corporation
- Inspur Electronic Information Industry Co. Ltd.
Recent Developments
- In March 2025, AMD completed its purchase of ZT Systems for about USD 4.9 billion to add rack-scale AI system design skills. AMD and OpenAI agreed to deploy 6 GW of AMD Instinct GPUs, starting with 1 GW of MI450 chips in the second half of 2026.
- In September 2025, NVIDIA and OpenAI signed a letter of intent to deploy at least 10 GW of NVIDIA systems, and NVIDIA plans to invest up to USD 100 billion in OpenAI as that capacity goes live. NVIDIA reported record FY2026 revenue of USD 215.9 billion and fourth-quarter Data Center revenue of USD 62.3 billion.
Report Scope
| Report Features | Description |
|---|---|
| Market Value (2025) | USD 7.4 Billion |
| Forecast Revenue (2035) | USD 40.4 Billion |
| CAGR (2026-2035) | 18.5% |
| Base Year for Estimation | 2025 |
| Historic Period | 2020-2024 |
| Forecast Period | 2026-2035 |
| Report Coverage | Revenue Forecast, Market Dynamics, Competitive Landscape, Recent Developments |
| Segments Covered | By Product Type (Graphics Processing Units, Accelerator Cards, Graphics Processing Unit Servers, Compute Accelerator Modules); By Function (Inference, Training); By Deployment Mode (On-premises, Cloud); By End User Industry (Information Technology And Telecom, Healthcare And Life Sciences, Financial Services, Retail And E-Commerce, Automotive And Transportation, Research And Academia) |
| Regional Analysis | North America – US, Canada; Europe – Germany, France, The UK, Spain, Italy, Rest of Europe; Asia Pacific – China, Japan, South Korea, India, Australia, Singapore, Rest of APAC; Latin America – Brazil, Mexico, Rest of Latin America; Middle East & Africa – GCC, South Africa, Rest of MEA |
| Competitive Landscape | NVIDIA Corporation, Intel Corporation, Microsoft Corporation, Broadcom Inc., Qualcomm Incorporated, Advanced Micro Devices Inc., Huawei Technologies Co. Ltd., Alphabet Inc. (Google LLC), Oracle Corporation, Inspur Electronic Information Industry Co. Ltd. |
| Customization Scope | Customization for segments, region/country-level will be provided. Moreover, additional customization can be done based on the requirements. |
| Purchase Options | We have three licenses to opt for: Single User License, Multi-User License (Up to 5 Users), Corporate Use License (Unlimited Users and Printable PDF) |





























