• email inquiry@market.us
  • phone+1 718 618 4351 (International)
  • phone+91 78878 22626 (Asia)
  • About Us
  • Contact Us
menu One Stop Shop For Reports One Stop Shop For Reports
search more_vert
  • Home
  • All Reports
  • All Sectors
  • Infographics
  • News Media
    • United States
    • United Kingdom
    • Asia Pacific
  • Who Trust Us
Home / Reports / Data Center Server Market
  • Home / Reports / Data Center Server Market

Global Data Center Server Market By Type (Tower Server, Rack Server, and Blade Server), By Application (Industrial Servers, and Commercial Servers), By Region, and Key Companies - Industry Segment Outlook, Market Assessment, Competition Scenario, Trends and Forecast 2020-2029

  • Overview
  • Table of Contents
  • Major Market Players
  • Inquiry Before Buying
  • account_circleAbout Me
    • 65518
    • $3,495.00
    • $5,100.00
    • $7,200.00
    Buy Now

    “Global Data Center Server Market” is the title of an upcoming report offered by Market.US. This report on the data center server industry contains information and data, and inputs from both primary and secondary data sources, that have been verified and validated by experts in the target market. It also covers threats or challenges for existing as well as new entrants in the market. The report presents a thorough study of revenues, historical data, and information, key developments, and strategies by major players that offer vital insights and perspectives in to various scenarios market. Besides critical data and related information, the report includes key trends (both present and future), factors that are driving market growth, factors that are or could be potential restraints to market growth, as well as opportunities that can be leveraged for potential revenue generation in untapped regions and countries. The global data center server market has been segmented on the basis of server type, application, as well as regions and countries.

    The Data Center Server Market was valued at UЅD $61,502.4 Мn in 2020, and is projected to register а САGR of 13.1% over the next 10 years.

    Overview:

    Request Covid - 19 Impact

    A data center is a building, a dedicated space within a building, or a group of buildings used to house computer systems and associated components such as servers, routers, storage systems, security devices, etc.

    Dynamics:

    Due to the numerous advancements in emerging technologies, and the ever-growing need to cater to complex computing requirements such as Internet of Things (IoT), big data analytics, etc., is increasing the demand for high-density servers. This factor is expected to significantly boost the revenue growth of the global data center server market over the next 10 years.

    Hyperscalers such as Google, Amazon, Facebook, etc., invest significantly in the revamping and expansion of existing data centers, as well as the construction of new data center infrastructure to expand their business into numerous related verticals. This is also slated to be a major factor that is anticipated to positively influence the growth of this global market.

    In light of the recent COVID-19 outbreak, the operations of key industry players have either been temporarily halted or are functioning with a minimal workforce. This is a factor that is expected to have a profound impact on the growth of this market in the coming years. Moreover, the shortage of server components and higher lead times in server delivery, is another factor that may impede on future growth.

    Nonetheless, the adoption of application-specific, custom servers by companies to boost the computing power of conventional systems is another factor that is expected to fuel further market growth for the global data center server market in the foreseeable future.

    Furthermore, the steady rise in the adoption of data center servers among individuals owing to the fact that these devices have a high cache memory and storage capacity, is also slated to have an impact on this global market’s future footprint.

    Segmentation of the global data center server market is as follows:

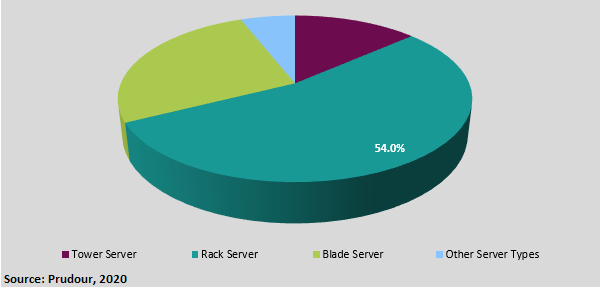
    On the basis of server type, the rack server segment accounted for the maximum number of revenue shares (54%) of the global data center server market in 2020, and is anticipated to index the highest CAGR over the forecast period. The tower server segment also accounted for considerable revenue shares of this global market in 2020, and is slated to continue to do so over the next 10 years.

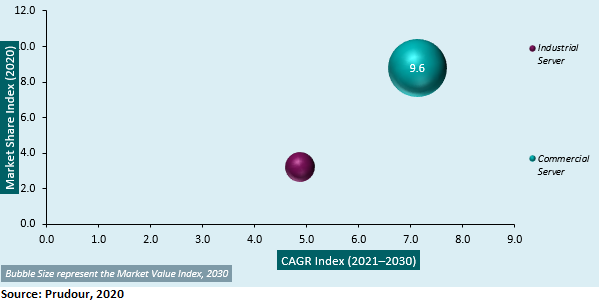
    In terms of application, the commercial server segment accounted for the majority revenue shares of the global data center server market in 2020, and is projected to index the highest CAGR of 13%, with an attractiveness index of 9.6, over the forecast period. The industrial server segment accounted for a considerable number of revenue shares in 2020, and is expected to continue to do so in the coming years.

    Regional Segmentation and Analysis:

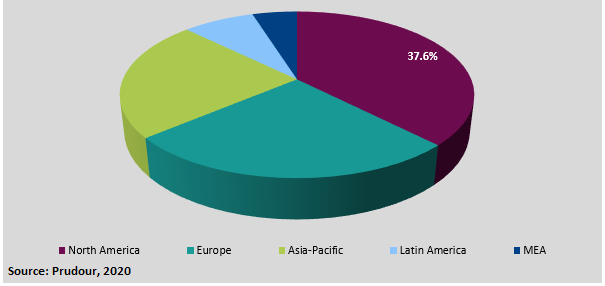
    North America accounted for the majority number of revenue shares (37%) of the global data center server market in 2020, and is anticipated to remain this market’s front-runner for the remainder of this forecast period. The markets in Europe accounted for a considerable number of revenue shares in 2020, and is indicative of continuing to do so in the near future.

    Segmentation of the Global Data Center Server Market:

    Segmentation by Server Type:

    • Tower Server
    • Rack Server
    • Blade Server
    • Other Server Types

    Segmentation by Application:

    • Industrial Server
    • Commercial Server

    Segmentation by Region:

    • North America
    • Europe
    • Asia Pacific
    • Latin America
    • Middle East & Africa

     Key players profiled in the market report are:

    • Huawei Technologies Co. Ltd.
    • Dell Technologies Inc.
    • International Business Machines Corp. (IBM)
    • Cisco Systems Inc.
    • Lenovo Group Ltd.
    • Oracle Corporation
    • Fujitsu Ltd.
    • NEC Corporation
    • Hewlett Packard Enterprise Co.
    • Bull Atos Technologies
    • Super Micro Computer Inc.
    • Inspur Group Co. Limited (Inspur)

    For the Data Center Server Market research study, the following years have been considered to estimate the market size:

    Particular Scope
    Region

    • North America
    • Europe
    • Asia Pacific
    • Latin America
    • Middle East and Africa
    Historic Year 2015 to 2020
    Estimated Year 2021
    Forecast Year 2022 to 2031

    Data Center Server Market

    add_shopping_cartBuy Now get_appDownload Sample
    keyboard_arrow_up
  • account_circleAbout Me
    • 65518
    • $3,495.00
    • $5,100.00
    • $7,200.00
    Buy Now
    • Chapter 1 Global Data Center Server Market
      • 1.1 Introduction
      • 1.2 Segmentation for Global Data Center Server Market, based on Server Type, Application, and Region
      • 1.3 Drivers for Global Data Center Server Market
      • 1.4 Restraints for Global Data Center Server Market
      • 1.5 Opportunities in, Global Data Center Server Market
      • 1.6 Trends in Global Data Center Server Market.
      • 1.7 PEST Analysis
      • 1.8 PORTER'S Five Forces Analysis
      • 1.9 Drivers & Restraints Impact Analysis
      • 1.1 Macroeconomic Factor
      • 1.11 Industry Chain Analysis
      • 1.12 Manufacturing Cost Structure Analysis
      • 1.13 Opportunity Map Analysis for Global Data Center Server Market
        • 1.13.1 Optimistic Scenario
        • 1.13.2 Likely Scenario
        • 1.13.3 Conservative Scenario
      • 1.14 Market Investment Feasibility Analysis
      • 1.15 Opportunity Orbits for Global Data Center Server Market
      • 1.16 Go to Market Strategy – Market Maturity
      • 1.17 Regional Market Share and BPS Analysis in Global Data Center Server Market
    • Chapter 2 Global Data Center Server Market Overview
      • 2.1 Global Data Center Server Market by Server Type
        • 2.1.1 Global Data Center Server Revenue (US$ Mn) Comparison by Server Type (2014-2030)
        • 2.1.2 Global Data Center Server Revenue (US$ Mn) Market Share by Server Type in 2020
        • 2.1.3 Global Data Center Server Market Attractiveness Analysis by Server Type, 2014–2030
      • 2.2 Global Data Center Server Market by Application
        • 2.2.1 Global Data Center Server Revenue (US$ Mn) Comparison by Application (2014-2030)
        • 2.2.2 Global Data Center Server Revenue (US$ Mn) Market Share by Application in 2020
        • 2.2.3 Global Data Center Server Market Attractiveness Analysis by Application, 2014–2030
      • 2.3 Global Data Center Server Market Outlook by Region
        • 2.3.1 Global Data Center Server Revenue (US$ Mn) Comparison by Region (2014-2030)
        • 2.3.2 Global Data Center Server Revenue (US$ Mn) Market Share by Region in 2020
        • 2.3.3 Global Data Center Server Market Attractiveness Analysis by Region, 2014–2030
      • 2.4 Global Data Center Server Market Outlook (2014–2030)
        • 2.4.1 Global Data Center Server Revenue (US$ Mn) (2014–2021)
        • 2.4.2 Global Data Center Server Revenue (US$ Mn) (2022–2030)
      • 2.5 Global Data Center Server Revenue (US$ Mn) by Regions
        • 2.5.1 Global Data Center Server Revenue (US$ Mn) Comparison by Region (2014–2021)
        • 2.5.2 Global Data Center Server Revenue (US$ Mn) Comparison by Region (2022–2030)
      • 2.6 Global Data Center Server Revenue (US$ Mn) by Server Type
        • 2.6.1 Global Data Center Server Revenue (US$ Mn) Comparison by Server Type (2014–2021)
        • 2.6.2 Global Data Center Server Revenue (US$ Mn) Comparison by Server Type (2022–2030)
      • 2.7 Global Data Center Server Revenue (US$ Mn) by Application
        • 2.7.1 Global Data Center Server Revenue (US$ Mn) Comparison by Application (2014–2021)
        • 2.7.2 Global Data Center Server Revenue (US$ Mn) Comparison by Application (2022–2030)
      • 2.8 Global Data Center Server Y-o-Y Growth Rate Comparison 2015–2030
        • 2.8.1 Global Data Center Server Y-o-Y Growth Rate by Region
        • 2.8.2 Global Data Center Server Market Y-o-Y Growth Rate by Server Type
        • 2.8.3 Global Data Center Server Y-o-Y Growth Rate by Application
      • 2.9 Global Data Center Server Share Comparison 2014–2030
        • 2.9.1 Global Data Center Server Share by Region
        • 2.9.2 Global Data Center Server Market Share by Server Type
        • 2.9.3 Global Data Center Server Share by Application
    • Chapter 3 North America Data Center Server Market Overview
      • 3.1 North America Data Center Server Market by Server Type
        • 3.1.1 North America Data Center Server Revenue (US$ Mn) Comparison by Server Type (2014-2030)
        • 3.1.2 North America Data Center Server Revenue (US$ Mn) Market Share by Server Type in 2020
        • 3.1.3 North America Data Center Server Market Attractiveness Analysis by Server Type, 2014–2030
      • 3.2 North America Data Center Server Market by Application
        • 3.2.1 North America Data Center Server Revenue (US$ Mn) Comparison by Application (2014-2030)
        • 3.2.2 North America Data Center Server Revenue (US$ Mn) Market Share by Application in 2020
        • 3.2.3 North America Data Center Server Market Attractiveness Analysis by Application, 2014–2030
      • 3.3 North America Data Center Server Market Outlook by Region
        • 3.3.1 North America Data Center Server Revenue (US$ Mn) Comparison by Region (2014-2030)
        • 3.3.2 North America Data Center Server Revenue (US$ Mn) Market Share by Region in 2020
        • 3.3.3 North America Data Center Server Market Attractiveness Analysis by Region, 2014–2030
      • 3.4 North America Data Center Server Market Outlook (2014–2030)
        • 3.4.1 North America Data Center Server Revenue (US$ Mn) (2014–2021)
        • 3.4.2 North America Data Center Server Revenue (US$ Mn) (2022–2030)
      • 3.5 North America Data Center Server Revenue (US$ Mn) by Regions
        • 3.5.1 North America Data Center Server Revenue (US$ Mn) Comparison by Region (2014–2021)
        • 3.5.2 North America Data Center Server Revenue (US$ Mn) Comparison by Region (2022–2030)
      • 3.6 North America Data Center Server Revenue (US$ Mn) by Server Type
        • 3.6.1 North America Data Center Server Revenue (US$ Mn) Comparison by Server Type (2014–2021)
        • 3.6.2 North America Data Center Server Revenue (US$ Mn) Comparison by Server Type (2022–2030)
      • 3.7 North America Data Center Server Revenue (US$ Mn) by Application
        • 3.7.1 North America Data Center Server Revenue (US$ Mn) Comparison by Application (2014–2021)
        • 3.7.2 North America Data Center Server Revenue (US$ Mn) Comparison by Application (2022–2030)
      • 3.8 North America Data Center Server Y-o-Y Growth Rate Comparison 2015–2030
        • 3.8.1 North America Data Center Server Y-o-Y Growth Rate by Region
        • 3.8.2 North America Data Center Server Market Y-o-Y Growth Rate by Server Type
        • 3.8.3 North America Data Center Server Y-o-Y Growth Rate by Application
      • 3.9 North America Data Center Server Share Comparison 2014–2029
        • 3.9.1 North America Data Center Server Share by Region
        • 3.9.2 North America Data Center Server Market Share by Server Type
        • 3.9.3 North America Data Center Server Share by Application
    • Chapter 4 Europe Data Center Server Market Overview
      • 4.1 Europe Data Center Server Market by Server Type
        • 4.1.1 Europe Data Center Server Revenue (US$ Mn) Comparison by Server Type (2014-2030)
        • 4.1.2 Europe Data Center Server Revenue (US$ Mn) Market Share by Server Type in 2020
        • 4.1.3 Europe Data Center Server Market Attractiveness Analysis by Server Type, 2014–2030
      • 4.2 Europe Data Center Server Market by Application
        • 4.2.1 Europe Data Center Server Revenue (US$ Mn) Comparison by Application (2014-2030)
        • 4.2.2 Europe Data Center Server Revenue (US$ Mn) Market Share by Application in 2020
        • 4.2.3 Europe Data Center Server Market Attractiveness Analysis by Application, 2014–2030
      • 4.3 Europe Data Center Server Market Outlook by Region
        • 4.3.1 Europe Data Center Server Revenue (US$ Mn) Comparison by Region (2014-2030)
        • 4.3.2 Europe Data Center Server Revenue (US$ Mn) Market Share by Region in 2020
        • 4.3.3 Europe Data Center Server Market Attractiveness Analysis by Region, 2014–2030
      • 4.4 Europe Data Center Server Market Outlook (2014–2030)
        • 4.4.1 Europe Data Center Server Revenue (US$ Mn) (2014–2021)
        • 4.4.2 Europe Data Center Server Revenue (US$ Mn) (2022–2030)
      • 4.5 Europe Data Center Server Revenue (US$ Mn) by Regions
        • 4.5.1 Europe Data Center Server Revenue (US$ Mn) Comparison by Region (2014–2021)
        • 4.5.2 Europe Data Center Server Revenue (US$ Mn) Comparison by Region (2022–2030)
      • 4.6 Europe Data Center Server Revenue (US$ Mn) by Server Type
        • 4.6.1 Europe Data Center Server Revenue (US$ Mn) Comparison by Server Type (2014–2021)
        • 4.6.2 Europe Data Center Server Revenue (US$ Mn) Comparison by Server Type (2022–2030)
      • 4.7 Europe Data Center Server Revenue (US$ Mn) by Application
        • 4.7.1 Europe Data Center Server Revenue (US$ Mn) Comparison by Application (2014–2021)
        • 4.7.2 Europe Data Center Server Revenue (US$ Mn) Comparison by Application (2022–2030)
      • 4.8 Europe Data Center Server Y-o-Y Growth Rate Comparison 2015–2030
        • 4.8.1 Europe Data Center Server Y-o-Y Growth Rate by Region
        • 4.8.2 Europe Data Center Server Market Y-o-Y Growth Rate by Server Type
        • 4.8.3 Europe Data Center Server Y-o-Y Growth Rate by Application
      • 4.9 Europe Data Center Server Share Comparison 2014–2029
        • 4.9.1 Europe Data Center Server Share by Region
        • 4.9.2 Europe Data Center Server Market Share by Server Type
        • 4.9.3 Europe Data Center Server Share by Application
    • Chapter 5 Asia-Pacific Data Center Server Market Overview
      • 5.1 Asia-Pacific Data Center Server Market by Server Type
        • 5.1.1 Asia-Pacific Data Center Server Revenue (US$ Mn) Comparison by Server Type (2014-2030)
        • 5.1.2 Asia-Pacific Data Center Server Revenue (US$ Mn) Market Share by Server Type in 2020
        • 5.1.3 Asia-Pacific Data Center Server Market Attractiveness Analysis by Server Type, 2014–2030
      • 5.2 Asia-Pacific Data Center Server Market by Application
        • 5.2.1 Asia-Pacific Data Center Server Revenue (US$ Mn) Comparison by Application (2014-2030)
        • 5.2.2 Asia-Pacific Data Center Server Revenue (US$ Mn) Market Share by Application in 2020
        • 5.2.3 Asia-Pacific Data Center Server Market Attractiveness Analysis by Application, 2014–2030
      • 5.3 Asia-Pacific Data Center Server Market Outlook by Region
        • 5.3.1 Asia-Pacific Data Center Server Revenue (US$ Mn) Comparison by Region (2014-2030)
        • 5.3.2 Asia-Pacific Data Center Server Revenue (US$ Mn) Market Share by Region in 2020
        • 5.3.3 Asia-Pacific Data Center Server Market Attractiveness Analysis by Region, 2014–2030
      • 5.4 Asia-Pacific Data Center Server Market Outlook (2014–2030)
        • 5.4.1 Asia-Pacific Data Center Server Revenue (US$ Mn) (2014–2021)
        • 5.4.2 Asia-Pacific Data Center Server Revenue (US$ Mn) (2022–2030)
      • 5.5 Asia-Pacific Data Center Server Revenue (US$ Mn) by Regions
        • 5.5.1 Asia-Pacific Data Center Server Revenue (US$ Mn) Comparison by Region (2014–2021)
        • 5.5.2 Asia-Pacific Data Center Server Revenue (US$ Mn) Comparison by Region (2022–2030)
      • 5.6 Asia-Pacific Data Center Server Revenue (US$ Mn) by Server Type
        • 5.6.1 Asia-Pacific Data Center Server Revenue (US$ Mn) Comparison by Server Type (2014–2021)
        • 5.6.2 Asia-Pacific Data Center Server Revenue (US$ Mn) Comparison by Server Type (2022–2030)
      • 5.7 Asia-Pacific Data Center Server Revenue (US$ Mn) by Application
        • 5.7.1 Asia-Pacific Data Center Server Revenue (US$ Mn) Comparison by Application (2014–2021)
        • 5.7.2 Asia-Pacific Data Center Server Revenue (US$ Mn) Comparison by Application (2022–2030)
      • 5.8 Asia-Pacific Data Center Server Y-o-Y Growth Rate Comparison 2015–2030
        • 5.8.1 Asia-Pacific Data Center Server Y-o-Y Growth Rate by Region
        • 5.8.2 Asia-Pacific Data Center Server Market Y-o-Y Growth Rate by Server Type
        • 5.8.3 Asia-Pacific Data Center Server Y-o-Y Growth Rate by Application
      • 5.9 Asia-Pacific Data Center Server Share Comparison 2014–2029
        • 5.9.1 Asia-Pacific Data Center Server Share by Region
        • 5.9.2 Asia-Pacific Data Center Server Market Share by Server Type
        • 5.9.3 Asia-Pacific Data Center Server Share by Application
    • Chapter 6 Latin America Data Center Server Market Overview
      • 6.1 Latin America Data Center Server Market by Server Type
        • 6.1.1 Latin America Data Center Server Revenue (US$ Mn) Comparison by Server Type (2014-2030)
        • 6.1.2 Latin America Data Center Server Revenue (US$ Mn) Market Share by Server Type in 2020
        • 6.1.3 Latin America Data Center Server Market Attractiveness Analysis by Server Type, 2014–2030
      • 6.2 Latin America Data Center Server Market by Application
        • 6.2.1 Latin America Data Center Server Revenue (US$ Mn) Comparison by Application (2014-2030)
        • 6.2.2 Latin America Data Center Server Revenue (US$ Mn) Market Share by Application in 2020
        • 6.2.3 Latin America Data Center Server Market Attractiveness Analysis by Application, 2014–2030
      • 6.3 Latin America Data Center Server Market Outlook by Region
        • 6.3.1 Latin America Data Center Server Revenue (US$ Mn) Comparison by Region (2014-2030)
        • 6.3.2 Latin America Data Center Server Revenue (US$ Mn) Market Share by Region in 2020
        • 6.3.3 Latin America Data Center Server Market Attractiveness Analysis by Region, 2014–2030
      • 6.4 Latin America Data Center Server Market Outlook (2014–2030)
        • 6.4.1 Latin America Data Center Server Revenue (US$ Mn) (2014–2021)
        • 6.4.2 Latin America Data Center Server Revenue (US$ Mn) (2022–2030)
      • 6.5 Latin America Data Center Server Revenue (US$ Mn) by Regions
        • 6.5.1 Latin America Data Center Server Revenue (US$ Mn) Comparison by Region (2014–2021)
        • 6.5.2 Latin America Data Center Server Revenue (US$ Mn) Comparison by Region (2022–2030)
      • 6.6 Latin America Data Center Server Revenue (US$ Mn) by Server Type
        • 6.6.1 Latin America Data Center Server Revenue (US$ Mn) Comparison by Server Type (2014–2021)
        • 6.6.2 Latin America Data Center Server Revenue (US$ Mn) Comparison by Server Type (2022–2030)
      • 6.7 Latin America Data Center Server Revenue (US$ Mn) by Application
        • 6.7.1 Latin America Data Center Server Revenue (US$ Mn) Comparison by Application (2014–2021)
        • 6.7.2 Latin America Data Center Server Revenue (US$ Mn) Comparison by Application (2022–2030)
      • 6.8 Latin America Data Center Server Y-o-Y Growth Rate Comparison 2015–2030
        • 6.8.1 Latin America Data Center Server Y-o-Y Growth Rate by Region
        • 6.8.2 Latin America Data Center Server Market Y-o-Y Growth Rate by Server Type
        • 6.8.3 Latin America Data Center Server Y-o-Y Growth Rate by Application
      • 6.9 Latin America Data Center Server Share Comparison 2014–2029
        • 6.9.1 Latin America Data Center Server Share by Region
        • 6.9.2 Latin America Data Center Server Market Share by Server Type
        • 6.9.3 Latin America Data Center Server Share by Application
    • Chapter 7 MEA Data Center Server Market Overview
      • 7.1 MEA Data Center Server Market by Server Type
        • 7.1.1 MEA Data Center Server Revenue (US$ Mn) Comparison by Server Type (2014-2030)
        • 7.1.2 MEA Data Center Server Revenue (US$ Mn) Market Share by Server Type in 2020
        • 7.1.3 MEA Data Center Server Market Attractiveness Analysis by Server Type, 2014–2030
      • 7.2 MEA Data Center Server Market by Application
        • 7.2.1 MEA Data Center Server Revenue (US$ Mn) Comparison by Application (2014-2030)
        • 7.2.2 MEA Data Center Server Revenue (US$ Mn) Market Share by Application in 2020
        • 7.2.3 MEA Data Center Server Market Attractiveness Analysis by Application, 2014–2030
      • 7.3 MEA Data Center Server Market Outlook by Region
        • 7.3.1 MEA Data Center Server Revenue (US$ Mn) Comparison by Region (2014-2030)
        • 7.3.2 MEA Data Center Server Revenue (US$ Mn) Market Share by Region in 2020
        • 7.3.3 MEA Data Center Server Market Attractiveness Analysis by Region, 2014–2030
      • 7.4 MEA Data Center Server Market Outlook (2014–2030)
        • 7.4.1 MEA Data Center Server Revenue (US$ Mn) (2014–2021)
        • 7.4.2 MEA Data Center Server Revenue (US$ Mn) (2022–2030)
      • 7.5 MEA Data Center Server Revenue (US$ Mn) by Regions
        • 7.5.1 MEA Data Center Server Revenue (US$ Mn) Comparison by Region (2014–2021)
        • 7.5.2 MEA Data Center Server Revenue (US$ Mn) Comparison by Region (2022–2030)
      • 7.6 MEA Data Center Server Revenue (US$ Mn) by Server Type
        • 7.6.1 MEA Data Center Server Revenue (US$ Mn) Comparison by Server Type (2014–2021)
        • 7.6.2 MEA Data Center Server Revenue (US$ Mn) Comparison by Server Type (2022–2030)
      • 7.7 MEA Data Center Server Revenue (US$ Mn) by Application
        • 7.7.1 MEA Data Center Server Revenue (US$ Mn) Comparison by Application (2014–2021)
        • 7.7.2 MEA Data Center Server Revenue (US$ Mn) Comparison by Application (2022–2030)
      • 7.8 MEA Data Center Server Y-o-Y Growth Rate Comparison 2015–2030
        • 7.8.1 MEA Data Center Server Y-o-Y Growth Rate by Region
        • 7.8.2 MEA Data Center Server Market Y-o-Y Growth Rate by Server Type
        • 7.8.3 MEA Data Center Server Y-o-Y Growth Rate by Application
      • 7.9 MEA Data Center Server Share Comparison 2014–2030
        • 7.9.1 MEA Data Center Server Share by Region
        • 7.9.2 MEA Data Center Server Market Share by Server Type
        • 7.9.3 MEA Data Center Server Share by Application
    • Chapter 8 Global Data Center Server Market Competitive Landscape
      • 8.1 Market Competition Scenario Analysis
      • 8.2 Overview of Major Market Players
      • 8.3 Company Profiles
        • 8.3.1 Huawei Technologies Co., Ltd.
          • 8.3.1.1 Company Overview
          • 8.3.1.2 Business Description
          • 8.3.1.3 Product Portfolio
          • 8.3.1.4 Key Financials
          • 8.3.1.5 Key Developments
          • 8.3.1.6 SWOT Analysis
        • 8.3.2 Dell Technologies Inc.
          • 8.3.2.1 Company Overview
          • 8.3.2.2 Business Description
          • 8.3.2.3 Product Portfolio
          • 8.3.2.4 Key Financials
          • 8.3.2.5 Key Developments
          • 8.3.2.6 SWOT Analysis
        • 8.3.3 International Business Machines Corp.
          • 8.3.3.1 Company Overview
          • 8.3.3.2 Business Description
          • 8.3.3.3 Product Portfolio
          • 8.3.3.4 Key Financials
          • 8.3.3.5 Key Developments
          • 8.3.3.6 SWOT Analysis
        • 8.3.4 Cisco Systems, Inc.
          • 8.3.4.1 Company Overview
          • 8.3.4.2 Business Description
          • 8.3.4.3 Product Portfolio
          • 8.3.4.4 Key Financials
          • 8.3.4.5 Key Developments
          • 8.3.4.6 SWOT Analysis
        • 8.3.5 Lenovo Group Ltd.
          • 8.3.5.1 Company Overview
          • 8.3.5.2 Business Description
          • 8.3.5.3 Product Portfolio
          • 8.3.5.4 Key Financials
          • 8.3.5.5 Key Developments
          • 8.3.5.6 SWOT Analysis
        • 8.3.6 Oracle Corporation
          • 8.3.6.1 Company Overview
          • 8.3.6.2 Business Description
          • 8.3.6.3 Product Portfolio
          • 8.3.6.4 Key Financials
          • 8.3.6.5 Key Developments
          • 8.3.6.6 SWOT Analysis
        • 8.3.7 Fujitsu Ltd.
          • 8.3.7.1 Company Overview
          • 8.3.7.2 Business Description
          • 8.3.7.3 Product Portfolio
          • 8.3.7.4 Key Financials
          • 8.3.7.5 Key Developments
          • 8.3.7.6 SWOT Analysis
        • 8.3.8 NEC Corporation
          • 8.3.8.1 Company Overview
          • 8.3.8.2 Business Description
          • 8.3.8.3 Product Portfolio
          • 8.3.8.4 Key Financials
          • 8.3.8.5 Key Developments
          • 8.3.8.6 SWOT Analysis
        • 8.3.9 Hewlett Packard Enterprise Co.
          • 8.3.9.1 Company Overview
          • 8.3.9.2 Business Description
          • 8.3.9.3 Product Portfolio
          • 8.3.9.4 Key Financials
          • 8.3.9.5 Key Developments
          • 8.3.9.6 SWOT Analysis
        • 8.3.10 Bull Atos Technologies
          • 8.3.10.1 Company Overview
          • 8.3.10.2 Business Description
          • 8.3.10.3 Product Portfolio
          • 8.3.10.4 Key Financials
          • 8.3.10.5 Key Developments
          • 8.3.10.6 SWOT Analysis
        • 8.3.11 Super Micro Computer Inc.
          • 8.3.11.1 Company Overview
          • 8.3.11.2 Business Description
          • 8.3.11.3 Product Portfolio
          • 8.3.11.4 Key Financials
          • 8.3.11.5 Key Developments
          • 8.3.11.6 SWOT Analysis
        • 8.3.12 Inspur Group Limited (Inspur)
          • 8.3.12.1 Company Overview
          • 8.3.12.2 Business Description
          • 8.3.12.3 Product Portfolio(Inspur)
          • 8.3.12.4 Key Developments
    • Chapter 9 Methodology and Data Source
      • 9.1 Methodology/Research Approach
        • 9.1.1 Market Size Estimation
      • 9.2 Market Breakdown and Data Triangulation
      • 9.3 Data Source
        • 9.3.1 Secondary Sources
        • 9.3.2 Primary Sources
      • 9.4 Appendix
  • ondemand_videoVideos
    • 65518
    • $3,495.00
    • $5,100.00
    • $7,200.00
    Buy Now
    • Huawei Technologies Co. Ltd.
    • Dell Technologies Inc.
    • International Business Machines Corp. (IBM)
    • Cisco Systems Inc.
    • Lenovo Group Ltd.
    • Oracle Corporation
    • Fujitsu Ltd.
    • NEC Corporation
    • Hewlett Packard Enterprise Co.
    • Bull Atos Technologies
    • Super Micro Computer Inc.
    • Inspur Group Co. Limited (Inspur)
  • settingsSettings

Our Clients

Subscribe

Subscribe Now

Request for Sample


  • 65518
  • $3,495.00
  • $5,100.00
  • $7,200.00
Buy Now
  • location_on420 Lexington Avenue, Suite 300 New York City, NY 10170,
    United States
  • phone+1 718 618 4351 (International)
  • phone+91 78878 22626 (Asia)
  • emailinquiry@market.us

Find Help

  • Contact Us
  • How to Order

Legal

  • Privacy Policy
  • Refund Policy
  • Frequently Asked Questions
  • Terms and Conditions

Explore

  • About Us
  • All Reports
  • All Sectors
  • Infographics
  • Statistics and Facts

Secured Payment Options

PayPal Payment System
Payoneer Payment System

© 2021 Market.Us. All Rights Reserved.

Share
Tweet
Share
Pin
0 Shares