
Quick Navigation
Market Overview
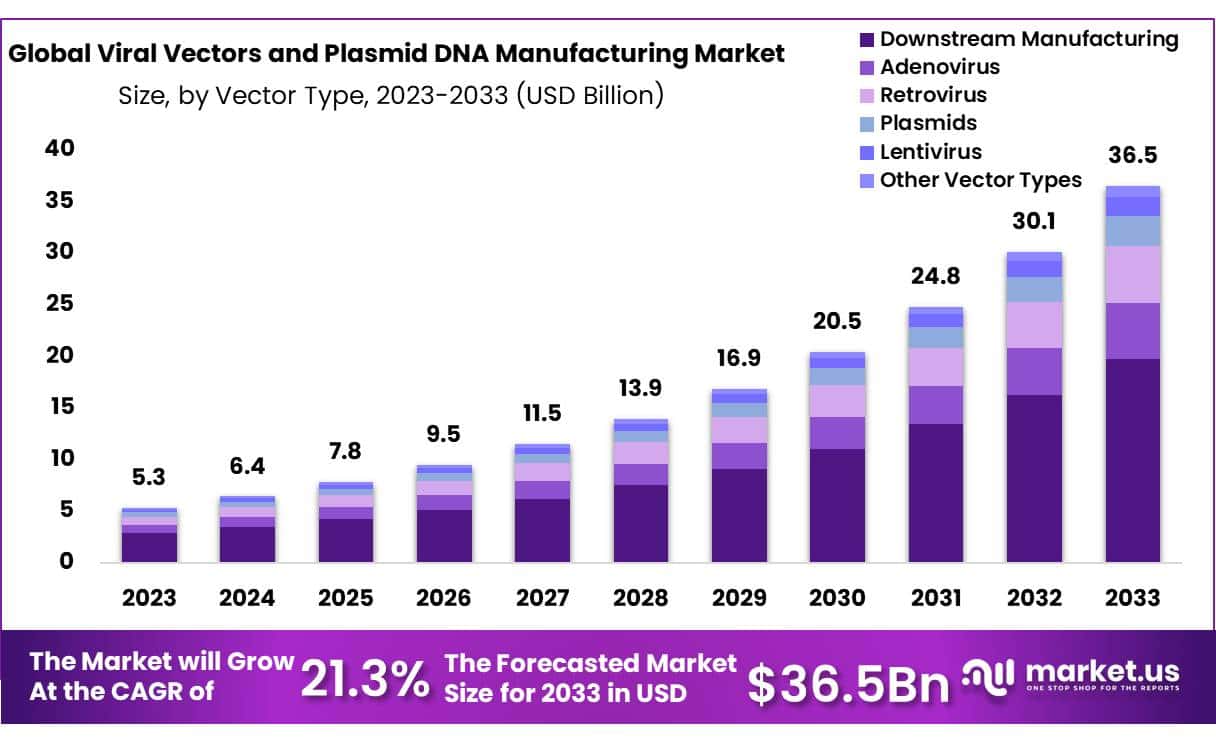
The Global Viral Vectors and Plasmid DNA Manufacturing Market size is expected to be worth around USD 36.5 Billion by 2033 from USD 5.3 Billion in 2023, growing at a CAGR of 21.3% during the forecast period from 2024 to 2033.
Viral vectors provide an efficient means of gene delivery and manipulation, being modified viruses designed to carry specific genes directly into cells. Used extensively in gene therapy and editing applications, viral vectors efficiently transport genetic material to targeted cells. Plasmid vectors, on the other hand, are small circular DNA molecules distinct from chromosomal DNA within cells that possess autonomous replication capabilities and can commonly be found in bacteria.
Plasmids play an integral role in research settings as vectors to introduce genes into cells for protein synthesis and genetic modification, among other uses. Both viral vectors and plasmid DNA serve as primary delivery vehicles and manipulation agents within research contexts, aiding further exploration of potential applications.
The demand for plasmid genetic material is growing with the advancement of gene therapy. As more people choose to use gene therapy, the global market for it is growing. There are many genetic and infectious diseases on the rise all over the globe. UNAIDS data shows that 37.9 million people were living with HIV/AIDS as of 2019, while 1.8 million people have just been diagnosed.
Gene therapy and gene editing technologies to treat chronic disorders, viral infections and other conditions is driving growth in the viral vector and plasmid DNA manufacturing market. Furthermore, increased research efforts and investments in pharmaceutical and biotechnology sectors combined with favorable regulatory environments are expected to expand market reach further. Furthermore, advanced computing technologies are expected to widen application scope of viral vector and plasmid DNA manufacturing soon, thus driving market expansion further.
Key Takeaways
- Market Size: Viral Vectors and Plasmid DNA Manufacturing Market size is expected to be worth around USD 36.5 Billion by 2033 from USD 5.3 Billion in 2023.
- Market Growth: The market growing at a CAGR of 21.3% during the forecast period from 2024 to 2033.
- Vector Type Analysis: Downstream Manufacturing leads the Viral Vectors and Plasmid DNA Manufacturing Market with 54% market share.
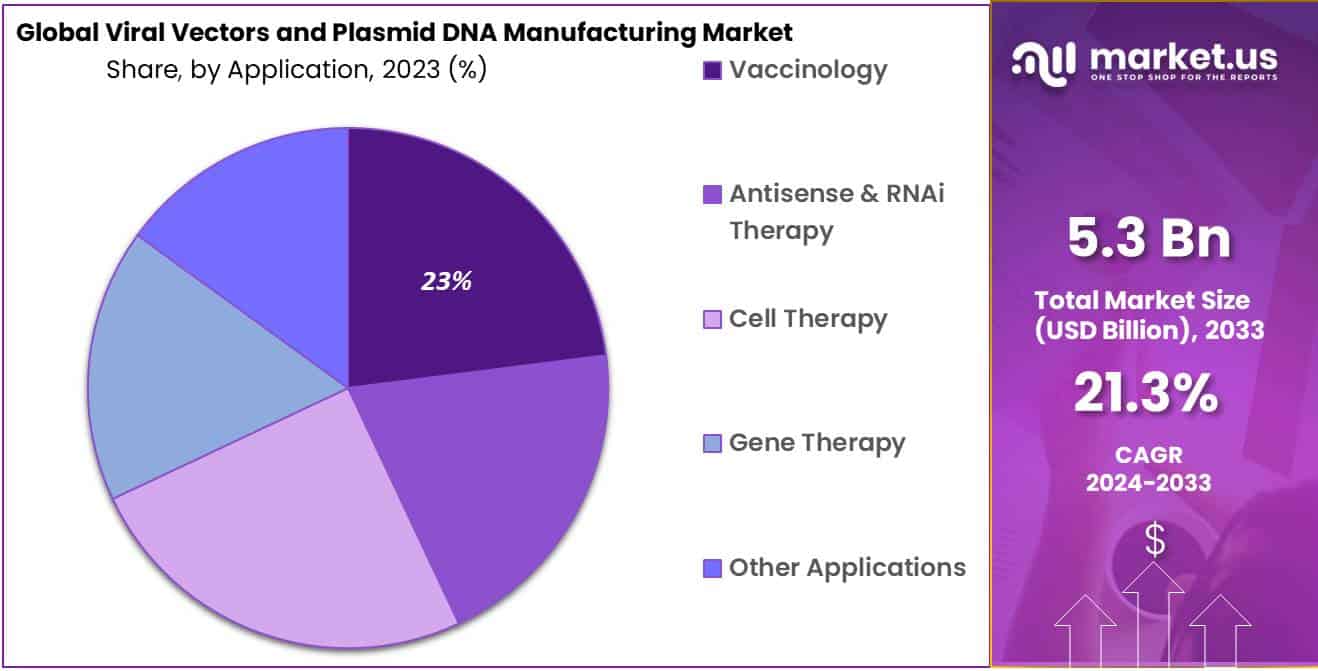
- Application Analysis: In 2023, vaccinology will account for 23% of the market.
- End-Use Analysis: Research Institutes represent 59% of the end-users in the Viral Vectors and Plasmid DNA Manufacturing Market.
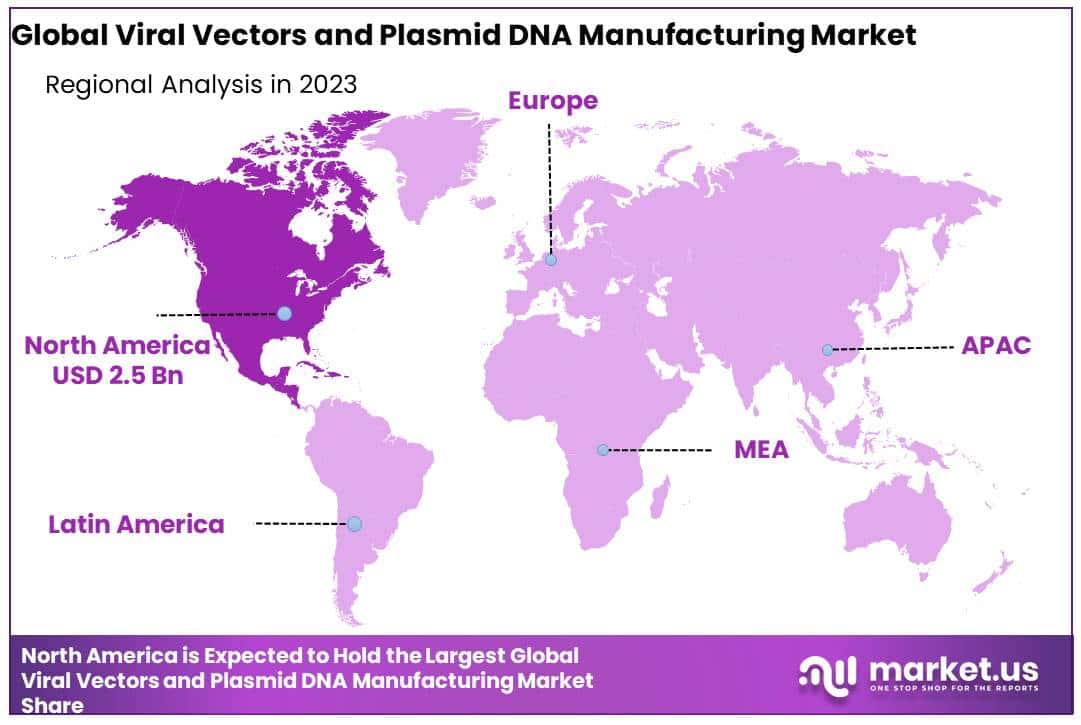
- Regional Analysis: North America held a 47.8% global market share and held USD 2.5 billion.
- Technological Advancements: Innovations in manufacturing technologies, such as improved vector design and scalable production methods, are driving efficiency and quality in the production process.
- Investment Surge: Significant investments from pharmaceutical companies and venture capitalists are fueling research and development in this sector.
- Strategic Collaborations: Partnerships and collaborations among biotechnology companies, research institutions, and contract manufacturing organizations (CMOs) are enhancing production capabilities and market reach.
- Customization and Flexibility: The trend towards personalized medicine is leading to a higher demand for customized and flexible manufacturing solutions tailored to specific therapeutic needs.
Vector Type Analysis
Downstream Manufacturing leads the Viral Vectors and Plasmid DNA Manufacturing Market with 54% market share. Downstream Manufacturing encompasses critical steps, including purification, concentration and formulation of viral vectors and plasmid DNA to prepare them for final use in gene therapy, vaccine production or biopharmaceutical production. Downstream Manufacturing plays an essential role in meeting regulatory requirements, maintaining product safety standards and upholding high-quality standards throughout manufacturing.
Upstream Manufacturing represents the initial step of production, including cell culture, gene expression and vector creation. Although downstream manufacturing dominates market share, upstream manufacturing remains essential in providing sustainable and reliable raw material supplies for downstream processes. Both stages contribute significantly to gene therapy and biopharmaceutical industries by driving innovation and improving patient outcomes.
Application Analysis
In 2023, vaccinology will account for 23 % of the market. Because of their efficiency, virus vectors are extensively used in developing a vaccine. These advantages include eliciting a broad and robust immune response and the safety profiles and comfort of manufacture. Because AAV can express episomal genes without integrating into the host genome, it can be used in clinical settings. Efforts to optimize and design vaccination protocols will drive the development of new vaccines.
Because of the recent COVID-19 outbreak, viral vectors are being used more frequently in vaccine research. Even though viral vectors were widely used for vaccine production before introducing COVID-19, scientists had to adapt existing methods to develop a vaccine.
End-user Analysis
Research Institutes represent 59% of the end-users in the Viral Vectors and Plasmid DNA Manufacturing Market, representing its primary end-users. Research institutes play an integral role in furthering scientific research and development across disciplines such as gene therapy, vaccine production, molecular biology and molecular therapy – using viral vectors and plasmid DNA for fundamental studies, preclinical trials or clinical trials that drive demand for manufacturing services and products within this market.
Pharmaceutical and Biopharmaceutical Companies also play a prominent role in end-user applications of viral vectors and plasmid DNA manufacturing, employing them in the development and production of innovative therapeutics and vaccines. While research institutes typically represent the dominant share of market growth, pharmaceutical and biopharmaceutical companies drive its expansion by commercializing innovative products and therapies that ultimately benefit patients worldwide.
Collectively these end-users foster expansion and advancement of viral vectors and plasmid DNA manufacturing market by driving innovation breakthroughs within biotech healthcare industries and healthcare industry sectors.
Disease Analysis
Cancer stands out as the dominant disease within the Viral Vectors and Plasmid DNA Manufacturing Market, accounting for 39% market share. Viral vectors and plasmid DNA play an indispensable part in cancer therapy, aiding researchers in creating innovative gene-based treatments such as gene therapy, oncolytic virotherapy and cancer vaccines. Advanced cancer therapies target tumor cells more precisely, offering promising results to cancer patients while driving demand for manufacturing services and products in the market.
Gene Therapy represents another key application area of viral vectors and plasmid DNA; potential treatments could help address conditions like muscular dystrophy, cystic fibrosis and hemophilia that arise as inheritable genetic conditions. Infectious diseases provide opportunities for vector-based vaccines and gene therapies to combat viral infections like HIV, Hepatitis, COVID-19.
While cancer remains the largest market segment for viral vector and plasmid DNA manufacturing markets, their various applications in genetic disorders and infectious diseases contribute significantly to growth and advancement within this space – offering hope to patients worldwide.
Маrkеt Ѕеgmеntѕ
Vector Type
- Adenovirus
- Retrovirus
- Adeno-Associated Virus (AAV)
- Lentivirus
- Plasmids
- Other Vector Types
Workflow
Upstream Manufacturing
- Vector Amplification & Expansion
- Vector Recovery/Harvesting
Downstream Manufacturing
- Purification
- Fill Finish
Application
- Antisense & RNAi Therapy
- Gene Therapy
- Cell Therapy
- Vaccinology
- Other Applications
End-user
- Pharmaceutical and Biopharmaceutical Companies
- Research Institutes
Disease
- Cancer
- Genetic Disorders
- Infectious Diseases
- Others
Driver
Developments in Gene Therapy
gene The rapid advancements of gene therapy is the primary driving factor of viral vectors and plasmid DNA manufacturing market growth. Gene therapy holds immense promise to treat various genetic disorders, cancers and infectious diseases using viral vectors or plasmid DNA delivery to target cells containing therapeutic genes for therapeutic treatment of such disorders and diseases. With ongoing gene therapy research comes increasing demand for high-quality viral vectors and plasmid DNA manufacturing services that support preclinical and clinical studies and drive market expansion – creating exponential market expansion!
Increased Investments in Biotechnology Research and Development
Another significant driver is rising investments in biotechnology research and development by pharmaceutical companies, biotech firms, and research institutions. Allocating significant resources towards creating groundbreaking gene-based therapies and vaccines drives up demand for viral vector and plasmid DNA manufacturing capabilities and contributes to market expansion for viral vector and plasmid DNA manufacturing capabilities. With their focus on meeting unmet medical needs and improving patient outcomes these investments serve to expand viral vector and plasmid DNA manufacturing market share.
Trend
Customized Vector Design
A prominent trend in the market is the rise in demand for customized vector designs. Thanks to advances such as CRISPR-Cas9 gene editing technologies, researchers can now engineer viral vectors and plasmid DNA to increase safety, efficacy, targeting capabilities and safety compared with conventional ones. Customized vectors offer tailored solutions for specific therapeutic applications including tissue targeting, immune evasion and controlled gene expression that drive demand for manufacturing services tailored towards individual research requirements.
Adoption of Single-Use Technologies
Another trend impacting the market is the widespread adoption of single-use technologies for viral vector and plasmid DNA manufacturing. Single-use bioreactors, purification systems and disposable processing equipment offer flexibility, scalability and cost effectiveness over traditional stainless steel systems; therefore increasing productivity timelines while mitigating contamination risks while optimizing resource utilization driving innovation and efficiency in production processes.
Restraint
Regulatory Challenges and Compliance
Compliance requirements can be one of the greatest barriers in viral vector and plasmid DNA manufacturing markets, leading to delays in product development, increased costs and market entry barriers for manufacturers. Quality controls must meet stringent safety assessment and approval processes in order to produce product efficacy and patient safety; manufacturers often face delays due to regulations, meeting standards or meeting compliance frameworks that may pose difficulties with this aspect of production.
Supply Chain Vulnerabilities
One barrier is the insecurity of the supply chain. Sourcing raw materials and crucial components for viral vector and plasmid DNA manufacturing requires accessing essential materials from limited suppliers; geopolitical tensions between countries; disruptions such as natural disasters or pandemics may impact supply availability or costs leading to production delays and bottlenecks resulting in supply chain bottlenecks and delays requiring resilient and diverse supply chains to minimize risks while keeping operations going uninterruptedly. Ensuring resilient and diverse supply chains is key to mitigate risks and ensure continuity across these operations in viral vector and plasmid DNA manufacturing operations.
Opportunity
Expansion of Cell and Gene Therapy Pipeline
Growth opportunities can be found by expanding the cell and gene therapy pipeline. As more therapies advance from preclinical development through clinical testing stages, manufacturers have an excellent opportunity to take advantage of this trend by offering comprehensive manufacturing solutions such as process development, scale-up and cGMP production to meet cell therapy developers’ evolving demands.
Emerging Applications in Vaccines and Infectious Diseases
One opportunity lies in the burgeoning applications of viral vectors and plasmid DNA in vaccines and infectious diseases, particularly the COVID-19 pandemic which has demonstrated the necessity of rapid vaccine production using viral vector and nucleic acid-based platforms, while gene-based vaccines to address emerging infectious diseases represent new market expansion prospects. By capitalizing on expertise in viral vector manufacturing companies can capitalize on emerging opportunities while contributing towards global health initiatives.
Regional Analysis
By 2023, North America held a 47.8% global market share and held USD 2.5 billion. One of the main reasons for this market’s high share is the existence of numerous centers and institutes engaged in advanced therapy research and development. The federal government’s investments in expanding the cell therapy research base are expected to benefit North America.
Because of the growing patient population and increased R&D activity in this field, Asia Pacific is expected to be the fastest-growing region. Because of the region’s large population and untapped resources, the business landscape for multinational corporations has shifted. Patients from Western countries are being offered stem cell therapies because of Asia’s less restrictive legal framework.
Additionally, the region has a low-cost manufacturing and research unit. These factors are expected to be a key factor in the expansion of stem cell research in this area and further increase market growth.
Key Regions and Countries
- North America
- US
- Canada
- Mexico
- Europe
- Germany
- UK
- France
- Italy
- Russia
- Spain
- Rest of Europe
- APAC
- China
- Japan
- South Korea
- India
- Rest of Asia-Pacific
- South America
- Brazil
- Argentina
- Rest of South America
- MEA
- GCC
- South Africa
- Israel
- Rest of MEA
Key Players Analysis
With the presence of both established and small- and medium-sized new players, there is a high level of competition in the market for viral vectors. Many players are looking to expand geographically, form strategic partnerships, or join forces with other companies in economically-friendly regions.
Cobra Bio, for example, focuses on manufacturing robust, scalable process strategies to manufacture a virus vector. Cobra Bio is involved in the production and distribution of AAVs, lentiviral vectors, and adenoviruses.
Cobra Biologics also expanded its facilities in Europe and the U.S. in January 2021. This includes the expansion of the HQDNA manufacturing facility by four times and the construction of new European facilities. This has boosted the company’s market position. These are some of the major players in the global viral vectors market and the plasmid DNA manufacturing industry.
Market Key Players
- Merck KGaA
- Lonza
- FUJIFILM Diosynth Biotechnologies
- Thermo Fisher Scientific
- Cobra Biologics
- Catalent Inc.
- Wuxi Biologics
- Takara Bio Inc.
- Waisman Biomanufacturing
- Genezen laboratories
- Batavia Biosciences
- Miltenyi Biotec GmbH
Recent Developments
- Merck KGaA (April 2024): Merck KGaA acquired VectorTech, a company specializing in advanced viral vector production technologies. This acquisition aims to enhance Merck’s capabilities in gene therapy manufacturing, providing cutting-edge solutions for scalable and efficient vector production.
- FUJIFILM Diosynth Biotechnologies (March 2024): FUJIFILM Diosynth Biotechnologies merged with CellBio Solutions to strengthen its position in the viral vector manufacturing market. The merger aims to leverage combined expertise in bioprocessing and gene therapy to offer comprehensive manufacturing services.
- Thermo Fisher Scientific (February 2024): Thermo Fisher Scientific introduced the PlasmiGen X, a high-efficiency plasmid DNA production system. This new product features advanced purification technologies, ensuring high-quality DNA suitable for various therapeutic and research applications.
- Cobra Biologics (June 2024): Cobra Biologics acquired GeneVector, a leader in viral vector manufacturing. This strategic acquisition is set to expand Cobra’s service offerings, providing enhanced capabilities in the production of vectors for gene therapy and vaccine development.
- Wuxi Biologics (April 2024): Wuxi Biologics merged with VectorBio Labs, combining their strengths in bioprocessing and vector production. The merger aims to create a leading global player in the viral vector manufacturing market, enhancing service offerings and global reach.
- Takara Bio Inc. (March 2024): Takara Bio Inc. introduced the RetroGen Max, an advanced retroviral vector production system. This system is designed to provide high-titer, high-purity vectors, supporting efficient gene delivery for therapeutic applications.
Report Scope
| Report Features | Description |
|---|---|
| Market Value (2023) | USD 5.3 Billion |
| Forecast Revenue (2033) | USD 36.5 Billion |
| CAGR (2024-2033) | 21.3% |
| Base Year for Estimation | 2023 |
| Historic Period | 2018-2022 |
| Forecast Period | 2024-2033 |
| Report Coverage | Revenue Forecast, Market Dynamics, Competitive Landscape, Recent Developments |
| Segments Covered | By Vector Type-(Adenovirus, Retrovirus, Adeno-Associated Virus (AAV), Lentivirus, Plasmids, Other Vector Types) By Workflow-Upstream Manufacturing (Vector Amplification & Expansion, Vector Recovery/Harvesting) Downstream Manufacturing(Purification, Fill Finish); By Application-(Antisense & RNAi Therapy, Gene Therapy, Cell Therapy, Vaccinology, Other Applications); By End-user-(Pharmaceutical and Biopharmaceutical Companies, Research Institutes, Disease, Cancer, Genetic Disorders, Infectious Diseases, Others) |
| Regional Analysis | North America-US, Canada, Mexico;Europe-Germany, UK, France, Italy, Russia, Spain, Rest of Europe;APAC-China, Japan, South Korea, India, Rest of Asia-Pacific;South America-Brazil, Argentina, Rest of South America;MEA-GCC, South Africa, Israel, Rest of MEA |
| Competitive Landscape | Merck KGaA, Lonza, FUJIFILM Diosynth Biotechnologies, Thermo Fisher Scientific, Cobra Biologics, Catalent Inc., Wuxi Biologics, Takara Bio Inc., Waisman Biomanufacturing, Genezen laboratories, Batavia Biosciences, Miltenyi Biotec GmbH |
| Customization Scope | Customization for segments, region/country-level will be provided. Moreover, additional customization can be done based on the requirements. |
| Purchase Options | We have three licenses to opt for: Single User License, Multi-User License (Up to 5 Users), Corporate Use License (Unlimited User and Printable PDF) |
Frequently Asked Questions (FAQ)
Viral vectors and plasmid DNA are utilized in gene therapy, gene editing, and vaccine development to deliver genetic material into cells for therapeutic or research purposes.
The global Viral Vectors and Plasmid DNA Manufacturing Market size was estimated at USD 5.3 Billion in 2023 and is expected to reach USD 36.5 Billion in 2033.
The global Viral Vectors and Plasmid DNA Manufacturing Market is expected to grow at a compound annual growth rate of 21.3%. From 2024 To 2033
Some of the key players in the Viral Vectors and Plasmid DNA Manufacturing Markets are Merck KGaA, Lonza, FUJIFILM Diosynth Biotechnologies, Thermo Fisher Scientific, Cobra Biologics, Catalent Inc., Wuxi Biologics, Takara Bio Inc., Waisman Biomanufacturing, Genezen laboratories, Batavia Biosciences, Miltenyi Biotec GmbH.
These manufacturing technologies enable the development of innovative treatments for various diseases, including genetic disorders, cancers, and infectious diseases, leading to improved patient outcomes.
The increasing demand for gene therapy, advancements in gene editing technologies, rising research activities, investments in the pharmaceutical and biotechnology industries, favorable regulatory conditions, and integration of advanced computing technologies are driving market growth.
These technologies enable the development of targeted therapies, personalized medicines, and novel vaccines, revolutionizing the treatment landscape and offering new hope for patients with challenging medical conditions.


