


Report Overview
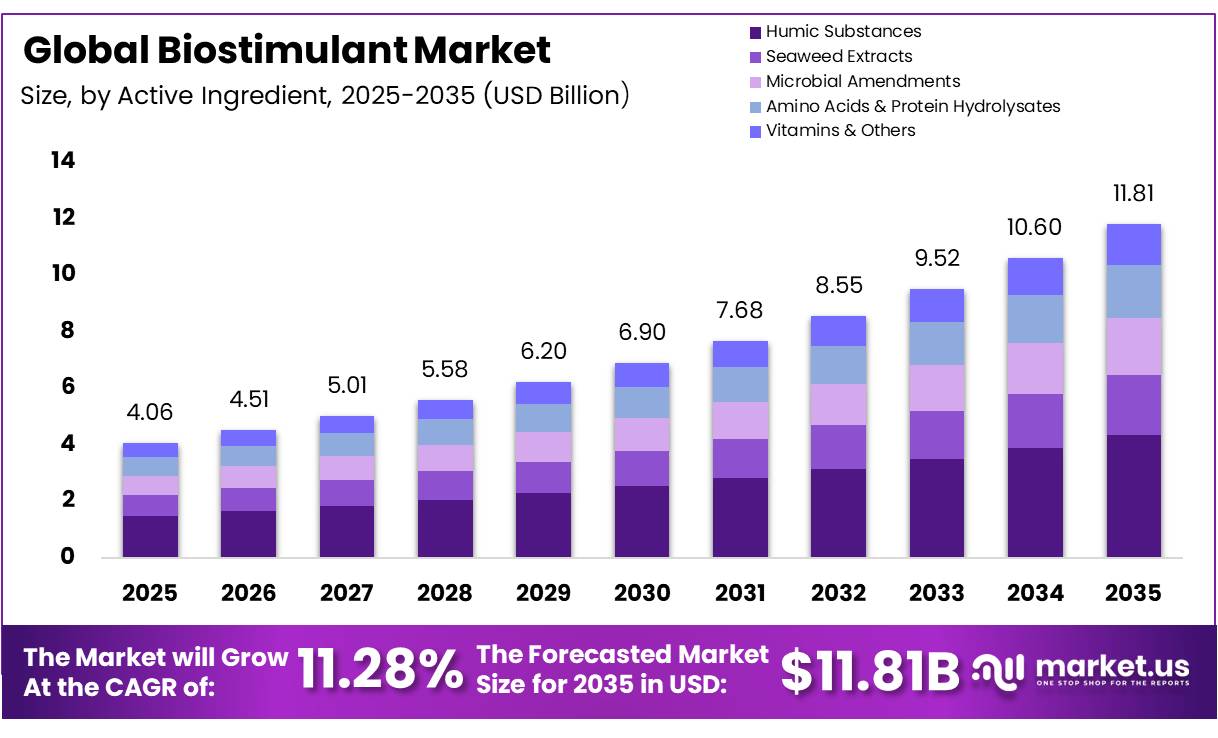
In 2025, the Global Biostimulant Market was valued at USD 4.06 billion, and between 2026 and 2035, this market is estimated to register a CAGR of 11.28%, reaching about USD 11.81 billion by 2035. In 2025, Europe led the market, achieving over 38.50% share with a revenue of USD 1.56 Billion.
The biostimulant market includes natural or biological materials and microbes that help crops use nutrients better, tolerate environmental stress, improve quality, develop stronger roots, and increase yield. The U.S. EPA officially acknowledged this product category as natural substances and microbes that help plants grow better, become more resistant to stress, and improve their overall health, a recognition that helped make the industry more accepted and successful in the market.
- Data released by the Food and Agriculture Organization Between 2022 and 2023, total nutrient use increased by 2%, including growth of 2.0% for nitrogen and 4.4% for potassium, while phosphorus use declined by 3.3%.
Key Takeaways
- The global biostimulant market was valued at USD 4.06 billion in 2025.
- The global biostimulant market is projected to grow at a CAGR of 11.28% and is estimated to reach USD 11.81 billion by 2035.
- Humic substances represent the dominant active ingredient, holding 36.70% of the global market.
- On the basis of crop type, Fruits & Vegetables accounted for a leading 31.23% share of the market in 2025, driven by the high-value nature of horticultural produce and the sensitivity of fruit and vegetable yields to soil health and stress conditions.
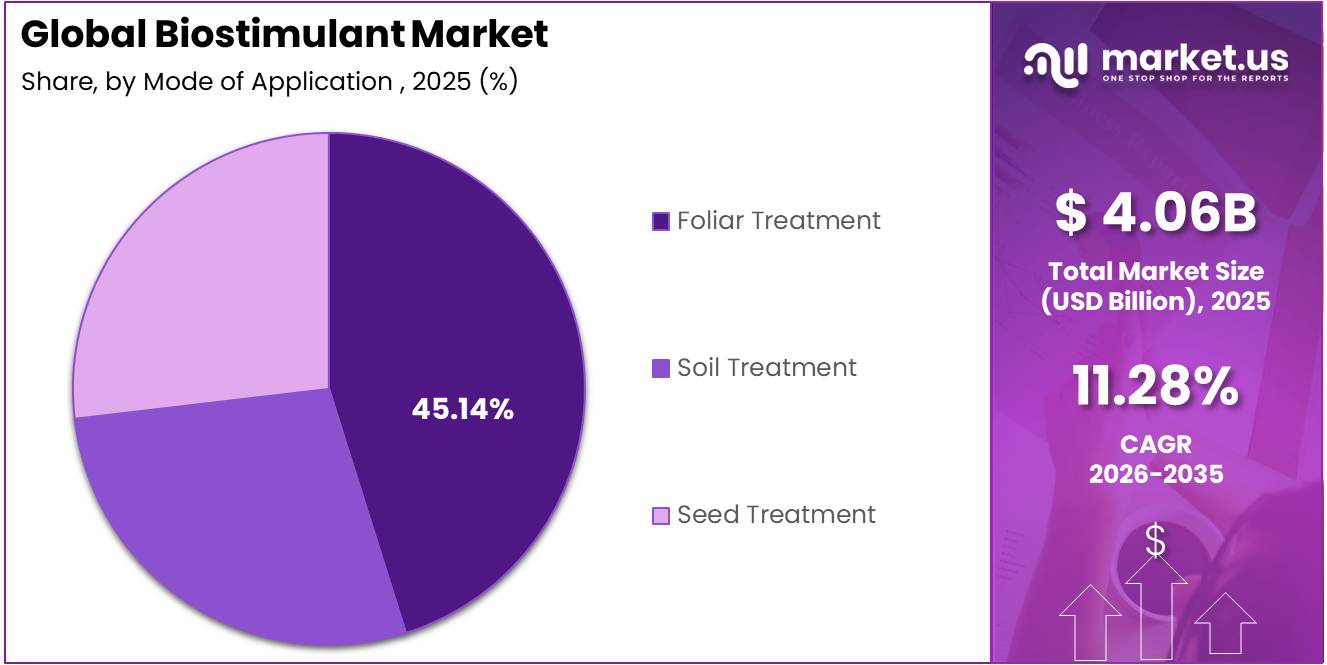
- On the basis of mode of application, Foliar Treatment accounted for a leading 45.14% share of the market in 2025, preferred for its direct nutrient absorption efficiency and suitability across a wide range of open-field and greenhouse cropping systems.
- On the basis of formulation, Liquid accounted for a leading 62.17% of the market in 2025, supported by ease of application, compatibility with existing irrigation and spraying equipment, and rapid uptake by plant root systems.
- Europe dominates the regional landscape, commanding 38.50% of global biostimulant revenue in 2025.
Products include seaweed extracts, humic substances, amino acids, microbial inoculants, and plant-based extracts. The demand for these products is accelerating as farming moves towards more sustainable practices, improving soil health, and producing crops that can withstand climate challenges.
Market growth is being driven by increasing climate stress, the need for more efficient use of nutrients, and government support for sustainable farming practices. The dominant current force is the global imperative to sustain crop productivity under conditions of drought, heat stress, and soil salinity.
- The European Union Fertilising Products Regulation in the year 2022 states that plant biostimulants must not contain more than 5 milligrams of cadmium, 2 milligrams of hexavalent chromium, 120 milligrams of lead, 1 milligram of mercury, 50 milligrams of nickel, or 40 milligrams of inorganic arsenic per kilogram of dry matter. Copper content must remain below 600 milligrams per kilogram, while zinc is limited to 1,500 milligrams per kilogram of dry matter.
Before regulation, nearly 30,000 unmonitored biostimulant products operated freely in India. The Government of India introduced Clause 20C of the Fertilizer Control Order to enforce quality standards. As of September 2025, Press Information Bureau data confirms that only 146 biostimulant products have achieved full Schedule VI inclusion. This sharp contraction shifts market power toward certified, scientifically validated biostimulant manufacturers.
The outlook points toward AI-integrated precision dosing. Remote sensing platforms modulate biostimulant application rates against real-time soil moisture and stress indices, compressing the decision-to-application cycle to hours. Consequently, biostimulants are becoming core inputs within next-generation smart farming infrastructure.
Biostimulant Market Segmentation
Active Ingredient Analysis
Humic Substances represent the dominant Segment in the Market.
Humic substances represent the dominant segment in the biostimulant market, accounting for 36.70% share. This dominance is driven by the ability to improve soil structure, enhance nutrient availability, and promote root development. These benefits help crops absorb water and nutrients more efficiently, improving productivity under drought and other stress conditions. Their compatibility with conventional fertilizer programs further supports widespread adoption across agricultural applications.
- According to the Food and Agriculture Organization (FAO) of the United Nations, 2025, approximately 33% of the world’s soils are moderately to highly degraded due to erosion, nutrient depletion, salinization, compaction, acidification, and chemical pollution. This has increased the need for soil-improving inputs such as humic substances that enhance soil organic matter, nutrient availability, and root development, supporting their widespread adoption in the global biostimulant market.
Seaweed extracts are the fastest-growing segment in the global biostimulant market. Growth is driven by expanding commercial utilization of marine macroalgae, primarily Ascophyllum nodosum. Rich in natural phytohormones and bioactive polysaccharides, seaweed extracts enhance crop stress tolerance, stimulate root growth, and improve nutrient uptake efficiency. Rising demand for organic-compatible crop inputs across Europe and the Asia Pacific is accelerating adoption across both field crops and horticulture.
Crop Type Analysis
Fruits & vegetables lead the market.
Fruits & Vegetables account for 31.23% of the biostimulant market. This dominance is due to their high economic value, intensive nutrient requirements, and strong sensitivity to abiotic stress conditions. High-value crops such as tomatoes, strawberries, peppers, citrus, and leafy greens operate under strict retailer and export quality specifications tolerances that synthetic fertilizers alone cannot consistently deliver under climate stress. Biostimulants address this gap by improving brix levels, shelf life, uniformity, and stress recovery parameters that command measurable price premiums in both domestic and export markets.
- According to the Food and Agriculture Organization’s latest FAOSTAT agricultural production update, global output reached approximately 2 billion tonnes of vegetables and 954 million tonnes of fruits in 2024. Together, these crops represented more than 2.1 billion tonnes of agricultural production. Their large cultivation base, intensive nutrient requirements and exposure to drought, heat and other environmental stresses create significant opportunities for biostimulants designed to support nutrient-use efficiency, crop yield and produce quality.
Row Crops & Cereals are projected to be the fastest-growing crop type segment during 2026–2035, due to increasing adoption of biostimulants in large-scale farming operations. Demand is rising across corn, wheat, rice, soybean, and barley cultivation as growers seek to improve nutrient-use efficiency, soil health, and crop resilience. Rising fertilizer costs, climate-related stress, and the expansion of precision agriculture practices are further accelerating biostimulant adoption in broad-acre crop production.
Mode of Application Analysis
Foliar Treatment Held a Major Share of the Biostimulant Market.
Foliar Treatment, accounting for 45.14% of the biostimulant market, represents the dominant material segment because plants absorb nutrients through leaves, allowing biostimulants to work faster than soil-based methods. It is especially useful during key growth stages like flowering and fruit development, when crops need quick support to protect yield. This method is widely used because it works with normal farm spraying equipment, so farmers do not need extra investment. In crops like fruits and vegetables, foliar sprays are often applied several times in a season to improve plant health and productivity.
- According to the Food and Agriculture Organization (FAO), 2024, the global harvested area for temporary and permanent crops exceeded5 billion hectares. A significant proportion of these crops receive foliar applications of crop protection products and nutrient formulations during the growing season, supporting the widespread adoption of foliar-applied biostimulants for rapid nutrient uptake and stress management.
Soil treatment through fertigation and drip irrigation is expected to show the strongest long-term growth from 2030 to 2035. This is mainly due to the rapid expansion of precision irrigation systems, especially in water-scarce regions like the EU, parts of the U.S., India, and Israel. These systems make it easier to deliver biostimulants directly into the root zone through irrigation water. This application method is also expected to grow as farmers increasingly connect soil health management with digital tools that track moisture, nutrient levels, and soil biology, making soil treatment a key part of modern precision farming systems.
Form Analysis
Liquid Form Represents the Most Widely Used Form in the Market.
Liquid Form, accounting for 62.17% of the market, represents the dominant technology segment. This is mainly because liquid products are easy to mix, handle, and apply using standard farm spraying equipment. They dissolve fully in water, so farmers do not face issues like clogging or uneven spraying during field operations. Liquid formulations also allow accurate dosing and smooth application across large farms, helping ensure uniform crop coverage. Convenience and compatibility with existing farming practices make the liquid form the most widely used form in the biostimulant market.
Dry biostimulant formulations like powders, granules, and water-dispersible forms are expected to be the fastest-growing segment from 2026 to 2035. Their growth is mainly driven by long shelf life, easy storage, and lower transport costs compared to liquid products. They do not need cold storage, making them ideal for regions with limited infrastructure, such as parts of Africa and Asia. New, improved formulations now dissolve easily in water, making them more compatible with modern irrigation systems. In addition, new technologies like microencapsulation are improving their performance by allowing nutrients to release slowly into the soil.
Key Market Segments
By Active Ingredient
- Humic Substances
- Seaweed Extracts
- Microbial Amendments
- Amino Acids & Protein Hydrolysates
- Vitamins & Others
By Crop Type
- Fruits & Vegetables
- Row Crops & Cereals
- Turf & Ornamentals
- Others
By Mode of Application
- Foliar Treatment
- Soil Treatment
- Seed Treatment
By Form
- Liquid
- Dry
Driver Analysis
Soil Degradation Crisis Driving Biostimulant-Led Soil Restoration Demand
A structurally underweighted but commercially decisive driver is the unprecedented scale of documented global soil degradation, which has created a biologically mandated demand base for biostimulants as functional soil-health remediation inputs. In November 2025, the FAO released its flagship State of Food and Agriculture 2025 report, estimating that approximately 1.7 billion people worldwide live in areas where crop yields are 10 percent lower due to human-induced land degradation including 47 million children under five suffering from stunting, with Asian countries identified as the most affected.
The FAO’s companion SOLAW 2025 report, released in February 2025, further warned that more than 60 percent of human-induced land degradation occurs on agricultural land and that feeding a projected 10 billion people by 2050 will require prioritizing soil quality recovery rather than horizontal land expansion. Biostimulants particularly humic and fulvic acids (valued at USD 0.688 billion in 2025 at a product-specific CAGR of 11.52%), microbial inoculants including Rhizobium, Azotobacter, and phosphate-solubilizing bacteria, and seaweed-derived cytokinins directly address the soil biology and chemical composition deficits arising from intensive chemical input dependency.
The India government’s ICAR-led extension programs and BioE3 policy explicitly fund research into microbial consortia formulation and marine biostimulants for crop growth under the “Climate Resilient Agriculture” thematic sector, receiving a call for proposals in April 2025 that generated 600 submissions with 41 projects shortlisted for funding. This publicly institutionalized research and extension pipeline in the two largest agricultural economies of Asia validates biostimulants as priority inputs for soil restoration, adding an estimated +1.9 percentage points to the baseline CAGR over a medium-term 2–4-year window.
Drivers Impact Analysis
| Driver | (~) % Impact on CAGR Forecast | Geographic Relevance | Impact Timeline |
|---|---|---|---|
| Surging Chemical Fertilizer Prices Accelerate Biostimulant Substitution | +2.8% | Global core; highest in South Asia (India), MENA supply-chain corridor, Latin America | Short term (≤ 2 years) |
| Regulatory Harmonization Unlocking Market Access | +2.2% | EU primary market; North America early-stage; India, Brazil spill-over | Medium term (2–4 years) |
| Soil Degradation Crisis Driving Biostimulant-Led Soil Restoration Demand | +1.9% | APAC (China, India, Southeast Asia); Sub-Saharan Africa; EU | Medium term (2–4 years) |
| Scaling Organic & Sustainable Farming Mandates | +1.6% | EU primary; North America secondary; APAC urban corridor | Short–Medium term |
| Climate-Driven Abiotic Stress Events Increasing Biostimulant Adoption | +1.4% | APAC (India, Vietnam, China); MENA; Mediterranean EU | Medium term (2–4 years) |
| Precision Agriculture & Digital Integration Enabling Smart Biostimulant Delivery | +1.0% | North America; Northwest EU; Urban APAC (Japan, Australia, Singapore) | Long term (≥ 4 years) |
Restraint Analysis
Regulatory Fragmentation & Mass Market Withdrawal
The most acute near-term restraint on the global biostimulant market is the structural market shock delivered by the Government of India’s enforcement of the Fertilizer Control Order (FCO), 1985 the world’s most consequential single-jurisdiction regulatory reckoning for this product category in 2025. The government, having issued Notification No. S.O. 882(E) on 23 February 2021 to formally bring biostimulants under FCO via Clause 20C, extended provisional G3 certifications four consecutive times over four years before issuing an irreversible cutoff on 16 June 2025, beyond which all 9,352 provisional registrations were declared invalid.
As of September 2025, only 146 biostimulant products achieved Schedule VI inclusion under the FCO a market collapse ratio of over 98% of previously traded SKUs. This regulatory discontinuity inflicts severe commercial damage across the supply chain: Indian distributors carrying inventory of now-illegal formulations face product recall obligations and liability under the Essential Commodities Act, 1955 (Section 7 penalties include imprisonment of 3 months to 7 years and unlimited fines), while manufacturers who invested in bio-efficacy trial programs at ICAR-approved laboratories a multi-year, multi-lakh-rupee process face delayed returns as only a narrow product set cleared the compliance gauntlet.
Restraint Impact Analysis
| Restraint | (~) % Impact on CAGR Forecast | Geographic Relevance | Impact Timeline |
|---|---|---|---|
| Regulatory Fragmentation & Mass Market Withdrawal | -2.3% | India (primary), APAC corridors, US interstate channels | Short term (≤ 2 years) |
| EU Conformity Assessment Burden & CBAM Cost Pass-Through | -1.8% | EU-27, MENA export corridors to Europe | Medium term (2–4 years) |
| US Regulatory Ambiguity (FIFRA/EPA Classification) | -1.5% | North America core, US–Mexico corridors | Medium term (2–4 years) |
| Raw Material Supply Constraints (Seaweed, Leonardite, Protein Hydrolysates) | -1.9% | Global; worst in EU, South Asia, LATAM | Short-to-Medium term (≤ 3 years) |
| Geopolitical Tariff Shocks & Agricultural Chemical Import Costs | -1.2% | North America, emerging market importers | Short term (≤ 2 years) |
| Farmer Adoption Deficit & Product Adulteration Erosion | -1.0% | India, Sub-Saharan Africa, Southeast Asia | Long term (≥ 4 years) |
Opportunity Analysis
Seed Treatment Segment Penetration as an Untapped Biostimulant Delivery Channel
While foliar application currently dominates biostimulant delivery with over 78.6% revenue share, seed treatment represents the single fastest-growing application segment at a CAGR of 10.2% and constitutes a structurally underpenetrated delivery channel for biostimulant actives—a gap that has yet to be systematically closed by existing market participants. The biological seed treatment market was valued at approximately USD 4.3 billion in 2025 and is projected to reach USD 6.82 billion by 2030 at ~9.7% CAGR, yet biostimulant-specific seed treatment formulations represent a minority sub-segment within this universe, meaning the addressable white space is the roughly USD 4.5–5.0 billion in seed treatment spend that currently uses conventional chemical or generic biological coatings rather than performance-specific biostimulant actives.
In the United States, the Plant Biostimulant Act of 2025, reintroduced to the Senate on May 22, 2025, proposes to exclude biostimulants from FIFRA plant-regulator registration reduce the regulatory cost of seed-applied biostimulant formulations and cut time-to-market by an estimated 18–24 months. The commercial go-to-market mechanics are compelling: integrating biostimulant actives into seed coating polymer matrices allows for a single-application early-stage delivery that reduces cost-per-acre by 30–40% versus foliar regimes, lowers farmer decision friction, and embeds the product within major seed company supply chains creating a pull-through model that could double effective distribution coverage without adding route-to-market infrastructure.
This opportunity is untapped because most biostimulant players are formulation specialists without seed-coating process expertise; the window for JV partnerships or licensing agreements with the USD 19.2 billion global seed treatment market is narrow and closes as large agrochemical groups begin in-house biologicals integration.
Opportunity Impact Analysis
| Opportunity | (~) % Potential CAGR Upside | Geographic Relevance | Execution Window |
|---|---|---|---|
| Biostimulant-Carbon Credit Co-Monetization via SOC Frameworks | +2.8% | North America (USDA NRCS), EU carbon markets, South Asia (Pakistan, India) | Medium term (2–4 years) |
| Seed Treatment Segment Penetration as Untapped Delivery Channel | +2.3% | North America, EU, APAC (India, China, Indonesia) | Short term (≤ 2 years) |
| USDA Regenerative Pilot Program Supplier Positioning | +1.9% | North America core (all 50 states via NRCS EQIP/CSP) | Short term (≤ 2 years) |
| EU CE-Mark Regulatory Arbitrage & Third-Country Market Access | +1.7% | EU-27, with export leverage to MENA, Sub-Saharan Africa | Medium term (2–4 years) |
| India PM-PRANAM / FCO-Driven High-Value Horticulture Vertical | +2.1% | India (Maharashtra, Gujarat, Karnataka, Andhra Pradesh) | Medium term (2–4 years) |
| APAC Emerging Markets: M&A Roll-Up of Fragmented Sub-Scale Biologicals | +1.5% | China, Indonesia, Vietnam, Philippines | Long term (≥ 4 years) |
Challenges Analysis
Farmer Knowledge Gap & Efficacy Perception Deficit
The biostimulant market’s expansion into smallholderdominant agricultural economies collectively representing over 500 million farm households globally, the majority of them in South Asia, SubSaharan Africa, and Southeast Asia is fundamentally constrained by a persistent and widening knowledge asymmetry between biostimulant product science and onfarm decisionmaking capacity, and the absence of cropspecific, region specific agronomic guidance for biostimulant application timing, dosage, and interaction with existing fertilizer programs.
For biostimulants specifically, the challenge is compounded by the product category’s inherently variable efficacy signature: performance outcomes are conditionally dependent on soil microbiome baseline health, ambient temperature at application, crop growth stage, irrigation regime, and native nutrient availability meaning that a product performing with a 12–18% yield uplift in ICAR trial conditions at a controlled research station in Punjab may deliver a 3–7% uplift under rainfed conditions in Odisha with different soil pH and organic matter content, creating farmer experiences that contradict marketed claims and generate categorical rejection of the biostimulant product class rather than productspecific feedback.
The structural consequence is that biostimulant companies must invest in farmer education programs estimated at $40–$120 per farm contact in structured demonstrationplot programs across India and SubSaharan Africa as a marketdevelopment cost that does not appear in the pharmamodel revenue model for conventional agrochemicals, adding 8–15% to customeracquisition costs in emergingmarket channels and extending timetocommercialadoption by 2–4 growing seasons relative to highincome market benchmarks.
Challenges Impact Analysis
| Challenge | (~) % CAGR Friction Drag | Geographic Relevance | Mitigation Horizon |
|---|---|---|---|
| Fragmented Multi-Jurisdictional Regulatory Architecture | -1.8% | EU Single Market, India (FCO/Schedule VI), US (State-level variance: CA, OR, WA) | Long term (≥ 4 years) |
| Microbial Strain Approval & Fermentation Scale-Up Bottleneck | -1.4% | EU (FPR CMC-7 constraint), UK (bio-manufacturing corridors), North America pilot plants | Long term (≥ 4 years) |
| Seaweed & Botanical Raw Material Supply Volatility | -1.2% | APAC sourcing corridors, EU import dependencies, Chile–Morocco harvest zones | Medium term (2–4 years) |
| Microbial Viability & Cold-Chain Logistics Deficit | -1.0% | South Asia (India, Bangladesh), Sub-Saharan Africa, LatAm last-mile distribution | Long term (≥ 4 years) |
| Agronomist & Microbial Biotech Talent Deficit | -0.7% | North America (Midwest row-crop belt), EU R&D hubs, India (ICAR research pipeline) | Long term (≥ 4 years) |
| Farmer Knowledge Gap & Efficacy Perception Deficit | -0.9% | Smallholder-dominant markets: South Asia, Sub-Saharan Africa, Southeast Asia | Medium term (2–4 years) |
Geopolitical Impact Analysis
Geopolitical Realignment and Supply Chain Fragmentation Reshaping the Biostimulant Market.
Active conflicts in Eastern Europe and the Middle East are causing big disruptions in the 2026 biostimulant market. This is happening because of rising energy costs and problems with supply chains. Traditional methods of making synthetic fertilizers rely on natural gas. Because of ongoing energy blockades and damage to infrastructure, global prices for urea have gone up sharply. This makes synthetic fertilizers more expensive, so commercial farmers are moving away from them. Instead, they’re using biostimulants like humic substances and amino acids to improve how well plants use nitrogen. This helps them reduce the amount of fertilizer they use by up to 15% without lowering crop yields.
At the same time, blockades on trade routes in the Black Sea and Red Sea are causing major delays in shipping. Important raw materials such as specialized amino acids, fulvic acids, and marine seaweed like Ascophyllum nodosum take over 45 days to reach their destinations. Freight costs for shipping containers have doubled, which is increasing the cost of producing finished liquid biostimulants.
Also, economic sanctions have blocked key export routes for leonardite ore from Eastern Europe. This shortage is making manufacturing centers in Western Europe and North America invest more in their own supply chains and recycling agricultural waste through a circular bio-economy. These geopolitical issues are pushing the industry toward local processing and boosting long-term consolidation in the agricultural sector.
Regional Analysis
Europe Held the Largest Share of the Biostimulant Market.
In 2025, Europe dominated the global biostimulant market, holding about 38.50% of the total global consumption. Growth is driven by the European Green Deal mandates and farm-to-fork policies targeting a 20% reduction in synthetic fertilizer usage. The region features advanced agricultural infrastructure and high consumer demand for organically grown, zero-residue produce. For instance, commercial orchards in Spain and Italy heavily integrate premium seaweed extracts to secure clean-label export certifications.
Beyond Europe, global market performance is shaped by shifting demographics, local farming practices, and regional infrastructure as detailed by the World Population Review. North America represents the second-largest commercial landscape, heavily driven by large-scale broad-acre cereal and corn operations across the Midwestern United States. Growers in this region utilize automated, high-clearance machinery to apply liquid amino acids and precision seed treatments to mitigate unpredictable, climate-induced frost and drought events.
Key Regions and Countries Covered
- North America
- The US
- Canada
- Europe
- Germany
- France
- The UK
- Spain
- Italy
- Russia & CIS
- Rest of Europe
- APAC
- China
- Japan
- South Korea
- India
- ASEAN
- Rest of APAC
- Latin America
- Brazil
- Mexico
- Rest of Latin America
- Middle East & Africa
- GCC
- South Africa
- Rest of MEA
Key Players Analysis
The global biostimulant market exhibits a highly consolidated oligopolistic structure across its top tier, heavily controlled by a select group of well-capitalized multinational agrochemical corporations. Major global players, including Syngenta Crop Protection (Valagro), Corteva Agriscience (Stoller & Symborg), BASF SE, UPL Limited, and Bayer CropScience, dominate commercial supply chains.
In 2024, Novozymes merged with Chr. Hansen to form Novonesis, creating one of the world’s largest biosolutions companies. The company operates in 30+ countries, serves customers in 100+ markets, and employs approximately 10,000 people. In 2024, Novonesis reported revenue of around EUR 3.7 billion. Valagro S.p.A., a Syngenta Group company since 2020, is a major player in the global biostimulant market. The company operates 8 production facilities, maintains 13 subsidiaries, and distributes products in more than 80 countries. Valagro invests approximately 4% of annual revenue in research and development to expand its plant biostimulant portfolio.
The Major Players In The Industry
- Syngenta Group
- BASF SE
- Bayer AG
- UPL Limited
- Corteva Agriscience
- Novozymes (Novonesis)
- Valagro S.p.A.
- Acadian Seaplants Limited
- Italpollina S.p.A.
- Koppert Biological Systems
- AlgaEnergy S.A.
- Biostadt India Limited
- Other Key Players
Key Development
- In March 2026, Syngenta Group announced a USD 130 million investment in the Biological Sciences Technology and Research centre (BioSTaR) at its Jealott’s Hill R&D campus in the United Kingdom. This new facility is specifically built for around 300 scientists and will combine bioscience, molecular research, AI, and digital technologies to speed up the development of new biological and biostimulant products. The centre is expected to start operating by 2028.
- In January 2026, Corteva Agriscience announced progress on Ympact, a biostimulant seed treatment based on humic substances. This product is aimed at helping with seedling growth and improving crop resilience to non-living stress factors in large-scale farming systems. It is designed to support metabolic processes during the early stages of crop growth, especially in unpredictable weather conditions.
Report Scope
| Report Features | Description |
|---|---|
| Report Features | Description |
| Market Value (2025) | USD 4.06 Bn |
| Forecast Revenue (2035) | USD 11.81 Bn |
| CAGR (2026-2035) | 11.28% |
| Base Year for Estimation | 2025 |
| Historic Period | 2020-2024 |
| Forecast Period | 2026-2035 |
| Report Coverage | Revenue Forecast, Market Dynamics, Competitive Landscape, Recent Developments |
| Segments Covered | By Active Ingredient (Humic Substances, Seaweed Extracts, Microbial Amendments, Amino Acids & Protein Hydrolysates, Vitamins & Others), By Crop Type (Fruits & Vegetables, Row Crops & Cereals, Turf & Ornamentals, Others), By Mode of Application (Foliar Treatment, Soil Treatment, Seed Treatment), By Form (Liquid, Dry) |
| Regional Analysis | North America – The US & Canada; Europe – Germany, France, The UK, Spain, Italy, Russia & CIS, Rest of Europe; APAC– China, Japan, South Korea, India, ASEAN & Rest of APAC; Latin America– Brazil, Mexico & Rest of Latin America; Middle East & Africa– GCC, South Africa, & Rest of MEA |
| Competitive Landscape | Syngenta Group, BASF SE, Bayer AG, UPL Limited, Corteva Agriscience, Novozymes (Novonesis), Valagro S.p.A., Acadian Seaplants Limited, Italpollina S.p.A., Koppert Biological Systems, AlgaEnergy S.A., Biostadt India Limited, Other Key Players. |
| Customization Scope | Customization for segments, region/country-level will be provided. Moreover, additional customization can be done based on the requirements. |
| Purchase Options | We have three licenses to opt for: Single User License, Multi-User License (Up to 5 Users), Corporate Use License (Unlimited Users and Printable PDF) |





































