
Quick Navigation
Report Overview
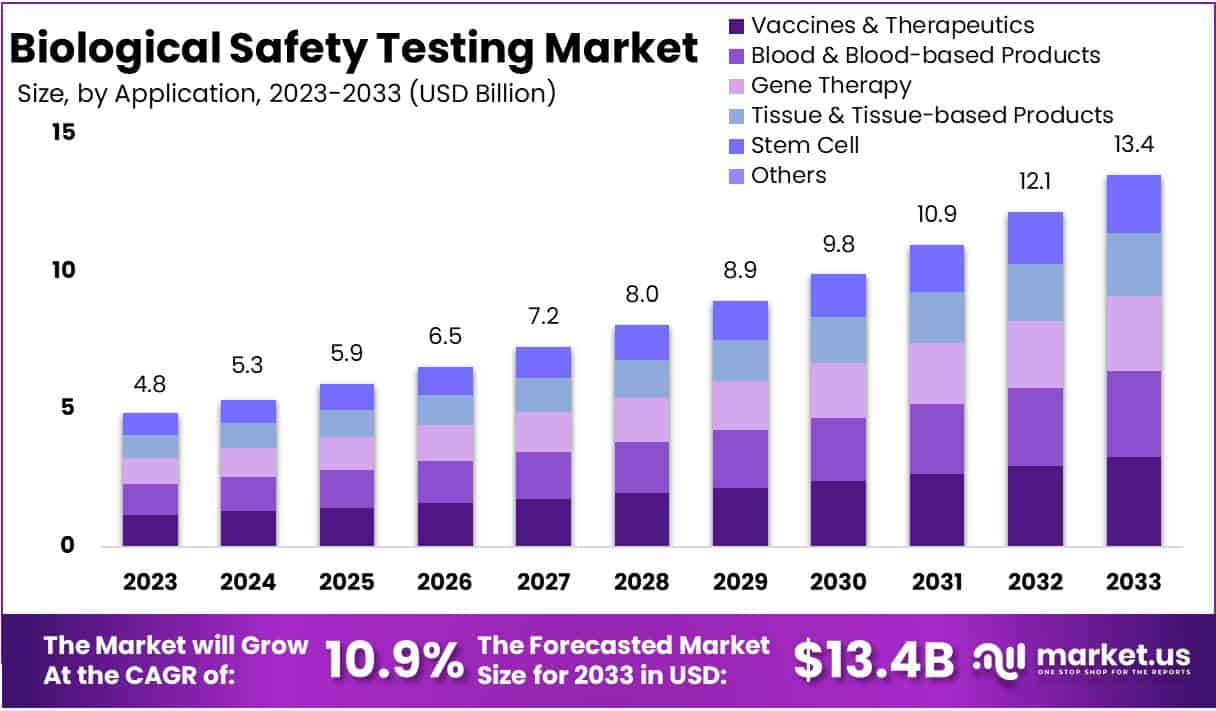
The Biological Safety Testing Market Size is anticipated to reach approximately USD 13.4 Billion by the year 2033, exhibiting a substantial growth from its valuation of USD 4.8 Billion in 2023. This growth is expected to transpire at a Compound Annual Growth Rate (CAGR) of 10.9% during the forecast period spanning from 2024 to 2033.
Biological safety testing encompasses a range of procedures to ensure the safety of biological products, such as pharmaceuticals and vaccines, before their release. The primary objective is to assess potential risks and guarantee compliance with regulatory standards for quality and efficacy.
Tests include sterility testing to confirm the absence of microorganisms, endotoxin testing to ensure acceptable levels, and cell line authentication to prevent contamination. Additionally, virus and adventitious agent testing, bioburden testing, and sometimes in vivo testing are conducted. Regulatory authorities govern these processes globally, ensuring the safety, purity, and effectiveness of biotechnological and pharmaceutical products.
The biological safety testing market has experienced significant growth, primarily driven by the expanding biopharmaceutical and biotechnology sectors. With a surge in the development of biologically derived drugs and products, rigorous safety testing has become imperative. The increasing focus on research and development in the life sciences sector further propels the demand for robust safety testing protocols.
Moreover, emerging markets are witnessing rising adoption of biological safety testing, supported by advancements in testing methodologies, automation, and a global awareness of the crucial role played by these tests, especially in the context of pandemic preparedness, exemplified by the COVID-19 era.
Despite these positive trends, challenges persist within the biological safety testing market. The high cost associated with testing procedures poses a hurdle, particularly for smaller companies and those operating with limited resources. Navigating the complex regulatory landscape, which varies across regions, is another notable challenge faced by industry players.
Key Takeaways
- Market Growth: Projected to reach USD 13.4 Billion by 2033, the Biological Safety Testing Market shows a robust 10.9% CAGR from 2024-2033.
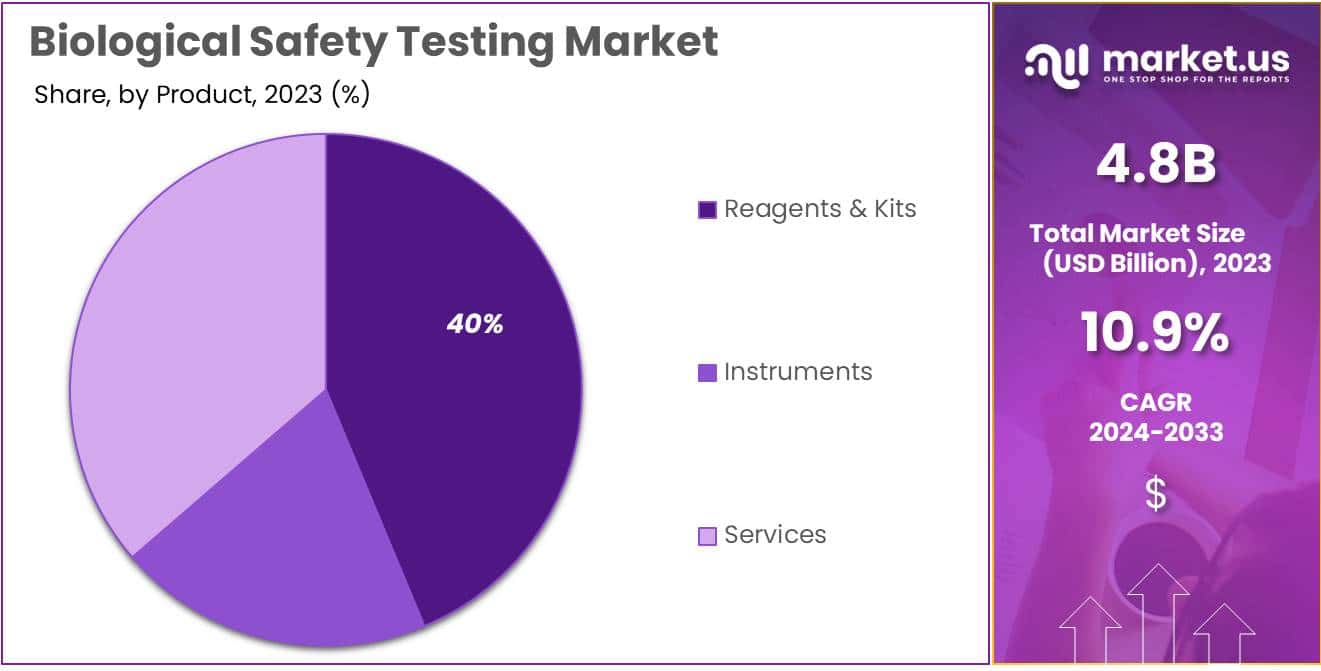
- Product Dominance: In 2023, the Reagents & Kits segment dominated with over 39.7% market share, crucial for accurate testing processes.
- Application Dominance: Vaccines & Therapeutics claimed a 24.1% share in 2023, emphasizing the critical role of safety testing in medical interventions.
- Test Type Dominance: Endotoxin Tests led in 2023, holding a commanding share of over 22.6%, ensuring safety by detecting harmful endotoxins.
- Key Driver – R&D Focus: Growing financial backing for innovative biologics and biosimilars is a key driver, fueling market expansion.
- Industry Expansion: The pharmaceutical and biotechnology industries globally are growing, propelling demand for biological safety testing to ensure product safety.
- Major Restraint – Cost Constraints: High testing expenses pose a significant hurdle, particularly for smaller companies and those with limited resources.
- Opportunity – Outsourcing Trend: Increasing outsourcing of biological safety testing services creates opportunities for service providers, addressing the growing demand.
- Technological Advancements: Continuous evolution of testing methods, including the adoption of 3D tissue models, contributes to market growth.
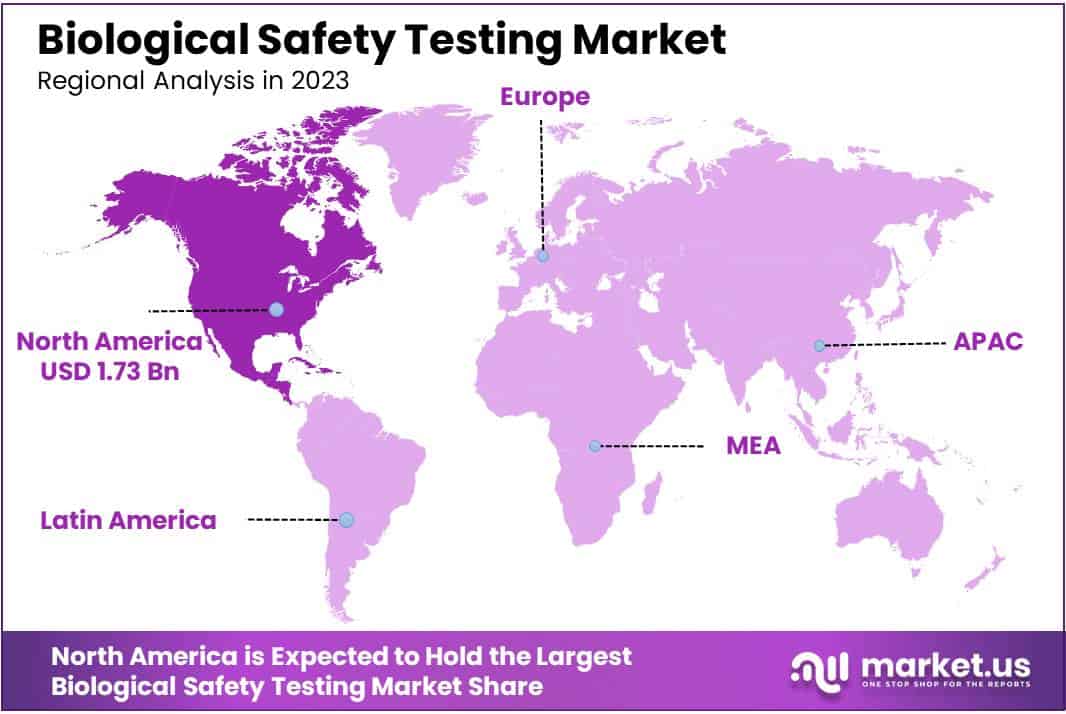
- Regional Dominance: In 2023, North America led with a market share of over 36.2%, driven by advanced healthcare infrastructure, strict regulations, and a thriving biopharmaceutical industry.
Product Analysis
In 2023, the biological safety testing market showcased a clear leader in the Reagents & Kits segment, securing a robust market presence with a commanding share of over 39.7%. This segment’s dominance can be attributed to its pivotal role in ensuring accurate and reliable testing processes. Reagents & Kits play a crucial part in biological safety testing by facilitating the detection and measurement of various biological elements, making them indispensable for laboratories and research facilities.
Following closely is the Instruments segment, demonstrating a noteworthy performance with a significant market share. Instruments are essential tools in the biological safety testing landscape, aiding researchers and professionals in conducting precise and efficient tests. In 2023, the Instruments segment emerged as a key player, contributing substantially to the overall market dynamics.
Simultaneously, Services also made a substantial impact, offering crucial support and expertise to laboratories and organizations involved in biological safety testing. With a considerable market share, the Services segment demonstrated its significance in providing specialized assistance, validation, and consultation services, thereby contributing significantly to the comprehensive biological safety testing market.
As the market evolves, the balance among these segments may shift, influenced by technological advancements, regulatory changes, and emerging trends. The dynamic interplay between Reagents & Kits, Instruments, and Services continues to shape the landscape of the biological safety testing market, reflecting the ongoing quest for innovation and excellence in ensuring biological safety.
Application Analysis
In 2023, Vaccines & Therapeutics emerged as the frontrunner in the Biological Safety Testing market, commanding a substantial 24.1% share. This dominant position reflects the vital role of safety testing in ensuring the quality and efficacy of crucial medical interventions.
Vaccines, a cornerstone of preventive healthcare, accounted for a significant portion of this segment. Rigorous safety assessments play a pivotal role in guaranteeing the reliability of these life-saving inoculations.
Monoclonal Antibodies, another integral component of Vaccines & Therapeutics, contributed to the segment’s robust standing. Ensuring the safety of these targeted therapies is paramount, considering their widespread use in treating various diseases.
The Recombinant Protein sub-segment further bolstered the Vaccines & Therapeutics category, emphasizing the market’s commitment to upholding safety standards in the development and production of these biopharmaceuticals.
Blood & Blood-based Products constituted another noteworthy segment, signifying its importance in medical applications. Safety testing in this realm is crucial for maintaining the integrity of blood transfusions and related therapies, safeguarding patients’ well-being.
The Gene Therapy segment, characterized by its innovative approach to treating genetic disorders, showcased substantial growth. As this field evolves, stringent safety evaluations become increasingly essential to ensure the safety and effectiveness of gene-based interventions.
Tissue & Tissue-based Products emerged as a significant segment in the Biological Safety Testing market. The emphasis on safety testing in this category underscores its relevance in various medical procedures, including transplantation and regenerative medicine.
Stem Cell research and applications marked a noteworthy presence, reflecting the growing interest in harnessing the potential of these cells for therapeutic purposes. The safety assessment of stem cell-based products is imperative to advance the field responsibly.
Test Type Analysis
In 2023, Endotoxin Tests emerged as the frontrunner in the Biological Safety Testing market, securing a prominent market position with a commanding share of over 22.6%. These tests play a pivotal role in ensuring the safety of biological products by detecting harmful endotoxins, contributing significantly to the market’s overall growth.
Sterility Tests, another crucial segment in the market, demonstrated robust performance, underscoring their importance in verifying the absence of viable microorganisms in biological products. This segment exhibited substantial market presence, reflecting a heightened awareness of sterility as a critical parameter in ensuring the safety and efficacy of biopharmaceuticals.
Cell Line Authentication & Characterization Tests also made a noteworthy impact on the Biological Safety Testing landscape. With an increasing emphasis on maintaining the integrity and identity of cell lines, these tests garnered considerable attention, reflecting a shift towards stringent quality control measures in the biopharmaceutical industry.
Bioburden Tests, instrumental in quantifying the microbial load in biological samples, showcased a significant market share. As biopharmaceutical production faces escalating regulatory scrutiny, the demand for accurate and reliable bioburden testing continues to rise, contributing to the segment’s substantial market presence.
Adventitious Agent Detection Tests emerged as a vital component in the Biological Safety Testing market, addressing concerns related to potential contaminants. This segment’s noteworthy position underscores the industry’s commitment to mitigating risks associated with adventitious agents, thereby bolstering the safety profile of biopharmaceutical products.
Residual Host Contamination Detection Tests also played a crucial role in the market, reflecting a heightened focus on identifying and minimizing residual host cell proteins in biopharmaceutical products. This segment’s substantial market share underscores its significance in maintaining product purity and safety.
In addition to the core segments, various other tests within the Biological Safety Testing market collectively contributed to the industry’s robust growth. These encompass a spectrum of assessments aimed at ensuring the safety, quality, and efficacy of biological products. As the industry continues to evolve, the diverse array of tests available contributes collectively to fortifying the foundation of biological safety in the rapidly advancing field of biopharmaceuticals.
Key Market Segments
Product
- Reagents & Kits
- Instruments
- Services
Application
- Vaccines & Therapeutics
- Vaccines
- Monoclonal Antibodies
- Recombinant Protein
- Blood & Blood-based Products
- Gene Therapy
- Tissue & Tissue-based Products
- Stem Cell
Test Type
- Endotoxin Tests
- Sterility Tests
- Cell Line Authentication & Characterization Tests
- Bioburden Tests
- Adventitious Agent Detection Tests
- Residual Host Contamination Detection Tests
- Others
Drivers
Growing Emphasis on Research and Development (R&D) Fuels Market Expansion
In the recent past, there has been a notable increase in financial backing dedicated to pioneering research and development in the realm of innovative biologics and biosimilars. This heightened dedication to advancing pharmaceutical and biotechnology sectors serves as a pivotal catalyst propelling the growth of the Biological Safety Testing Market. Companies are actively channeling resources to craft cutting-edge biological products, consequently fueling the demand for meticulous safety evaluations to align with stringent regulatory standards. This trend underscores a growing emphasis on R&D, steering the market expansion in a forward trajectory.
Robust Expansion of Pharmaceutical and Biotechnology Industries Drives
The pharmaceutical and biotechnology industries are experiencing significant growth globally. This expansion is propelling the demand for biological safety testing, as companies strive to ensure the safety and efficacy of their biopharmaceutical products. The increased production of biologics and biosimilars within these industries necessitates stringent testing protocols, driving the adoption of biological safety testing methodologies.
Stringent Government Regulations Shape Safety Evaluation Landscape
Governments worldwide are imposing stringent regulations to ensure the safety of biologically derived products. This regulatory landscape mandates thorough evaluation of biological safety before products can reach the market. The enforcement of strict standards by regulatory bodies acts as a catalyst for the Biological Safety Testing Market, compelling companies to adhere to comprehensive safety testing processes to meet regulatory requirements.
Paradigm Shift Towards Personalized Medicines Boosts Market Significance
A notable shift in focus towards personalized medicines and targeted therapies is steering the Biological Safety Testing Market. As the industry moves towards more tailored and precise treatments, the need for rigorous safety testing becomes paramount. The development of biologics tailored to individual patient profiles necessitates specialized safety assessments, driving the market’s importance in ensuring the well-being of patients undergoing personalized treatment regimens.
Restraints
Cost Constraints
One major obstacle in the Biological Safety Testing Market is the high cost associated with conducting tests. These expenses cover a range of factors, including advanced equipment, specialized facilities, and the procurement of necessary materials. The financial burden becomes a significant barrier for both researchers and companies, limiting their ability to invest in comprehensive biological safety testing.
Shortage of Skilled Professionals
A critical challenge faced by the Biological Safety Testing Market is the scarcity of skilled professionals proficient in conducting specialized tests. The complexity of these tests requires a workforce with specific expertise, and the shortage of such skilled personnel hampers the industry’s growth. This shortage not only affects the efficiency of testing processes but also adds pressure on existing professionals.
Ethical Concerns Regarding Animal Testing
The ethical dimension poses a notable restraint on the Biological Safety Testing Market, primarily in the context of animal toxicity testing. The use of animals for such testing raises ethical concerns, leading to public scrutiny and regulatory challenges. This creates a dilemma for businesses and researchers, compelling them to explore alternative testing methods that are both reliable and ethically sound.
Prolonged Testing Duration
Another significant factor impeding the growth of the Biological Safety Testing Market is the lengthy duration required for conducting tests. The extended timeframes for obtaining results hinder the rapid progression of research and development activities. This delay can be detrimental, especially in industries where timely product releases and regulatory compliance are crucial.
Opportunities
Technological Advancements Driving Growth
In the dynamic landscape of the Biological Safety Testing Market, one major growth catalyst is the continuous evolution of testing methods. A noteworthy example is the adoption of advanced technologies, such as the use of 3D tissue models. These cutting-edge approaches enhance the precision and efficiency of safety testing, marking a significant stride forward in the industry.
Increased outsourcing of biological safety testing services
Another pivotal factor contributing to the market’s growth is the escalating trend of outsourcing biological safety testing services. Companies are increasingly relying on specialized service providers, leveraging external expertise for efficiency and cost-effectiveness. This surge in outsourcing opens up avenues for service providers to expand their clientele and capitalize on the growing demand for outsourced testing solutions.
Emerging markets providing licensing opportunities and contract manufacturing services.
The Biological Safety Testing Market is witnessing a transformative shift with the rise of emerging markets. These regions not only present lucrative licensing opportunities but also serve as hubs for contract manufacturing services. As companies explore these untapped territories, there is a palpable potential for market expansion, with new partnerships and collaborations taking center stage in the industry’s growth trajectory.
Development of rapid microbiological testing methods
In response to the ever-increasing need for efficiency, the market is witnessing a surge in the development of rapid microbiological testing methods. This innovation addresses the demand for quicker and more responsive safety assessments. The emergence of these rapid methods not only streamlines processes but also positions companies to meet the evolving regulatory landscape with agility, ensuring compliance in a fast-paced industry.
Trends
Increased Adoption of Single-Use Technology in Production and Testing
Companies are leaning towards disposable tools and equipment during both production and testing phases. This trend is gaining momentum as it offers convenience, reduces contamination risks, and proves cost-effective in the long run. Businesses are finding value in the flexibility and efficiency that single-use technology brings to the table, streamlining processes in the biological safety testing landscape.
Automation and Robotics Gaining Traction in Bioanalytical Testing
This shift is driven by the need for precision, reproducibility, and speed in testing processes. Automated systems are becoming integral, handling complex tasks with accuracy, minimizing human error, and significantly boosting productivity. As technology advances, the incorporation of robotics is proving to be a game-changer in enhancing the reliability and efficiency of bioanalytical testing procedures.
Shift Towards In Silico Predictive Models Rather Than In Vivo Testing
In the realm of biological safety testing, there’s a noticeable shift towards in silico predictive models, moving away from traditional in vivo testing methods. This transition is fueled by advancements in computational modeling and simulation technologies. Businesses are recognizing the advantages of virtual testing, which not only reduces reliance on animal testing but also offers quicker results and a more cost-effective approach. The industry is aligning with the ethical and scientific benefits of in silico models for predicting biological safety outcomes.
Continuous Focus on Improving Speed and Efficiency of Sterility Testing
Companies are investing in innovative technologies and methodologies to expedite the identification of contaminants. The goal is to reduce testing time without compromising accuracy and reliability. This trend is driven by the need for timely release of products without compromising safety standards. The industry’s commitment to continuous improvement in sterility testing processes underscores a dedication to meeting regulatory requirements while responding to the demand for swift and efficient testing protocols.
Regional Analysis
In 2023, North America asserted its dominance in the Biological Safety Testing Market, securing a formidable market position with a commanding share of over 36.2%. The region’s robust market presence is underscored by a substantial market value of USD 1.73 billion for the year. Several factors contribute to North America’s leading role in the Biological Safety Testing Market.
In North America, the demand for biological safety testing is strong due to advanced healthcare infrastructure and strict regulations from bodies like the FDA and Health Canada. These regulations ensure safety in pharmaceuticals and biologics, creating confidence in the market.
The region’s thriving biopharmaceutical industry also contributes, as companies engage in cutting-edge research, driving the need for comprehensive safety assessments. North America’s focus on technological innovation and research excellence places it at the forefront of safety testing methods.
The ongoing challenges like the COVID-19 pandemic increase the importance of rigorous safety testing. North America’s proactive stance in addressing public health emergencies and investing in diagnostic solutions adds to the demand for robust safety procedures.
Looking ahead, North America is expected to lead in the Biological Safety Testing Market. Regulatory support, a strong biopharmaceutical industry, technological advancements, and a commitment to public health position the region to capitalize on emerging opportunities and shape the future of biological safety testing.
Key Regions
- North America
- The US
- Canada
- Mexico
- Western Europe
- Germany
- France
- The UK
- Spain
- Italy
- Portugal
- Ireland
- Austria
- Switzerland
- Benelux
- Nordic
- Rest of Western Europe
- Eastern Europe
- Russia
- Poland
- The Czech Republic
- Greece
- Rest of Eastern Europe
- APAC
- China
- Japan
- South Korea
- India
- Australia & New Zealand
- Indonesia
- Malaysia
- Philippines
- Singapore
- Thailand
- Vietnam
- Rest of APAC
- Latin America
- Brazil
- Colombia
- Chile
- Argentina
- Costa Rica
- Rest of Latin America
- Middle East & Africa
- Algeria
- Egypt
- Israel
- Kuwait
- Nigeria
- Saudi Arabia
- South Africa
- Turkey
- United Arab Emirates
- Rest of MEA
Key Players Analysis
In the dynamic landscape of the Biological Safety Testing Market, key players such as Charles River Laboratories, BSL Bioservice, Merck KGaA (MilliporeSigma), and Samsung Biologics play pivotal roles, driving innovation and shaping industry trends.
Charles River Laboratories stands out as a prominent player, leveraging its extensive expertise in preclinical and clinical research support services. Their commitment to ensuring product safety through rigorous testing procedures makes them a reliable partner for companies navigating the regulatory landscape.
BSL Bioservice contributes significantly to the market, specializing in biosafety testing and providing comprehensive solutions for the biopharmaceutical and biotechnology industries. Their emphasis on quality and compliance positions them as a go-to choice for companies seeking robust testing protocols.
Merck KGaA, operating as MilliporeSigma, stands as a key influencer in the Biological Safety Testing Market, renowned for its cutting-edge technologies and global impact. Their pivotal role in advancing biopharmaceutical manufacturing processes sets industry standards.
Another significant player, Samsung Biologics, is driving market progress with innovative biomanufacturing capabilities. Their commitment to quality and state-of-the-art facilities contributes to the increasing demand for biological safety testing services. Together, these industry leaders shape advancements, elevating the standards and ensuring the growth of this crucial market.
Beyond these key players, several other significant contributors shape the competitive landscape of the Biological Safety Testing Market. These players, ranging from established corporations to emerging entities, bring diversity and dynamism to the market. Each player adds unique value, fostering a competitive environment that fuels continuous improvement in safety testing methodologies.
Market Key Players
- Charles River Laboratories
- BSL Bioservice
- Merck KGaA (MilliporeSigma)
- Samsung Biologics
- Sartorius AG
- Eurofins Scientific
- SGS Société Générale de Surveillance SA
- Thermo Fisher Scientific Inc.
- BIOMÉRIEUX
- Lonza
Recent Developments
- In July of 2023, Charles River Laboratories, a prominent provider of preclinical contract research services, disclosed its acquisition of Cognate BioSciences. Cognate specializes in the development and provision of humanized immune system mouse models. This strategic move is anticipated to enhance Charles River’s capabilities in immuno-oncology and infectious disease research.
- In June 2023, Eurofins, a global leader in testing and laboratory services, made headlines by introducing a new suite of biological safety testing services. These services encompass testing for viral contaminants, endotoxins, and mycoplasma, further solidifying Eurofins’ position in the industry.
- In April 2023, LabCorp and Quest Diagnostics, two major players in the clinical laboratory sector in the United States, declared their plans to merge. This merger is poised to create a colossal company with an annual revenue exceeding $25 billion.
- In January 2023, Thermo Fisher Scientific, a renowned provider of scientific instruments and laboratory products, announced its acquisition of Mesa Biotech. Mesa Biotech specializes in the development and manufacturing of single-cell sequencing technology. This acquisition is set to broaden Thermo Fisher’s portfolio of genomics solutions.
Report Scope
| Report Features | Description |
|---|---|
| Market Value (2023) | USD 4.8 Bn |
| Forecast Revenue (2033) | USD 13.4 Bn |
| CAGR (2024-2033) | 10.9% |
| Base Year for Estimation | 2023 |
| Historic Period | 2018-2022 |
| Forecast Period | 2024-2033 |
| Report Coverage | Revenue Forecast, Market Dynamics, COVID-19 Impact, Competitive Landscape, Recent Developments |
| Segments Covered | Product (Reagents & Kits, Instruments, Services), Application (Vaccines & Therapeutics (Vaccines, Monoclonal Antibodies, Recombinant Protein), Blood & Blood-based Products, Gene Therapy, Tissue & Tissue-based Products, Stem Cell), Test Type (Endotoxin Tests, Sterility Tests, Cell Line Authentication & Characterization Tests, Bioburden Tests, Adventitious Agent Detection Tests, Residual Host Contamination Detection Tests, Others) |
| Regional Analysis | North America – The US, Canada, & Mexico; Western Europe – Germany, France, The UK, Spain, Italy, Portugal, Ireland, Austria, Switzerland, Benelux, Nordic, & Rest of Western Europe; Eastern Europe – Russia, Poland, The Czech Republic, Greece, & Rest of Eastern Europe; APAC – China, Japan, South Korea, India, Australia & New Zealand, Indonesia, Malaysia, Philippines, Singapore, Thailand, Vietnam, & Rest of APAC; Latin America – Brazil, Colombia, Chile, Argentina, Costa Rica, & Rest of Latin America; Middle East & Africa – Algeria, Egypt, Israel, Kuwait, Nigeria, Saudi Arabia, South Africa, Turkey, United Arab Emirates, & Rest of MEA |
| Competitive Landscape | Charles River Laboratories, BSL Bioservice, Merck KGaA (MilliporeSigma), Samsung Biologics, Sartorius AG, Eurofins Scientific, SGS Société Générale de Surveillance SA, Thermo Fisher Scientific Inc., BIOMÉRIEUX, Lonza |
| Customization Scope | Customization for segments, region/country-level will be provided. Moreover, additional customization can be done based on the requirements. |
| Purchase Options | We have three licenses to opt for: Single User License, Multi-User License (Up to 5 Users), Corporate Use License (Unlimited User and Printable PDF) |
Frequently Asked Questions (FAQ)
The biological safety testing market size is USD 4.8 billion in 2023.
The biological safety testing market is expected to grow at a CAGR of 10.9% (2024-2033).
Market.US has segmented the biological safety testing market by geographic (North America, Europe, APAC, South America, and Middle East and Africa). By Product the market has been segmented into Reagents & Kits, Instruments, Services. By Application the market has been segmented into Vaccines & Therapeutics (Vaccines, Monoclonal Antibodies, Recombinant Protein), By Blood & Blood-based Products, Gene Therapy, Tissue & Tissue-based Products, Stem Cell. By Test Type the market has been segmented into Endotoxin Tests, Sterility Tests, Cell Line Authentication & Characterization Tests, Bioburden Tests, Adventitious Agent Detection Tests, Residual Host Contamination Detection Tests, Others.
Charles River Laboratories, BSL Bioservice, Merck KGaA (MilliporeSigma), Samsung Biologics, Sartorius AG, Eurofins Scientific, SGS Société Générale de Surveillance SA, Thermo Fisher Scientific Inc., BIOMÉRIEUX, Lonza and other key players.
North America is expected to account for the highest revenue share of 36.2% and boasting an impressive market value of USD 1.73 billion. Therefore, the biological safety testing industry in North America is expected to garner significant business opportunities over the forecast period.
The US, Canada, India, China, UK, Japan, & Germany are key areas of operation for the biological safety testing Market.


