


Market Overview
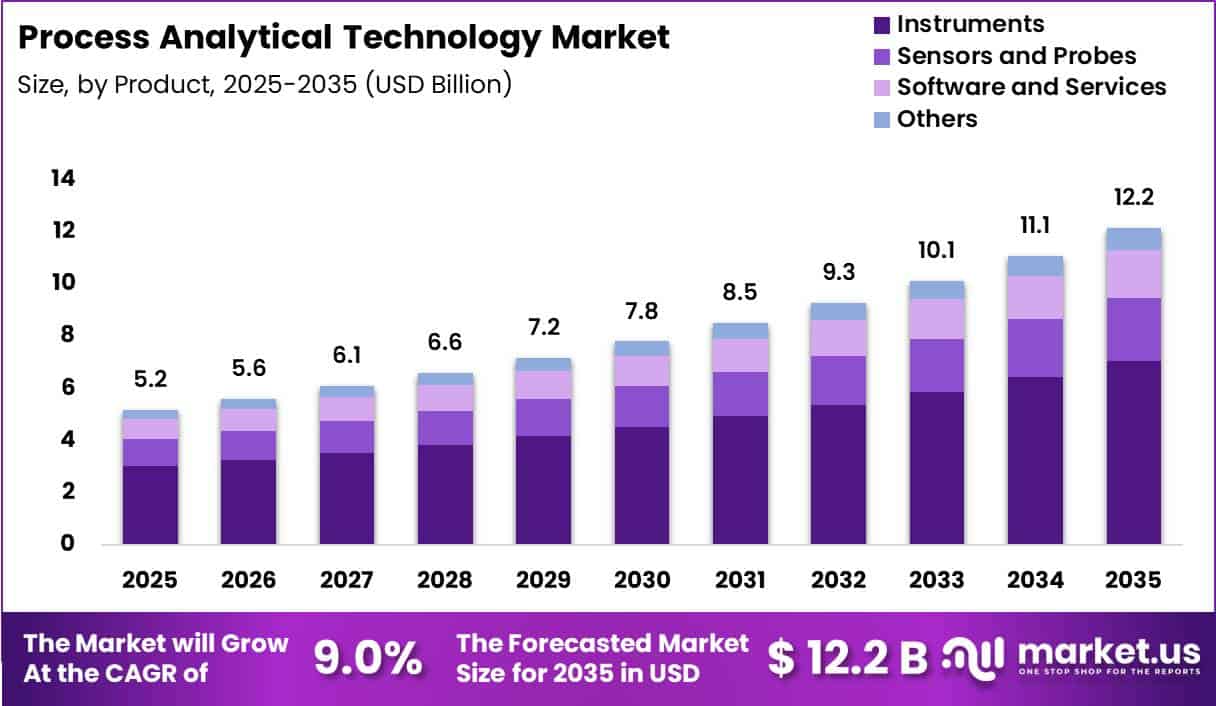
Global Process Analytical Technology Market size is expected to be worth around US$ 12.2 Billion by 2035 from US$ 5.2 Billion in 2025, growing at a CAGR of 9.0% during the forecast period from 2026 to 2035. In 2025, North America led the market, achieving over 38.0% share with a revenue of US$ 2.0 Billion.
The Process Analytical Technology (PAT) Market is gaining importance as pharmaceutical manufacturers move toward smarter, data-driven, and more continuous production systems. PAT enables manufacturers to design, analyze, and control pharmaceutical processes by measuring critical process parameters that influence critical quality attributes.
Technologies such as near-infrared (NIR) spectroscopy, Raman spectroscopy, process chromatography, sensors, and advanced data analytics support real-time or near-real-time monitoring of production processes.
The U.S. Food and Drug Administration (FDA) introduced its PAT framework in 2004 to encourage innovative pharmaceutical development, manufacturing, and quality assurance. The approach promotes improved process understanding and enhanced manufacturing control rather than relying solely on testing finished products.
The market is also supported by the growing adoption of continuous manufacturing, where PAT can provide non-destructive, real-time analysis and allow manufacturers to monitor a large number of samples throughout production. This can strengthen process control, improve consistency, and help identify deviations earlier.
The World Health Organization (WHO) emphasizes that pharmaceutical quality must be built into manufacturing processes and maintained through appropriate quality controls. Its 2024 GMP compendium spans 1,332 pages, reflecting the extensive regulatory and quality requirements surrounding pharmaceutical production.
As manufacturers increasingly prioritize quality-by-design, automation, and real-time monitoring, PAT is expected to remain an important technology for modern pharmaceutical manufacturing.
Key Takeaways
- Market Size: Global Process Analytical Technology Market size is expected to be worth around US$ 12.2 Billion by 2035 from US$ 5.2 Billion in 2025.
- Market Share: The market is growing at a CAGR of 9.0% during the forecast period from 2026 to 2035.
- Product: The Product segment of the Process Analytical Technology (PAT) Market is led by Instruments, including Spectroscopy and Chromatography, which accounted for 58.0% of the market share in 2025.
- End User: The End User segment of the Process Analytical Technology Market is dominated by Pharmaceutical and Biopharmaceutical Manufacturers, which held a 55.0% market share in 2025.
- Application: The Application segment of the Process Analytical Technology Market is led by In-line Monitoring and Control, which accounted for 25.0% of the market share in 2025.
- Technique: The Technique segment of the Process Analytical Technology Market is dominated by Spectroscopic Techniques, which accounted for 51.9% of the market share in 2025.
- Sampling Mode: The Sampling Mode segment of the Process Analytical Technology Market is led by In-line systems, which accounted for 45.0% of the market share in 2025
- Regional Analysis: In 2025, North America led the market, achieving over 38.0% share with a revenue of US$ 2.0 Billion.
Product Analysis
Product segment of the Process Analytical Technology (PAT) Market is led by Instruments.
The Product segment of the Process Analytical Technology (PAT) Market is led by Instruments, including Spectroscopy and Chromatography, which accounted for 58.0% of the market share in 2025. These instruments are widely adopted because they enable continuous measurement of critical process parameters and quality attributes, helping manufacturers detect deviations and maintain consistent product quality.
Spectroscopic systems, such as near-infrared and Raman technologies, are increasingly used for rapid, non-destructive analysis, while chromatography supports detailed chemical composition monitoring.
Sensors and Probes represented 20.0% of the market in 2025, supported by their role in measuring temperature, pressure, pH, dissolved oxygen, and other process conditions. Software and Services accounted for 15.0%, reflecting growing demand for data acquisition, process control, analytics, integration, and regulatory support.
The Others category held the remaining 7.0%. Overall, increasing automation, real-time quality monitoring, and the adoption of continuous manufacturing are strengthening demand for integrated PAT products across regulated production environments.
End User Analysis
End User segment of the Process Analytical Technology Market is dominated by Pharmaceutical and Biopharmaceutical Manufacturers.
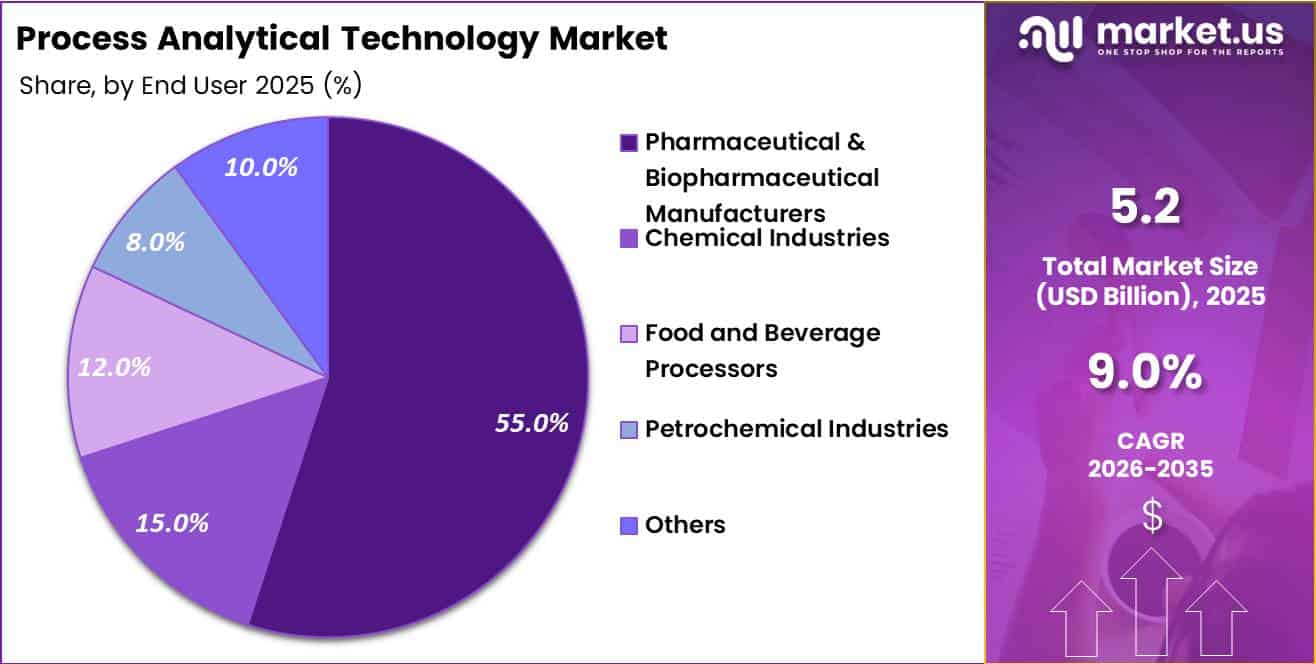
The End User segment of the Process Analytical Technology Market is dominated by Pharmaceutical and Biopharmaceutical Manufacturers, which held a 55.0% market share in 2025.
The pharmaceutical sector remains the largest adopter of PAT because manufacturers increasingly use real-time monitoring to improve product consistency, reduce batch variability, optimize manufacturing processes, and support regulatory compliance. PAT is particularly valuable in biopharmaceutical production, where sensitive processes such as fermentation, cell culture, and purification require close monitoring.
Chemical Industries accounted for 15.0% of the market in 2025, using PAT solutions to improve process efficiency, safety, and chemical quality. Food and Beverage Processors represented 12.0%, supported by demand for rapid quality checks and improved production consistency.
Petrochemical Industries contributed 8.0%, with applications focused on process optimization, composition monitoring, and operational safety. The Others segment accounted for 10.0%. Growing automation and the shift toward data-driven manufacturing are expected to expand PAT adoption across diverse industrial end users.
Application Analysis
Application segment of the Process Analytical Technology Market is led by In-line Monitoring and Control.
The Application segment of the Process Analytical Technology Market is led by In-line Monitoring and Control, which accounted for 25.0% of the market share in 2025.
In-line PAT systems allow manufacturers to monitor critical process parameters directly within production lines, enabling rapid detection of variations and timely adjustments without interrupting operations. This application is particularly important for continuous manufacturing and highly controlled production environments.
Real-time Release Testing is another important application, allowing manufacturers to evaluate product quality during production and potentially reduce reliance on lengthy end-stage testing. Fermentation and Cell Culture Monitoring supports biopharmaceutical manufacturing by tracking parameters such as pH, dissolved oxygen, temperature, and nutrient conditions to maintain optimal biological processes.
Blend Uniformity Analysis is widely used in pharmaceutical manufacturing to ensure consistent distribution of active ingredients and excipients throughout a batch. The Others category includes applications across process optimization, raw material characterization, and quality assurance.
Increasing demand for faster production cycles, improved quality, and reduced manufacturing variability continues to drive PAT adoption across these applications.
Technique Analysis
Technique segment of the Process Analytical Technology Market is dominated by Spectroscopic Techniques.
The Technique segment of the Process Analytical Technology Market is dominated by Spectroscopic Techniques, which accounted for 51.9% of the market share in 2025.
Spectroscopy has become a widely used PAT approach because it enables rapid, non-destructive, and real-time analysis of materials and processes. Techniques such as near-infrared, Raman, and infrared spectroscopy can monitor chemical composition and critical quality attributes without requiring extensive sample preparation.
Chromatographic Techniques represent another important segment, supporting detailed analysis of chemical compounds and impurities and playing a significant role in pharmaceutical, biopharmaceutical, and chemical manufacturing.
These techniques are particularly valuable when high analytical specificity is required. Particle Size Analysis Techniques are used to measure and control particle characteristics that can influence product performance, dissolution, stability, and manufacturing consistency.
The Others category includes additional analytical methods used for specialized process monitoring and quality control. Overall, growing adoption of real-time analytics, advanced manufacturing systems, and continuous production is increasing demand for sophisticated PAT techniques capable of delivering reliable process and quality information.
Sampling Mode Analysis
Sampling Mode segment of the Process Analytical Technology Market is led by In-line systems.
The Sampling Mode segment of the Process Analytical Technology Market is led by In-line systems, which accounted for 45.0% of the market share in 2025.
In-line sampling enables measurements to be performed directly within the production process, reducing the need for manual sample collection and minimizing delays between production and analysis. This approach supports continuous monitoring and allows manufacturers to respond quickly when process conditions move outside desired ranges.
On-line sampling represents another important mode, where samples are automatically transferred from the process to analytical instruments for near-real-time evaluation. This approach provides frequent measurements while maintaining a degree of separation between the production equipment and analytical system.
At-line sampling involves testing close to the production area, allowing operators to obtain rapid analytical results without sending samples to a centralized laboratory. Off-line sampling relies on conventional laboratory analysis and remains relevant where complex testing or highly specialized equipment is required.
The growing focus on continuous manufacturing, automation, faster decision-making, and improved process control is supporting wider adoption of real-time and near-real-time sampling modes.
Key Market Segments
By Product
- Instruments (Spectroscopy, Chromatography)
- Sensors and Probes
- Software and Services
- Others
By End User
- Pharmaceutical and Biopharmaceutical Manufacturers
- Chemical Industries
- Food and Beverage Processors
- Petrochemical Industries
- Others
By Application
- In-line Monitoring and Control
- Real-time Release Testing
- Fermentation and Cell Culture Monitoring
- Blend Uniformity Analysis
- Others
By Technique
- Spectroscopic Techniques
- Chromatographic Techniques
- Particle Size Analysis Techniques
- Others
By Sampling Mode
- In-line
- On-line
- At-line
- Off-line
Drivers
FDA led real time release and quality by design adoption.
FDA’s PAT framework still matters in 2026 because it explicitly supports measuring critical process parameters and using those signals to improve manufacturing and quality assurance in real time, which lowers reliance on end product testing and makes release by exception more plausible in tightly validated environments.
In practical terms, that changes the business model for PAT vendors from one time instrument sales to recurring software, model maintenance, and validation support revenue, because manufacturers need spectral libraries, calibration upkeep, audit trails, and lifecycle documentation rather than only probes or analyzers.
For drug makers, even a modest reduction in deviation related scrap or quarantine time can support adoption economics: on high value sterile, oral solid, or biologics lines, avoiding one failed batch or shaving several days from release timing can justify six to seven figure digital and sensor investments, especially where batch value is high and working capital tied in inventory is material; this is why uptake is strongest in the U.S., EU, and export oriented APAC sites facing the toughest documentation and inspection expectations.
| Driver | (~) % Impact on CAGR Forecast | Geographic Relevance | Impact Timeline |
|---|---|---|---|
| FDA-led real-time release and quality-by-design adoption | +2.3% | North America core, EU regulated plants, APAC export hubs | Short term (≤ 2 years) |
| Continuous manufacturing scale-up under ICH Q13 control frameworks | +1.9% | North America core, EU, Japan, South Korea, India API corridors | Medium term (2-4 years) |
| Bioprocess intensification and higher-value biologics monitoring needs | +2.1% | U.S. biologics clusters, EU biologics, Singapore, South Korea, China | Short term (≤ 2 years) |
| Raman, NIR, and multivariate analytics moving from pilot to production | +1.6% | North America, EU, Japan, China advanced sites | Medium term (2-4 years) |
| Supply resilience and right-first-time manufacturing economics | +1.4% | U.S. and EU domestic manufacturing, India, China, Latin America spill-over | Short term (≤ 2 years) |
| FDA advanced manufacturing incentives de-risking capex decisions | +1.2% | North America core, EU followers, APAC innovation centers | Long term (≥ 4 years) |
Challenges
Cross-Disciplinary Talent Shortage Slows PAT Deployment Scaling.
The adoption of Process Analytical Technology PAT is constrained by a shortage of professionals who can bridge pharmaceutical manufacturing, chemometrics, process control engineering, and regulatory compliance. Most large organizations report only a small pool of true cross functional experts distributed across global manufacturing networks, limiting how quickly PAT systems can be deployed at scale.
As a result, implementation capacity is heavily concentrated. Senior PAT leads often manage multiple concurrent projects across different sites, creating bottlenecks that extend deployment timelines by 12–24 months compared with fully resourced execution models. This limits how rapidly advanced monitoring and control systems can be embedded into production lines.
Skill development is another constraint. Building proficiency in multivariate data analysis, spectroscopic calibration, and model based control typically requires 18–36 months of structured training before engineers can independently design and validate PAT models using large scale production data.
Because of these constraints, many manufacturing sites prioritize only a few high impact PAT initiatives per year, even when multiple additional opportunities exist. This slows overall penetration, with only a minority of eligible processes fully integrated into advanced monitoring systems.
Overall, the talent gap limits the pace of digital manufacturing transformation, delays productivity gains, and slows the transition toward broader real time release adoption across the pharmaceutical industry.
| Challenge | (~) % CAGR Friction Drag | Geographic Relevance | Mitigation Horizon |
|---|---|---|---|
| Legacy batch asset inertia | -1.4% | North America, EU, Japan | Long term (≥ 4 years) |
| Multivariate data integration gap | -1.1% | US, EU, APAC pharma hubs | Medium term (2-4 years) |
| Cross-disciplinary PAT talent deficit | -1.0% | Global Tier-1 pharma clusters | Long term (≥ 4 years) |
| Validation and lifecycle documentation load | -0.8% | US, EU regulated markets | Medium term (2-4 years) |
| Supplier instrumentation interoperability | -0.7% | EU, US, emerging APAC sites | Medium term (2-4 years) |
| Organizational change management drag | -0.9% | Global large-scale manufacturers | Long term (≥ 4 years) |
Restraints
High Upfront CAPEX and OPEX Burden in PAT Adoption.
Full stack PAT deployment in small and mid tier pharma and biopharma plants involves significant upfront investment in spectroscopic probes, analytics software, edge computing systems, and validated data infrastructure, typically costing several million dollars per site over a multi year implementation cycle.
This level of investment places meaningful pressure on capital budgets, often extending payback expectations from 3–4 years to 5–6 years and pushing adoption into later technology upgrade cycles.
As a result, deployment tends to be phased rather than enterprise wide.On the operating side, ongoing costs from calibration, maintenance, software licensing, and GMP compliant IT support add incremental per unit manufacturing costs, which can compress margins for products operating in already cost sensitive environments.
With rising input costs across APIs, energy, and logistics, many manufacturers prioritize capacity expansion and compliance investments over advanced analytics infrastructure, further slowing adoption.Overall, the combined capital intensity and recurring operating burden delay PAT scaling and moderate near term market growth potential.
| Restraint | (~) % Impact on CAGR Forecast | Geographic Relevance | Impact Timeline |
|---|---|---|---|
| High upfront CAPEX and OPEX burden | -2.0% | North America core, EU, Japan, South Korea | Medium term (2–4 years) |
| Data integration, cybersecurity, and validation complexity | -1.5% | North America core, EU, APAC corridors | Medium term (2–4 years) |
| Regulatory conservatism and approval cycle lag | -1.2% | EU, Japan, emerging APAC, LATAM | Long term (≥ 4 years) |
| Skilled workforce and digital competency gap | -0.8% | EU periphery, India, ASEAN, LATAM | Medium term (2–4 years) |
| Brownfield retrofitting and plant downtime risk | -1.0% | Legacy plants in North America, EU, India | Short to medium term (≤ 4 years) |
Opportunity
Cross Vertical Expansion of PAT into Specialty Chemicals and Bioprocessing.
Process Analytical Technology PAT adoption remains concentrated in pharmaceutical manufacturing, even though similar real time monitoring and control requirements exist across specialty chemicals, industrial biotechnology, nutraceuticals, and high value food ingredient production.
These adjacent sectors are still significantly underpenetrated, leaving a substantial expansion opportunity.In many chemical and bioprocessing operations, fewer than a quarter of continuous reactors and fermentation systems are equipped with advanced PAT grade analytics.
As a result, process variability continues to drive material inefficiencies, including yield losses of 5–10% and off spec production rates of 3–7% in certain high value processes. By adapting PAT platforms with sector specific libraries such as polymerization control models, enzymatic reaction monitoring tools, and fermentation optimization algorithms, vendors can extend their addressable market beyond regulated pharma environments.
Modular service models combining hardware, analytics, and process optimization services further enhance applicability across industries.This cross vertical expansion could unlock meaningful incremental demand in specialty chemicals and bioprocessing by the early 2030s, with measurable productivity improvements of 4–6% and margin expansion of 2–4% points in optimized production lines.
Overall, diversification beyond pharma reduces reliance on regulatory driven adoption cycles and opens a broader industrial automation opportunity, strengthening long term growth potential for PAT platforms.
| Opportunity | (~) % Potential CAGR Upside | Geographic Relevance | Execution Window |
|---|---|---|---|
| Pharma 4.0 closed-loop PAT suites | +2.5% | North America, EU, Japan, South Korea | Medium term (2-4 years) |
| Cross-vertical PAT for specialty chemicals & bioprocessing | +2.0% | North America, EU, China, APAC emerging | Medium term (2-4 years) |
| Cloud-native PAT analytics & subscription models | +1.8% | Global, esp. North America & EU | Short term (≤ 2 years) |
| Integrated PAT–MES–QMS compliance platforms for GxP | +1.5% | North America, EU, GCC, India | Medium term (2-4 years) |
| PAT-enabled continuous manufacturing & modular plants | +2.2% | North America, EU, China, India | Long term (≥ 4 years) |
| AI-driven PAT twins for advanced biologics & cell/gene therapy | +1.7% | North America, EU, Japan | Long term (≥ 4 years) |
Regional Analysis
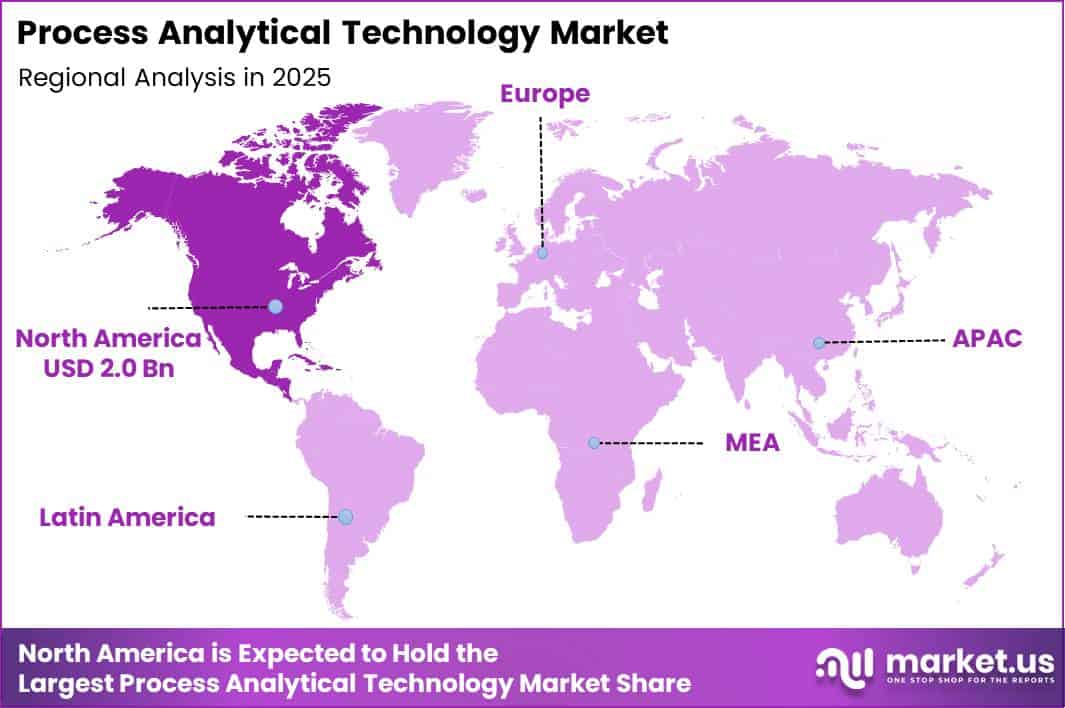
In 2025, North America led the global Process Analytical Technology (PAT) Market.
North America led the global Process Analytical Technology (PAT) Market in 2025, accounting for more than 38.0% of the market share, with revenue reaching approximately US$ 2.0 billion. The region’s leadership is supported by strong pharmaceutical and biopharmaceutical manufacturing capabilities, advanced process automation, and widespread adoption of real-time monitoring technologies.
The United States remains the major contributor, driven by strict quality requirements, increasing use of continuous manufacturing, and investments in smart manufacturing and data-driven production systems. The presence of established pharmaceutical companies and advanced research infrastructure further strengthens regional demand for PAT solutions.
Europe represents another important market, supported by stringent regulatory frameworks, advanced drug manufacturing facilities, and growing emphasis on improving product quality and manufacturing efficiency. The region is increasingly adopting spectroscopy, chromatography, sensors, and process control software to support real-time quality monitoring.
Asia-Pacific is expected to witness strong growth as pharmaceutical production expands across China, Japan, South Korea, and other emerging economies. Increasing investments in biopharmaceutical manufacturing, modernization of production facilities, and adoption of Industry 4.0 technologies are creating new opportunities.
Meanwhile, Latin America and the Middle East & Africa are gradually adopting PAT solutions as healthcare manufacturing infrastructure develops and regulatory standards become more advanced.
Key Regions and Countries
North America
- The US
- Canada
Europe
- Germany
- France
- The U.K.
- Italy
- Spain
- Russia & CIS
- Rest of Europe
Asia Pacific
- China
- India
- Japan
- South Korea
- ASEAN
- Australia & New Zealand
- Rest of Asia Pacific
Middle East & Africa
- GCC
- South Africa
- Rest of Middle East & Africa
Latin America
- Brazil
- Mexico
- Rest of Latin America
Key Player Analysis
The Process Analytical Technology (PAT) Market is moderately consolidated, with leading companies competing through advanced analytical technologies, automation, real-time monitoring, and integrated process solutions.
Competitive dynamics are driven by analytical accuracy, regulatory compliance, software capabilities, product innovation, and workflow integration. Innovation is increasingly focused on spectroscopy, chromatography, sensors, automation, and digital connectivity to improve manufacturing quality and operational efficiency.
Agilent Technologies, Inc. focuses on R&D and advanced analytical instruments, strengthening its position through innovative technologies and integrated laboratory workflows. Thermo Fisher Scientific Inc. emphasizes broad analytical portfolios, product innovation, and solutions connecting laboratory analysis with manufacturing processes.
Bruker Corporation competes through advanced spectroscopy and analytical technologies supported by continuous R&D. Danaher Corporation follows an ecosystem-based strategy combining analytical technologies, automation, software, and workflow integration. Shimadzu Corporation focuses on product innovation, analytical precision, and integrated measurement solutions.
Overall, these top five players are strengthening their competitive positions through R&D investments, strategic partnerships, product innovation, workflow integration, and ecosystem-based competition.
Their strategies focus on delivering accurate, automated, and connected PAT solutions that support real-time process monitoring, quality control, regulatory compliance, and efficient manufacturing operations across pharmaceutical, biopharmaceutical, chemical, and other process industries.
Top Key Players
- Agilent Technologies, Inc.
- Thermo Fisher Scientific Inc.
- Bruker Corporation
- Danaher Corporation
- Shimadzu Corporation
- PerkinElmer Inc.
- Waters Corporation
- Metrohm AG
- Foss A/S
- Malvern Panalytical Ltd.
- Kaiser Optical Systems, Inc.
- Buchi Labortechnik AG
- Carl Zeiss AG
- Sartorius AG
- Mettler-Toledo International Inc.
- Others
Recent Developments
- In June 2026, Agilent completed its acquisition of Biocare Medical, bringing the company into its Life Sciences and Diagnostics Markets Group. The transaction is expected to strengthen Agilent’s pathology offering and expand its ability to serve clinical and research customers with complementary analytical and diagnostic solutions.
- In March 2026, Shimadzu Scientific Instruments opened a new R&D laboratory in South San Francisco to accelerate product and business development for pharmaceutical and life-science applications. The expansion strengthens the company’s local innovation capabilities and supports closer collaboration with customers in a major U.S. biotechnology hub.
- In May 2026, Waters reported first-quarter 2026 revenue of $1.267 billion, with organic revenue increasing 13% as reported. The company highlighted strong performance from its Analytical Sciences Division, including high-single-digit instrument growth and mid-teens chemistry growth, indicating continued demand for advanced analytical technologies.
Report Scope
| Report Features | Description |
|---|---|
| Market Value (2025) | US$ 5.2 Billion |
| Forecast Revenue (2035) | US$ 12.2 Billion |
| CAGR (2026-2035) | 9.0% |
| Base Year for Estimation | 2025 |
| Historic Period | 2020-2024 |
| Forecast Period | 2026-2035 |
| Report Coverage | Revenue Forecast, Market Dynamics, Competitive Landscape, Recent Developments |
| Segments Covered | By Product (Instruments (Spectroscopy, Chromatography), Sensors and Probes, Software and Services, Others), By End User (Pharmaceutical and Biopharmaceutical Manufacturers, Chemical Industries, Food and Beverage Processors, Petrochemical Industries, Others), By Application (In-line Monitoring and Control, Real-time Release Testing, Fermentation and Cell Culture Monitoring, Blend Uniformity Analysis, Others), By Technique (Spectroscopic Techniques, Chromatographic Techniques, Particle Size Analysis Techniques, Others), By Sampling Mode (In-line, On-line, At-line, Off-line) |
| Regional Analysis | North America – The US, Canada; Europe – Germany, France, U.K., Italy, Spain, Russia & CIS, Rest of Europe; Asia Pacific – China, India, Japan, South Korea, ASEAN, Australia & New Zealand, Rest of Asia Pacific; Middle East & Africa – GCC, South Africa, Rest of Middle East & Africa; Latin America – Brazil, Mexico, Rest of Latin America |
| Competitive Landscape | Agilent Technologies, Inc., Thermo Fisher Scientific Inc., Bruker Corporation, Danaher Corporation, Shimadzu Corporation, PerkinElmer Inc., Waters Corporation, Metrohm AG, Foss A/S, Malvern Panalytical Ltd., Kaiser Optical Systems, Inc., Buchi Labortechnik AG, Carl Zeiss AG, Sartorius AG, Mettler-Toledo International Inc., Others |
| Customization Scope | Customization for segments, region/country-level will be provided. Moreover, additional customization can be done based on the requirements. |
| Purchase Options | We have three licenses to opt for: Single User License, Multi-User License (Up to 5 Users), Corporate Use License (Unlimited User and Printable PDF) |





































