


Market Overview
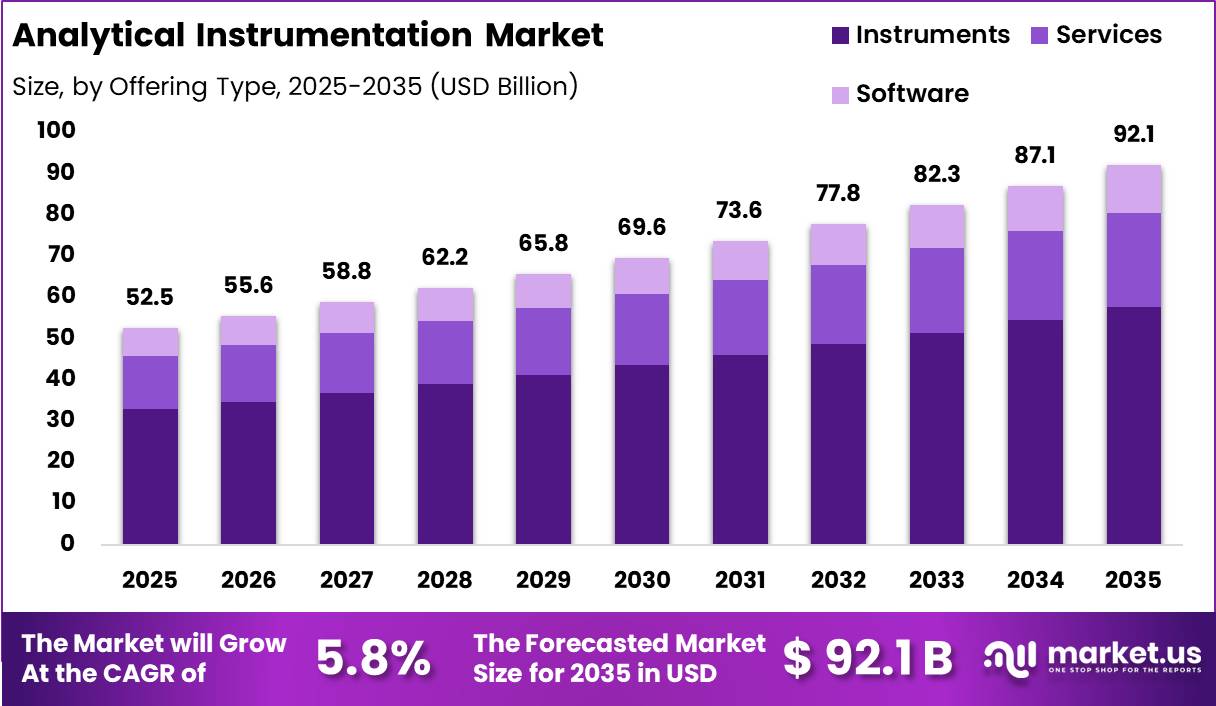
Global Analytical Instrumentation Market size is expected to be worth around US$ 92.1 Billion by 2035 from US$ 52.5 Billion in 2025, growing at a CAGR of 5.8% during the forecast period from 2026 to 2035. In 2025, North America led the market, achieving over 38.5% share with a revenue of US$ 20.23 Billion.
Analytical instrumentation comprises advanced laboratory and process-analysis technologies used to identify, quantify, and characterize the chemical, biological, and physical properties of materials with high precision. These instruments including spectroscopy, chromatography, mass spectrometry, elemental analyzers, and molecular analysis systems are essential across pharmaceutical manufacturing, biotechnology, clinical diagnostics, food safety, environmental monitoring, chemicals, and academic research.
Growing regulatory requirements for product quality, laboratory accreditation, and environmental compliance continue to increase demand for accurate analytical testing across both public and private sectors.
Government and healthcare organizations continue to expand investments in analytical science and laboratory infrastructure. The U.S. Food and Drug Administration relies extensively on advanced analytical technologies to evaluate drug quality, biologics, food contaminants, and medical products before and after commercialization.
Similarly, the U.S. Environmental Protection Agency uses analytical instruments for monitoring drinking water, air pollutants, hazardous chemicals, and environmental contaminants. The National Institutes of Health supports thousands of biomedical research projects that depend on high-resolution analytical platforms for genomics, proteomics, metabolomics, and precision medicine research.
Analytical instrumentation is also supported by expanding scientific research activity worldwide. According to the UNESCO, global expenditure on research and development exceeds US$ 2.8 trillion annually, reflecting sustained investment in scientific infrastructure and laboratory technologies.
In the United States, the National Center for Science and Engineering Statistics reports that national R&D expenditures surpassed US$ 940 billion in recent years, demonstrating continued demand for sophisticated analytical equipment across industry, government laboratories, and universities.
Additionally, the Centers for Disease Control and Prevention operates nationwide laboratory networks that depend on advanced analytical instruments for disease surveillance, outbreak investigations, and public health testing, reinforcing the critical role of analytical instrumentation in modern healthcare and scientific innovation.
Key Takeaways
- Market Size: The global Analytical Instrumentation Market was valued at US$ 52.5 Billion in 2025.
- Market Share: The global Analytical Instrumentation Market is projected to grow at a CAGR of 5.8% and is estimated to reach US$ 92.1 Billion by 2035.
- Offering Analysis: Instruments dominated the market, accounting for 62.5% of the total market share in 2025.
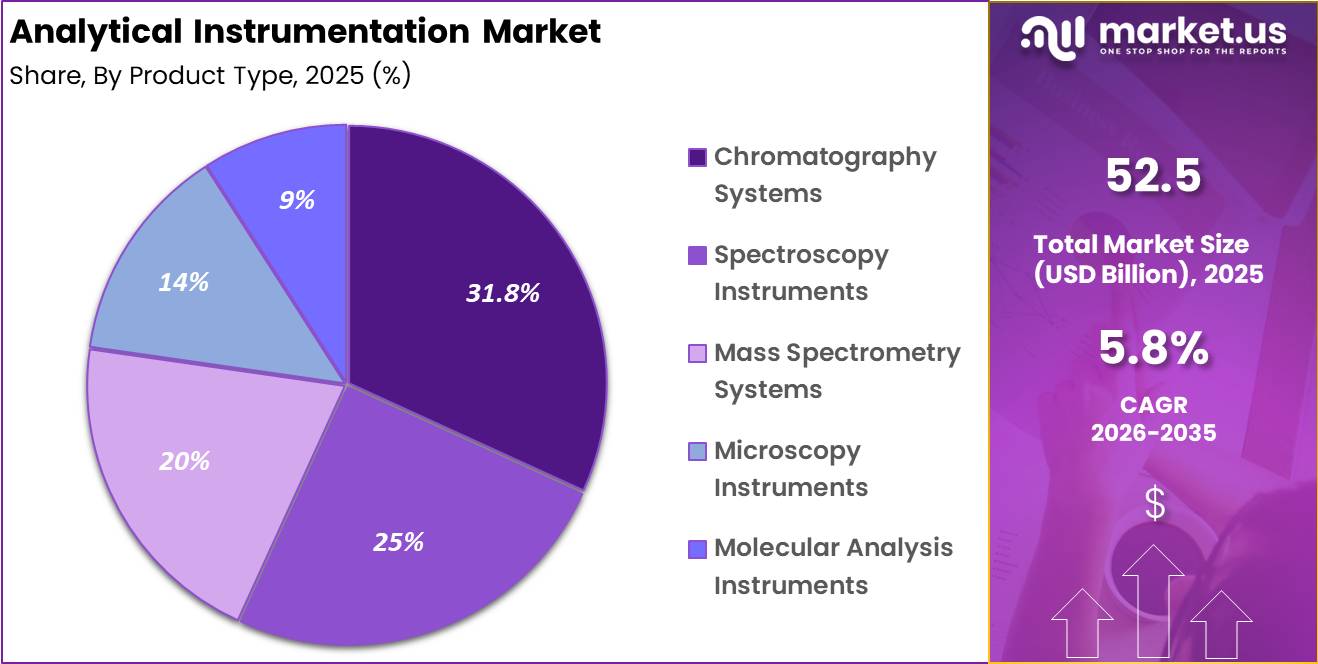
- Product Type Analysis: Chromatography Systems dominated the market, constituting 28.7% of the total market share.
- Application Analysis: Life Sciences Research and Development dominated the market, constituting 32.0% of the total market share.
- End Use Analysis: Pharmaceutical and Biotechnology Companies dominated the market, constituting 35.0% of total market share.
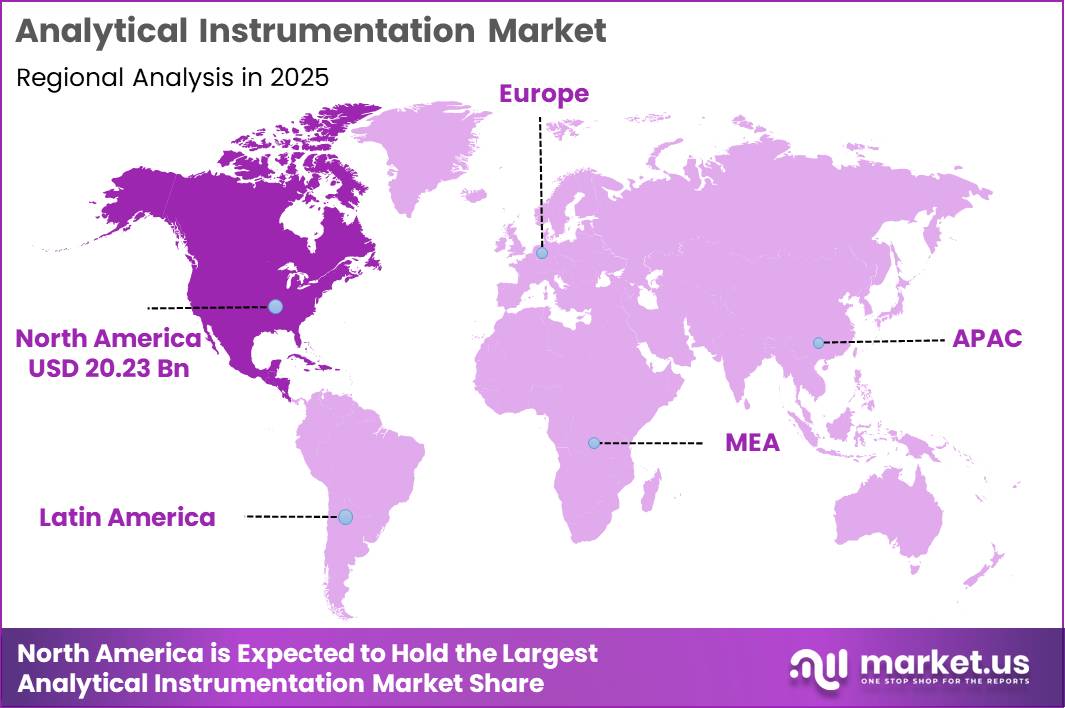
- Regional Analysis: In 2025, North America led the market, achieving over 38.5% share with a revenue of US$ 20.23 Billion.
Offering Analysis
The instruments segment dominated the analytical instrumentation market in 2025, accounting for 62.5% of the total market share. This leadership is driven by the increasing adoption of advanced laboratory equipment across pharmaceutical, biotechnology, environmental, food testing, and industrial quality control applications. Laboratories continue to invest in high-performance analytical systems to improve precision, throughput, and compliance with stringent regulatory standards.
Continuous technological advancements, including automation, digital connectivity, and enhanced detection capabilities, have further strengthened demand for sophisticated instruments. The growing emphasis on research and development, coupled with expanding laboratory infrastructure worldwide, also contributes significantly to this segment’s growth.
The service segment captured 24.8% of the market in 2025, supported by rising demand for instrument installation, calibration, preventive maintenance, repair, validation, and technical support services. As analytical instruments become increasingly complex, organizations rely on specialized service providers to maximize equipment uptime, maintain measurement accuracy, and comply with quality regulations.
Meanwhile, the software segment represented 12.7% of the market, benefiting from the increasing use of laboratory information management systems (LIMS), data analytics platforms, workflow automation, and cloud-based instrument management solutions.
Software is becoming essential for efficient data processing, regulatory documentation, instrument integration, and remote laboratory operations, supporting productivity and informed decision-making across research and industrial laboratories.
Product Type Analysis
The chromatography systems segment held the largest share of the analytical instrumentation market in 2025, accounting for 28.0% of total revenue. Its market leadership is supported by widespread applications in pharmaceutical development, environmental monitoring, food safety testing, chemical analysis, and forensic investigations.
Chromatography remains a preferred analytical technique due to its exceptional separation efficiency, sensitivity, and ability to analyze complex mixtures with high precision. Growing investments in drug discovery, biologics development, and quality assurance continue to sustain demand for advanced chromatography platforms.
The spectroscopy instruments segment accounted for 22.0% of the market, driven by increasing applications in material characterization, pharmaceutical quality control, environmental testing, and academic research.
Mass spectrometry systems represented 18.0%, supported by their critical role in proteomics, metabolomics, biomarker discovery, and advanced molecular identification. The microscopy instruments segment captured 12.0% of market revenue, benefiting from expanding applications in nanotechnology, life sciences, semiconductor manufacturing, and materials research.
Meanwhile, molecular analysis instruments accounted for 8.0%, fueled by rising adoption in genetic testing, molecular diagnostics, infectious disease detection, and personalized medicine. Continuous technological innovation across all product categories continues to enhance analytical performance, automation, and laboratory productivity.
Application Analysis
The Life Sciences Research and Development segment dominated the analytical instrumentation market in 2025, capturing 32.0% of the overall market share. The segment’s leadership is driven by increasing investments in pharmaceutical innovation, biotechnology research, genomics, proteomics, and precision medicine.
Analytical instruments are indispensable for drug discovery, biomarker identification, molecular characterization, and clinical research, where high sensitivity, accuracy, and reproducibility are essential. Rising research funding from both public and private organizations continues to accelerate demand for advanced laboratory technologies capable of supporting complex scientific investigations.
Beyond life sciences, analytical instrumentation is extensively utilized across environmental testing, food and beverage analysis, industrial process monitoring, chemical research, forensic science, clinical diagnostics, and academic laboratories.
Environmental laboratories increasingly rely on sophisticated analytical technologies to monitor pollutants and ensure regulatory compliance, while food manufacturers use these systems to detect contaminants and maintain product quality.
Industrial applications benefit from accurate material characterization and process optimization, supporting manufacturing efficiency and product consistency. Clinical laboratories continue to adopt advanced analytical platforms for disease diagnosis and therapeutic monitoring.
As laboratory automation, digital data management, and high-throughput analysis become increasingly important, analytical instrumentation continues to expand across diverse application areas, strengthening operational efficiency and scientific accuracy throughout multiple industries.
End Use Analysis
The pharmaceutical and biotechnology companies segment dominated the analytical instrumentation market in 2025, accounting for 35.0% of the total market share. The segment’s leadership is primarily attributed to extensive utilization of analytical instruments throughout drug discovery, formulation development, clinical research, manufacturing, and quality assurance processes.
Increasing investments in biologics, cell and gene therapies, vaccine development, and precision medicine continue to stimulate demand for highly accurate analytical technologies. Strict regulatory requirements governing pharmaceutical manufacturing also encourage continuous adoption of advanced analytical systems to ensure product quality, safety, and compliance.
Other major end users include academic and research institutes, contract research organizations (CROs), hospitals and diagnostic laboratories, environmental testing laboratories, food and beverage companies, and industrial manufacturing facilities.
Academic institutions continue to expand analytical capabilities through government-funded research programs and collaborative innovation projects. CROs increasingly invest in advanced instrumentation to support outsourced pharmaceutical and biotechnology research activities.
Hospitals and diagnostic laboratories utilize sophisticated analytical platforms for disease diagnosis and clinical testing, while environmental laboratories rely on these systems for pollution monitoring and regulatory compliance.
Food manufacturers and industrial organizations also employ analytical instrumentation to maintain quality standards, optimize production processes, and ensure product consistency, further broadening the market’s long-term growth potential.
Market Segmentations
By Offering
- Instruments
- Services
- Software
By Product Type
- Chromatography Systems
- Spectroscopy Instruments
- Mass Spectrometry Systems
- Microscopy Instruments
- Molecular Analysis Instruments
By Application
- Life Sciences Research and Development
- Clinical and Diagnostic Analysis
- Environmental Testing
- Food and Beverage Analysis
- Pharmaceutical Quality Control
By End Use
- Pharmaceutical and Biotechnology Companies
- Academic and Research Institutes
- Diagnostic Centers and Clinical Laboratories
- Environmental Testing Laboratories Others
Drivers
PFAS and water contaminant monitoring expansion lifts LCMS demand
The PFAS compliance cycle is one of the clearest near term demand multipliers for analytical instrumentation because it converts environmental concern into mandated testing throughput.
The U.S. EPA finalized enforceable drinking water limits for six PFAS, including 4.0 ppt MCLs for PFOA and PFOS, while requiring public water systems to complete initial monitoring by 2027 and implement corrective action by 2029 if exceedances persist; EPA also formalized use of analytical methods such as Method 537.1 for initial monitoring, which directly favors LCMS workflows, sample prep consumables, standards, and ongoing service contracts.
Even with the 2026 proposal to reconsider part of the broader PFAS framework and potentially extend some deadlines, the testing burden does not disappear; it shifts toward a longer and more distributed monitoring cycle, sustaining instrument demand across municipal labs, contract labs, and industrial discharge testing rather than producing a single procurement spike.
Commercially, this driver improves utilization of existing high end mass spectrometry fleets while also pulling smaller labs into outsourced or benchtop upgrade paths, which is why its impact is strongest in North America first, with the EU and developed APAC following through contamination surveillance, wastewater screening, and industrial compliance programs.
| Driver | (~) % Impact on CAGR Forecast | Geographic Relevance | Impact Timeline |
|---|---|---|---|
| PFAS and water-contaminant monitoring expansion lifts LC-MS demand | +1.2% | North America core, EU, developed APAC spill-over | Short term |
| Pharma method-lifecycle regulation accelerates instrument refresh and software attach | +1.0% | North America, EU, Japan, South Korea, India export labs | Short term |
| Bioprocessing and CDMO scale-up increases high-value chromatography and characterization intensity | +1.4% | US core, Western Europe, India, Singapore, South Korea | Medium term |
| Semiconductor reshoring and advanced materials control deepen metrology needs | +0.8% | US core, Taiwan, South Korea, Japan, EU selective nodes | Medium term |
| Installed-base monetization through service, compliance, and lab software improves spend velocity | +0.9% | Global, strongest in North America and Europe | Short term |
| Applied testing in food, chemicals, and environmental labs widens mid-market instrument penetration | +0.7% | EU, China, India, Latin America selective, Middle East selective | Medium term |
Challenges
Electronics component volatility constraining instrument production stability
Electronics and precision component volatility continues to constrain analytical instrumentation production. Complex systems typically require 200–800 electronic and optoelectronic components, including 15–25 single- or dual-source parts such as microcontrollers, FPGAs, ADCs, and photonics modules. Although electronics market conditions have improved since late 2023, lead times for critical components can still range from 10–30 weeks.
As a result, OEMs often operate below optimal production capacity, while shipment delays and higher buffer inventories increase working capital requirements. These constraints are estimated to reduce potential annual market growth by around one percentage point, as revenue recognition is delayed and rising component costs cannot always be transferred to customers.
Over the next 2–4 years, component standardization and supplier diversification are expected to gradually reduce these supply chain challenges.
| Challenge | (~) % CAGR Friction Drag | Geographic Relevance | Mitigation Horizon |
|---|---|---|---|
| Electronics component volatility | -1.0% | North America, EU, East Asia | Medium term (2-4 years) |
| Skilled applications talent gap | -0.8% | North America, EU, India, China | Long term (≥ 4 years) |
| Integration & data interoperability | -0.7% | Global tier-1 labs, fabs | Medium term (2-4 years) |
| Regulatory validation bottlenecks | -0.6% | US, EU, Japan, China | Long term (≥ 4 years) |
| Capex cyclicality & budget creep | -0.5% | Global pharma, chemicals, semicon | Short term (≤ 2 years) |
| Installed-base service complexity | -0.5% | Global mature labs | Medium term (2-4 years) |
Restraints
Semiconductor and precision component constraints on instrumentation supply
Although the broad semiconductor shortage began to ease after 2023, specific analog, sensor, and AI accelerator components used in analytical instrumentation have remained structurally tight, with lead times for certain custom ASICs and precision ADCs still in the 26 to 40 week range, versus pre 2020 norms of 8 to 12 weeks.
This creates a persistent working capital drag: OEMs must commit to higher safety stock levels, often 1.5 to 2.0 times historical norms, tying up millions of dollars in inventory per mid sized vendor, while still facing episodic line stoppages when critical components are delayed.
For complex platforms like LC MS, where the electronics and detector assemblies can account for 20 to 30% of bill of materials cost, component price premiums of 5 to 10% over long term contracts and expedited logistics charges materially compress margins unless passed through to customers via 2 to 4% list price hikes, price moves that risk elongating sales cycles in cost sensitive lab segments.
In addition, OEMs contend with sporadic shortages in ancillary precision parts such as high accuracy encoders, vacuum pumps, and optics modules, each adding 3 to 6 weeks to final system delivery when delayed, extending overall order to installation cycles from typical 12 to 16 weeks to 20 to 24 weeks in constrained quarters; this not only defers revenue recognition but also increases cancellation risk, pushing down realized growth by nearly one percentage point relative to underlying demand.
| Restraint | (~) % Impact on CAGR Forecast | Geographic Relevance | Impact Timeline |
|---|---|---|---|
| Post-pandemic CapEx rationing in labs | -1.2% | North America core, EU, Japan | Short to Medium term |
| Semiconductor and precision component constraints | -0.9% | North America, EU, APAC corridors | Short term |
| Regulatory tightening and qualification delays | -0.7% | EU, US FDA-linked markets | Medium to Long term |
| High total cost of ownership (TCO) | -1.0% | Global Tier-2/3 labs, emerging markets | Medium term |
| Talent shortages in advanced labs | -0.6% | North America, EU, select APAC | Medium to Long term |
| Emerging-market infra and funding gaps | -0.8% | APAC ex-core, LATAM, MEA | Long term |
Opportunity
Instrument-as-a-Service recurring revenue monetization shift
A significant growth opportunity in the analytical instrumentation market lies in expanding from traditional one-time instrument sales to bundled instrument-as-a-service (IaaS) models that integrate hardware, preventive maintenance, uptime guarantees, compliance software, data analytics, and consumables into long-term contracts.
This approach represents a strategic shift in revenue generation by increasing recurring income, improving customer retention, and reducing procurement complexity rather than relying solely on new instrument sales. The growing importance of service-based business models is reflected in leading industry participants.
Agilent’s CrossLab business generated approximately $ 755 million in quarterly revenue during fiscal Q4 2025, highlighting the strong contribution of service offerings, while Thermo Fisher Scientific’s quarterly revenue exceeded $10 billion, demonstrating the potential to expand recurring services across a large installed instrument base.
If vendors convert 15–20% of medium- and high-utilization systems into multi-year service agreements priced at 8–12% of instrument value annually, lifetime revenue per instrument could increase by 20–35%. Additionally, stronger service revenue, improved customer loyalty, and more stable margins could contribute approximately 1.6 percentage points to overall market CAGR through enhanced recurring monetization.
| Opportunity | (~) % Potential CAGR Upside | Geographic Relevance | Execution Window |
|---|---|---|---|
| Instrument-as-a-Service | +1.6% | North America core, EU, Japan | Short term |
| Mid-tier APAC localization | +2.1% | India, ASEAN, China inland | Medium term |
| Bioprocess QA workflows | +1.8% | US, EU, Singapore, South Korea | Medium term |
| Decentralized diagnostics labs | +1.4% | APAC emerging, MEA, LatAm | Short term |
| Semiconductor metrology pivot | +1.9% | Taiwan, South Korea, US, India | Medium term |
| Roll-up of software/service assets | +1.3% | North America, EU | Long term |
Regional Analysis
In 2025, North America led the market, achieving over 38.5% share with a revenue of US$ 20.23 Billion.
North America region’s leadership is supported by substantial investments in pharmaceutical research, biotechnology innovation, clinical diagnostics, environmental monitoring, and food safety testing.
The United States represents the largest contributor, driven by the presence of leading analytical instrument manufacturers, advanced laboratory infrastructure, and strong funding for life sciences and precision medicine research.
Increasing adoption of automation, artificial intelligence-enabled laboratory workflows, and stringent quality assurance standards across regulated industries continue to accelerate demand for advanced analytical technologies.
Moreover, government support for biomedical research, coupled with expanding applications in genomics, proteomics, and forensic science, strengthens regional market growth. Canada also contributes steadily through investments in academic research, environmental analysis, and healthcare modernization.
The region benefits from widespread implementation of high-end chromatography, spectroscopy, mass spectrometry, and molecular analysis systems across pharmaceutical companies, contract research organizations, hospitals, and academic institutions. Growing emphasis on regulatory compliance, product quality validation, and laboratory digitalization further supports instrument upgrades and replacement demand.
Additionally, increasing investments in semiconductor testing, materials science, and industrial quality control broaden the application scope of analytical instrumentation beyond healthcare. With continuous technological advancements, strong research funding, and early adoption of next-generation laboratory solutions, North America is expected to maintain its leading position throughout the forecast period while serving as a global hub for analytical innovation.
Key Regions and Countries
North America
- The US
- Canada
Europe
- Germany
- France
- The U.K.
- Italy
- Spain
- Russia & CIS
- Rest of Europe
Asia Pacific
- China
- India
- Japan
- South Korea
- ASEAN
- Australia & New Zealand
- Rest of Asia Pacific
Middle East & Africa
- GCC
- South Africa
- Rest of Middle East & Africa
Latin America
- Brazil
- Mexico
- Rest of Latin America
Key Player Analysis
The analytical instrumentation market is moderately consolidated, with a mix of global technology leaders and specialized instrumentation providers competing across life sciences, pharmaceuticals, environmental testing, food safety, clinical diagnostics, and industrial quality control.
The market has reached a mature stage in developed economies, while sustained investment in laboratory automation, digital analytics, high-throughput testing, and precision measurement continues to drive innovation. Competition increasingly centers on integrated analytical platforms, software-enabled workflows, artificial intelligence-assisted data interpretation, and compliance with stringent regulatory and quality standards.
The competitive landscape can be categorized into three strategic tiers. Large multinational instrumentation companies, including Thermo Fisher Scientific Inc., Agilent Technologies, Inc., Danaher Corporation, Shimadzu Corporation, Waters Corporation, Bruker Corporation, PerkinElmer Inc., and Mettler-Toledo International, Inc., provide broad analytical portfolios supported by global service networks and continuous technology investment.
Specialized scientific instrumentation providers such as Bio-Rad Laboratories, Inc., Hitachi High-Tech Corporation, HORIBA, Ltd., JEOL Ltd., Carl Zeiss AG, Metrohm AG, Eppendorf AG, and Malvern Panalytical Ltd. focus on high-performance solutions for microscopy, spectroscopy, chromatography, particle characterization, and laboratory workflows.
Meanwhile, Merck KGaA, Sartorius AG, Roche Diagnostics, and Illumina, Inc. strengthen the ecosystem through bioprocessing technologies, molecular diagnostics, genomics, and integrated laboratory solutions. Competitive differentiation is driven by sustained R&D investment, strategic collaborations with academic and pharmaceutical organizations, expansion of software-enabled laboratory ecosystems, and continuous product innovation.
Companies increasingly compete by integrating automation, cloud connectivity, advanced analytics, and workflow optimization to improve laboratory productivity, data integrity, and end-to-end analytical performance across research, clinical, and industrial applications.
Top Key Players
- Thermo Fisher Scientific Inc.
- Agilent Technologies, Inc.
- Danaher Corporation
- Shimadzu Corporation
- Waters Corporation
- Bruker Corporation
- PerkinElmer Inc.
- Mettler-Toledo International, Inc.
- Bio-Rad Laboratories, Inc.
- Hitachi High-Tech Corporation
- HORIBA, Ltd.
- JEOL Ltd.
- Carl Zeiss AG
- Merck KGaA
- Sartorius AG
- Metrohm AG
- Eppendorf AG
- Malvern Panalytical Ltd.
- Roche Diagnostics
- Illumina, Inc.
Recent Developments
- In January 2025, Danaher Corporation announced the acquisition of AI-based genomics software company GeneData, strengthening its life sciences and analytical informatics portfolio.
- In January 2025, Shimadzu Corporation launched the Brevis GC-2050 gas chromatograph, designed to improve laboratory productivity through compact design and faster analytical workflows.
- In March 2025, Waters Corporation introduced the Alliance is Bio HPLC System, developed to improve biologics quality control with enhanced compliance and analytical efficiency.
- In April 2026, Thermo Fisher Scientific Inc. launched the Orbitrap Astral Zoom Mass Spectrometer, expanding its high-throughput proteomics portfolio with enhanced sensitivity and faster analytical performance for life science research.
Report Scope
| Report Features | Description |
|---|---|
| Market Value (2025) | US$ 52.5 Billion |
| Forecast Revenue (2035) | US$ 92.1 Billion |
| CAGR (2026-2035) | 5.8 % |
| Base Year for Estimation | 2025 |
| Historic Period | 2020-2024 |
| Forecast Period | 2026-2035 |
| Report Coverage | Revenue Forecast, Market Dynamics, Competitive Landscape, Recent Developments |
| Segments Covered | By Offering (Instruments, Services, Software) By Product Type (Chromatography Systems, Spectroscopy Instruments, Mass Spectrometry Systems, Microscopy Instruments, Molecular Analysis Instruments, Others) By Application (Life Sciences Research and Development, Clinical and Diagnostic Analysis, Environmental Testing, Food and Beverage Analysis, Pharmaceutical Quality Control, Others) By End Use (Pharmaceutical and Biotechnology Companies, Academic and Research Institutes, Diagnostic Centers and Clinical Laboratories, Environmental Testing Laboratories) |
| Regional Analysis | North America – The US, Canada; Europe – Germany, France, U.K., Italy, Spain, Russia & CIS, Rest of Europe; Asia Pacific – China, India, Japan, South Korea, ASEAN, Australia & New Zealand, Rest of Asia Pacific; Middle East & Africa – GCC, South Africa, Rest of Middle East & Africa; Latin America – Brazil, Mexico, Rest of Latin America |
| Competitive Landscape | Thermo Fisher Scientific Inc. ,Agilent Technologies, Inc. ,Danaher Corporation ,Shimadzu Corporation ,Waters Corporation, Bruker Corporation ,PerkinElmer Inc. ,Mettler-Toledo International, Inc. ,Bio-Rad Laboratories, Inc. ,Hitachi High-Tech Corporation ,HORIBA, Ltd. ,JEOL Ltd. ,Carl Zeiss AG ,Merck KGaA ,Sartorius AG , Metrohm AG ,Eppendorf AG ,Malvern Panalytical Ltd. ,Roche Diagnostics ,Illumina, Inc. |
| Customization Scope | Customization for segments, region/country-level will be provided. Moreover, additional customization can be done based on the requirements. |
| Purchase Options | We have three licenses to opt for: Single User License, Multi-User License (Up to 5 Users), Corporate Use License (Unlimited User and Printable PDF) |





































