


Report Overview
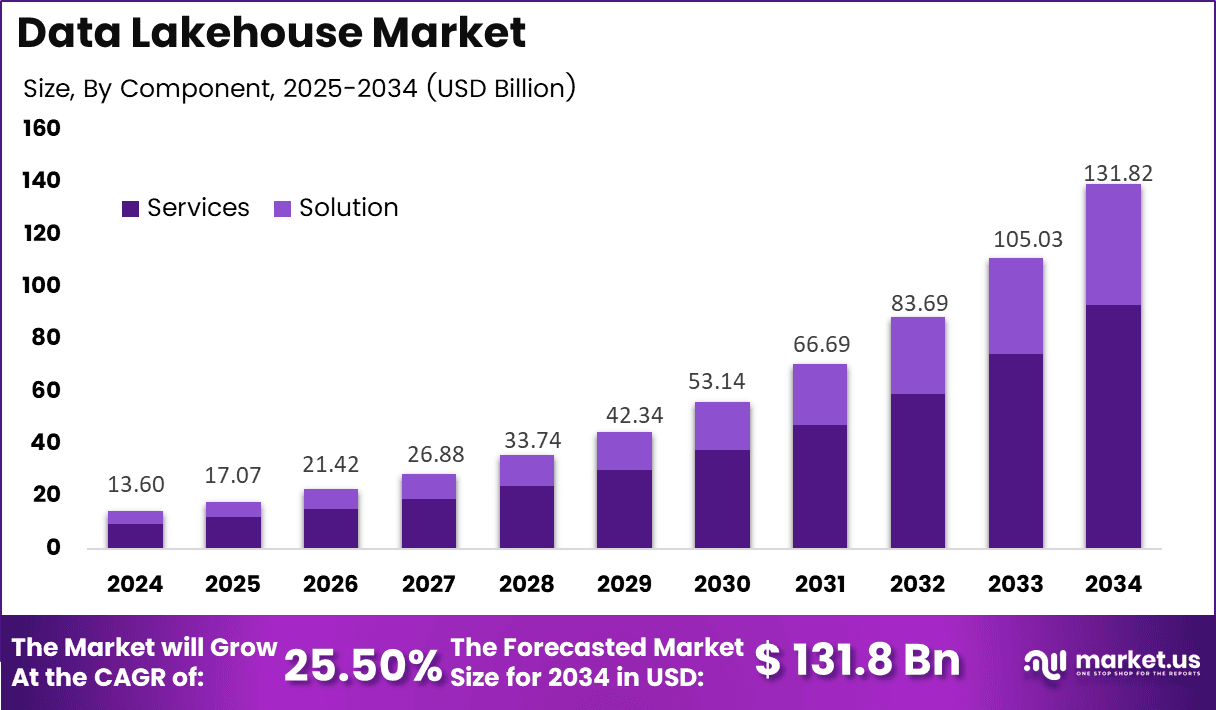
In 2024, the Global Data Lakehouse Market was valued at USD 13.6 billion. The market is projected to grow at a CAGR of 25.5% during 2025–2034, reaching approximately USD 131.8 billion by 2034. North America dominated the global market in 2024, accounting for more than 35.3% of the total market share and generating approximately USD 4.8 billion in revenue.
According to the U.S. Bureau of Economic Analysis, the U.S. digital economy generated nearly USD 2.6 trillion in value added in 2022. Earlier BEA data showed digital-economy gross output of around USD 3.7 trillion and employment of approximately 8.0 million jobs in 2021. The increasing volume of customer, machine, transaction, and AI-generated data is strengthening demand for scalable data management platforms.
Data lakehouses combine low-cost data-lake storage with warehouse-level analytics, governance, SQL performance, and AI model-training capabilities. This architecture allows enterprises to manage structured and unstructured data within a unified environment, reducing data duplication while supporting analytics, business intelligence, and machine-learning workloads.
Infrastructure investment is also increasing, with the European Commission committing €2 billion toward data-processing infrastructure, data-sharing tools, cloud federation, and related services, supporting demand for platforms from Databricks, Snowflake, AWS, Microsoft, Google Cloud, and IBM.
Key Takeaways
- The Data Lakehouse Market was valued at USD 13.6 billion in 2024 and is projected to reach USD 131.8 billion by 2034, growing at a 25.5% CAGR during 2025–2034.
- By component, the Solution segment dominated with a 70.7% market share in 2025.
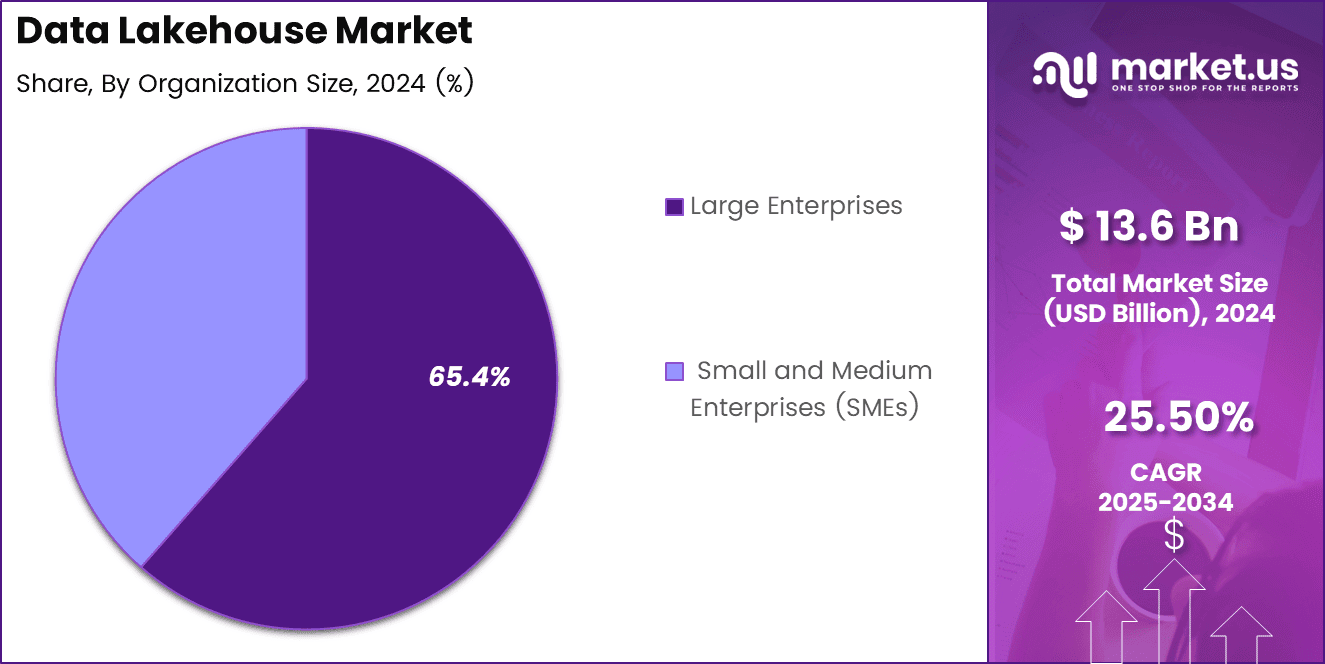
- By organization size, Large Enterprises held the leading position with a 65.4% share.
- By application, Operations accounted for a significant 30.4% share, supported by demand for process efficiency and cost optimization.
- By deployment, On-premises solutions led with a 58.5% share due to stronger control, security, and customization.
- By end use, BFSI dominated with a 28.8% share, driven by the need for secure and efficient financial data management.
- North America led the market in 2024 with more than 35.3% share, generating approximately USD 4.8 billion in revenue.
By Component
The component reveals that the Solution category commands a substantial 70.7% of the market share in 2025. This category encompasses critical segments such as Data Storage & Management, projected to hold approximately 35% of the Solution segment due to increasing demand for scalable cloud-based storage.
Data Integration & ETL is expected to account for around 25% as businesses prioritize seamless data pipelines, and Data Governance is anticipated to contribute about 20% with growing regulatory compliance needs. Others, covering niche solutions, make up the remaining 20%.
The Services category, comprising Professional Services and Managed Services, holds the remaining 29.3% of the market, with Professional Services likely representing 60% of this segment due to high demand for consulting and implementation, and Managed Services covering the rest as outsourcing gains traction.
By Organization Size
In the Data Lakehouse Market by organization size, Large Enterprises dominate with a 65.4% share, projected to maintain 66% due to investments in advanced data infrastructure. SMEs hold 34.6%, expected to remain at 34%, driven by accessible, cost-effective cloud solutions.
The Solution category holds a 70.7% market share, led by Data Storage & Management projected at 35% due to demand for scalable cloud storage, Data Integration & ETL at 25% for seamless data pipelines, Data Governance at 20% amid rising compliance needs, and Others at 20% for niche solutions. The Services category, with 29.3%, splits into Professional Services, 60% for consulting, and Managed Services for outsourcing.
By Application
In the Data Lakehouse Market by applications, Operations holds a significant share of 30.4%. This dominance reflects the critical role of operations software in streamlining processes, enhancing efficiency, and reducing costs across industries.
Finance applications follow, capturing 25.6%, driven by demand for robust financial management tools. Marketing accounts for 20.8%, fueled by data-driven campaign needs.
HR represents 15.2%, supporting talent management and compliance. Other applications, including niche sectors, contribute 8%. Predictive trends suggest Operations will maintain its lead, potentially growing to 32% by 2027, with Finance and Marketing gaining marginally.
By Deployment
In the Data Lakehouse Market by Deployment, On-premises solutions command a substantial share of 58.5%. This prominence underscores the preference for on-premises deployments due to their control, security, and customization capabilities.
Cloud deployments follow, holding 41.5%, driven by scalability, flexibility, and cost-efficiency. Predictive trends indicate that On-premises will slightly decline to 56% by 2027 as Cloud adoption grows to 44%, fueled by increasing trust in cloud security and the shift toward remote work and digital transformation across industries.
By End Use
In the Data Lakehouse Market by End Use, BFSI (Banking, Financial Services, and Insurance) leads at 28.8%, driven by demand for secure, efficient financial management solutions. IT & Telecom follows at 22.3%, propelled by expanding digital infrastructure and connectivity needs.
Healthcare holds 18.5%, supported by widespread digitization, patient data management, and telehealth adoption. Energy & Utilities accounts for 12.7%, driven by smart grid and sustainability initiatives. Retail & E-commerce represents 10.4%, fueled by online platforms and customer analytics.
Manufacturing holds 5.3%, while other niche sectors contribute 2%. Predictive trends suggest BFSI will grow to 30% by 2027, with Healthcare and IT & Telecom gaining marginally due to ongoing global digital transformation and technological advancements.
Key Market Segment
By Component
- Solution
- Data Storage & Management
- Data Integration & ETL
- Data Governance
- Others
- Services
- Professional Services
- Managed Services
By Organization Size
- SMEs
- Large Enterprises
By Application
- Operations
- Finance
- Marketing
- HR
- Others
By Deployment
- On-premises
- Cloud
By End Use
- BFSI
- IT & Telecom
- Healthcare
- Energy & Utilities
- Retail & E-commerce
- Manufacturing
- Others
Regional Analysis
North America commands approximately 35.3% of the global data lakehouse market share in 2024, as depicted in the graph, with a USD 4.8 billion valuation, driven by early adoption of big data technologies, robust cloud infrastructure from providers like AWS and Azure, and a thriving ecosystem of tech innovators in hubs like Silicon Valley.
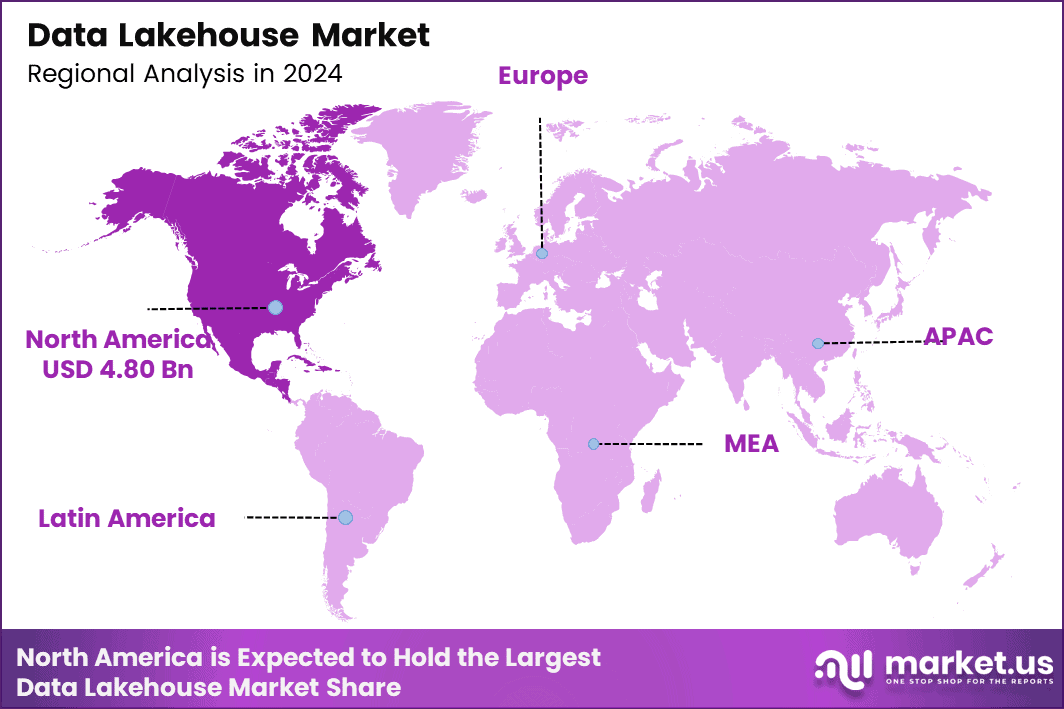
Europe follows with a projected 25% CAGR through 2033, fueled by regulatory compliance and Industry 4.0 initiatives.APAC exhibits the fastest growth at 23-25% CAGR, propelled by digitalization in China and MEA, and Latin America lags with smaller shares, but is poised for 20%+ growth via emerging cloud adoption and infrastructure. Overall, the market is forecasted to expand at 22-23% global CAGR to USD 112 billion by 2035, with North America’s lead persisting amid hybrid.
US Market Size
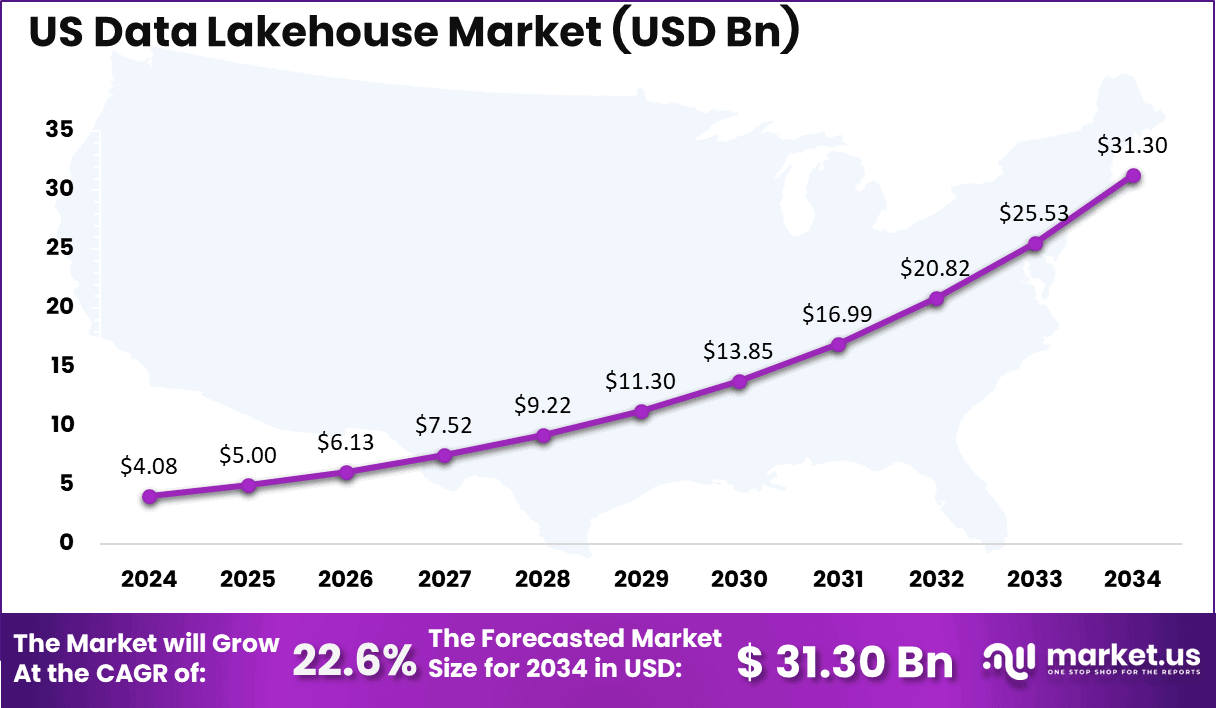
The US Data Lakehouse Market, starting at USD 4.08 billion in 2024, is projected to expand steadily, reaching USD 5.00 billion in 2025 amid rising adoption of unified data architectures for analytics and AI. This growth reflects the broader trend of organizations integrating data lakes with warehouses to handle vast structured and unstructured data volumes efficiently.
By 2034, the Data Lakehouse Market is forecasted to hit USD 31.3 billion, driven by a robust 22.6% CAGR, fueled by cloud innovations, real-time processing demands, and sectors like finance and healthcare seeking scalable solutions for enhanced decision-making.
Key Regions and Countries
- North America
- US
- Canada
- Europe
- Germany
- France
- The UK
- Spain
- Italy
- Rest of Europe
- Asia Pacific
- China
- Japan
- South Korea
- India
- Australia
- Rest of APAC
- Latin America
- Brazil
- Mexico
- Rest of Latin America
- Middle East & Africa
- GCC
- South Africa
- Rest of MEA
Market Dynamics
Drivers
| Driver | (~) % Impact on CAGR Forecast | Geographic Relevance | Impact Timeline |
|---|---|---|---|
| Enterprise AI data unification | +4.0% | Global | Short term (2 years or less) |
| Cloud data-stack modernization | +3.2% | North America and Europe | Short term (2 years or less) |
| Open table-format adoption | +2.1% | Global | Medium term (2 to 4 years) |
| Real-time operational analytics | +1.8% | Asia-Pacific and North America | Medium term (2 to 4 years) |
| Governed self-service analytics | +1.4% | Europe and North America | Medium term (2 to 4 years) |
Enterprise AI data unification
Enterprise AI adoption is shifting data-platform spending from separate engineering, warehousing, and machine-learning tools toward unified lakehouse platforms. Global data-centre electricity demand increased by 17% in 2025, while AI-focused data-centre electricity use rose by 50%, indicating stronger growth in data preparation, retrieval, model training, and inference workloads.
The U.S. Bureau of Labor Statistics expects data-scientist employment to grow by 34% between 2024 and 2034, with around 23,400 openings annually. The digital economy also represented 10.3% of U.S. GDP in 2021, supporting continued migration toward cloud-native data architectures. This shift is expected to add around +4.0% incremental growth to the baseline CAGR of 25.5%.
Restraints
| Restraint | (~) % Impact on CAGR Forecast | Geographic Relevance | Impact Timeline |
|---|---|---|---|
| Cloud-cost approval limits | -2.7% | Global | Short term (2 years or less) |
| Data-sovereignty procurement barriers | -2.2% | Europe, Middle East and Asia-Pacific | Short term (2 years or less) |
| Legacy contract lock-ins | -1.5% | North America and Europe | Medium term (2 to 4 years) |
| Public-sector budget constraints | -1.2% | Global | Medium term (2 to 4 years) |
| Compliance certification delays | -1.0% | Regulated global markets | Short term (2 years or less) |
Cloud-cost approval limits
Unpredictable compute and data-transfer costs can delay lakehouse migration, especially when expected savings are not clearly measured. The International Energy Agency projects data-centre electricity demand to increase from about 485 TWh in 2025 to nearly 950 TWh by 2030, increasing infrastructure and power costs that may be reflected in cloud pricing.
U.S. construction spending reached about $2.24 trillion in 2025, while the European Commission’s Data Act became applicable on 12 September 2025, adding portability, switching, and contractual requirements. These factors can lengthen procurement cycles, increase implementation costs, and pressure platform margins, resulting in an estimated -2.7% impact on the baseline growth path.
Challenges
| Challenge | (~) % CAGR Friction Drag | Geographic Relevance | Mitigation Horizon |
|---|---|---|---|
| Data quality and lineage | -2.4% | Global | Medium term (2 to 4 years) |
| Specialist talent shortages | -1.9% | Global | Medium term (2 to 4 years) |
| Multi-cloud performance management | -1.7% | Global | Medium term (2 to 4 years) |
| Security policy fragmentation | -1.5% | Regulated global markets | Long term (4 years or more) |
| Storage-compute optimization | -1.3% | Global | Short term (2 years or less) |
Data quality and lineage
Data quality and lineage remain major operational bottlenecks because lakehouse platforms can centralize data without automatically resolving inconsistent definitions, permissions, metadata, and model inputs. The U.S. Bureau of Labor Statistics projects data-scientist employment to grow by 34% from 2024 to 2034, with about 23,400 openings annually, increasing competition for skilled data engineering and governance professionals.
The European Commission’s Data Act applies from 12 September 2025, strengthening requirements around data access, ownership, and reuse. AI-focused data-centre electricity demand also increased by 50% in 2025, raising the cost of processing poor-quality or duplicate data. As a result, enterprises must invest more in cataloging, testing, policy automation, and observability, creating an estimated -2.4% drag on the maximum attainable CAGR.
Opportunities
| Opportunity | (~) % Potential CAGR Upside | Geographic Relevance | Execution Window |
|---|---|---|---|
| Industrial edge-data monetization | +3.0% | Asia-Pacific, Europe and North America | Medium term (2 to 4 years) |
| Vertical AI data products | +2.4% | Global | Medium term (2 to 4 years) |
| Data clean-room services | +1.9% | North America and Europe | Short term (2 years or less) |
| Public-sector data exchanges | +1.6% | Europe, Middle East and Asia-Pacific | Long term (4 years or more) |
| Managed governance subscriptions | +1.3% | Global | Medium term (2 to 4 years) |
Industrial edge-data monetization
Industrial edge-data monetization remains a future growth opportunity because much machine, logistics, energy, and field-service data is still stored locally or used only for monitoring. Global data-centre electricity use is projected to rise from about 485 TWh in 2025 to nearly 950 TWh by 2030, increasing the value of edge filtering and lakehouse-based aggregation to reduce unnecessary centralized processing.
The European Commission’s Data Act, applicable from 12 September 2025, expands access to connected-product data, supporting new recurring data services. The U.S. digital economy generated $2.41 trillion in value added in 2021, equal to 10.3% of GDP. Edge processing, open formats, and governed sharing could reduce transfer and storage volumes by around 15% to 30% per workload and support up to +3.0% additional CAGR upside.
Key Players Analysis
The data lakehouse market is led by hyperscalers and major platform specialists. AWS, Microsoft, and Google together are estimated to account for around 55–65% of lakehouse infrastructure and managed analytics spending. AWS reported $128.7 billion in 2025 AWS sales, up 20%, while Microsoft generated $106.3 billion in FY2025 Intelligent Cloud revenue, including more than $75 billion from Azure.
Google Cloud remains the fastest-growing hyperscale challenger, with 2025 revenue increasing by $15.5 billion, or 36%. Alphabet invested $61.1 billion in R&D, equal to 15% of revenue. Combined, hyperscalers and platform leaders are estimated to represent around 70–80% of addressable lakehouse revenue, supported by continued investment in AI, cloud infrastructure, analytics, and open data formats.
Databricks and Snowflake lead the independent lakehouse and data-cloud software segment, with an estimated combined share of 15–20%. Databricks exceeded a $4.0 billion revenue run rate in 2025, including more than $1 billion each from AI and data warehousing, and raised $1 billion at a valuation above $100 billion. Snowflake reported $4.684 billion in FY2026 revenue, up 29%, while investing $1.969 billion, or 42% of revenue, in R&D.
Tier 2 vendors are estimated to account for another 10–15% of addressable revenue. IBM generated $67.5 billion in 2025 revenue with 11% software growth, while Teradata reported $1.663 billion in revenue, $701 million in public-cloud ARR, and $280 million in R&D spending. Cloudera’s last disclosed ARR was $805 million before its $5.3 billion acquisition, while Dremio raised $160 million at a $2 billion pre-money valuation, reinforcing competition in hybrid, federated, and open lakehouse architectures.
Top Key Players
- Databricks
- Snowflake Inc.
- Microsoft
- Amazon Web Services, Inc.
- Google LLC
- IBM Corporation
- Cloudera, Inc.
- Teradata
- Dremio
- Starburst Data, Inc.
- Others
Recent Development
- In February 2026, Snowflake and OpenAI executed a multi-year $200 million co-innovation and joint go-to-market agreement to embed advanced OpenAI model capabilities and AI agents across Snowflake’s enterprise data platform, materially expanding the commercial AI layer attached to governed data-cloud and lakehouse workloads.
- In February 2025, IBM agreed to acquire DataStax, adding AstraDB and DataStax Enterprise’s Apache Cassandra-based NoSQL and vector-database capabilities to IBM’s hybrid open data-lakehouse offering; IBM stated that the deal was expected to close in Q2 2025, although it did not disclose the transaction value.
- In September 2025, Databricks reported a revenue run rate above $4.0 billion, growing more than 50% year over year, and closed a $1.0 billion Series K financing at a valuation above $100 billion. Its AI and data-warehousing businesses each exceeded $1.0 billion in annualized revenue, evidencing large-scale commercialization of the lakehouse model.
Report Scope
| Report Features | Description |
|---|---|
| Market Value (2024) | USD 13.6 Million |
| Forecast Revenue (2034) | USD 131.8 Million |
| CAGR(2025-2034) | 25.5% |
| Base Year for Estimation | 2024 |
| Historic Period | 2020-2023 |
| Forecast Period | 2025-2034 |
| Report Coverage | Revenue forecast, AI impact on Market trends, Share Insights, Company ranking, competitive landscape, Recent Developments, Market Dynamics, nd Emerging Trends |
| Segments Covered | By Component (Solution, [Data Storage & Management, Data Integration & ETL, Data Governance, Others], Services, Professional Services, Managed Services), By Organization Size (SMEs, Large Enterprises), By Application (Operations, Finance, Marketing, HR, Others), By Deployment (On-premises, Cloud), By End Use (BFSI, IT & Telecom, Healthcare, Energy & Utilities, Retail & E-commerce, Manufacturing, Others) |
| Regional Analysis | North America – US, Canada; Europe – Germany, France, The UK, Spain, Italy, Russia, Netherlands, Rest of Europe; Asia Pacific – China, Japan, South Korea, India, New Zealand, Singapore, Thailand, Vietnam, Rest of Latin America; Latin America – Brazil, Mexico, Rest of Latin America; Middle East & Africa – South Africa, Saudi Arabia, UAE, Rest of MEA |
| Competitive Landscape | Databricks, Snowflake Inc., Microsoft, Amazon Web Services, Inc., Google LLC, IBM Corporation, Cloudera, Inc., Teradata, Dremio, Starburst Data, Inc., and Others. |
| Customization Scope | Customization for segments, region/country-level will be provided. Moreover, additional customization can be done based on the requirements. |
| Purchase Options | We have three licenses to choose from: Single User License, Multi-User License (Up to 5 Users), Corporate Use License (Unlimited Users, Printable PDF) |





























