


Report Overview
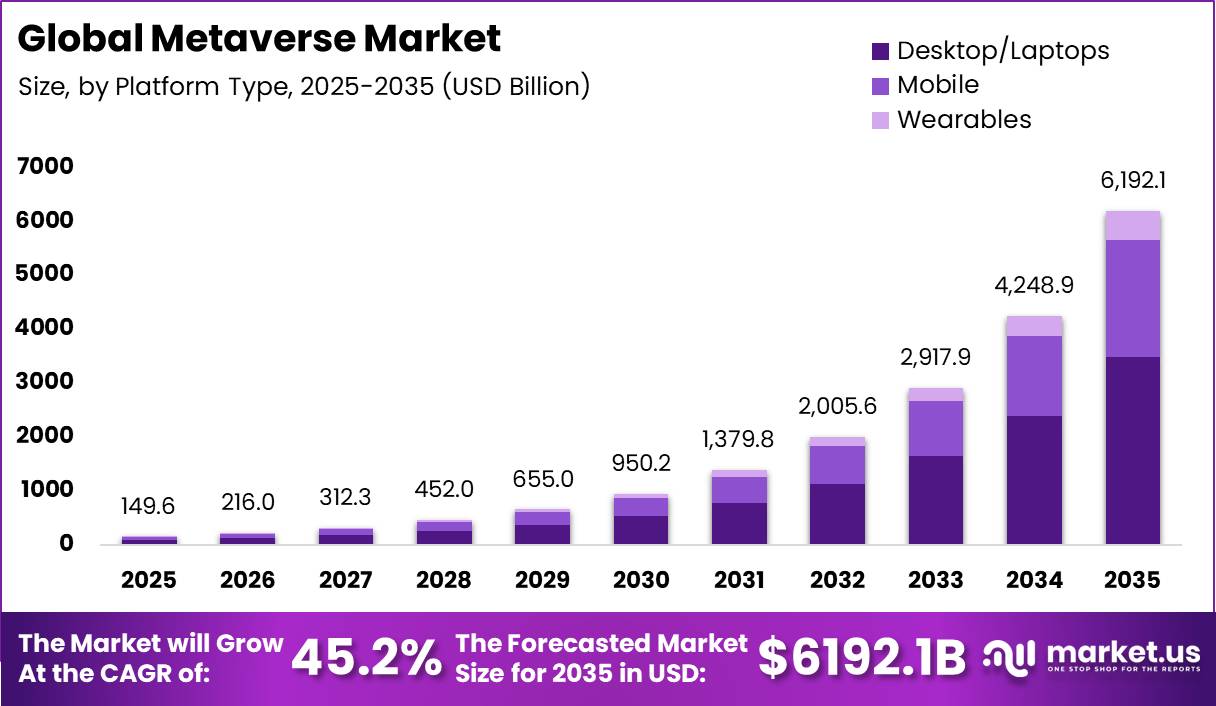
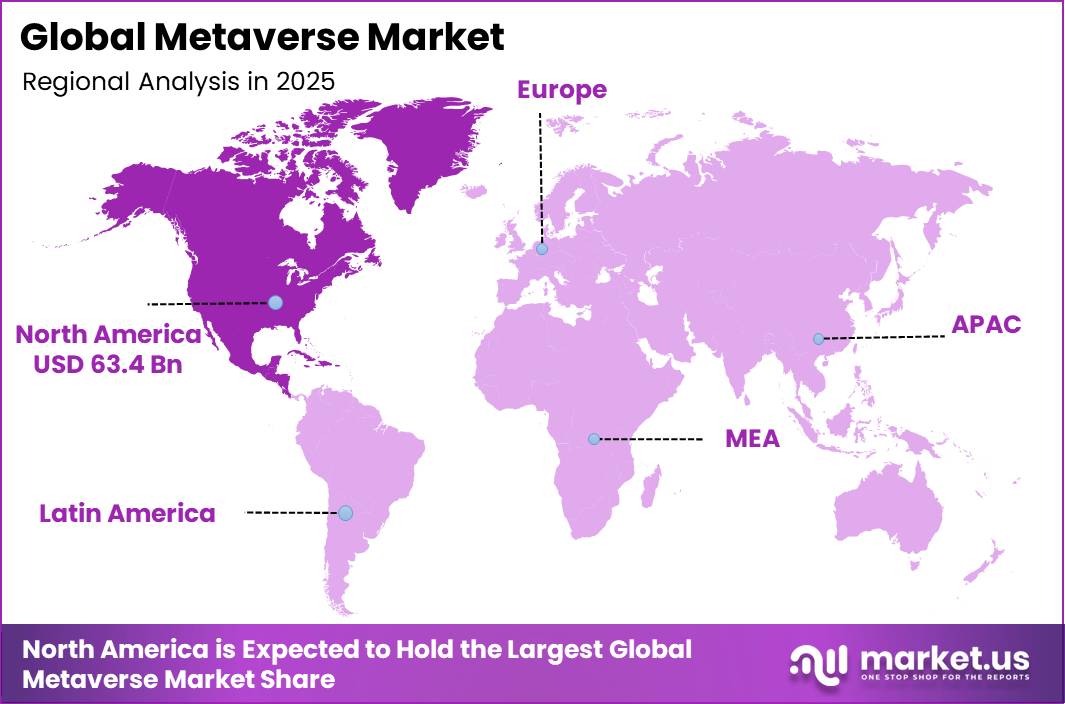
In 2025, the Metaverse Market was valued at USD 149.6 billion. The market is projected to grow at a CAGR of 45.2% during 2026–2035, reaching approximately USD 6,192.1 billion by 2035. North America dominated the global market in 2025, accounting for more than 42.4% of the total market share and generating approximately USD 63.4 billion in revenue.
The growth of the market is being supported by wider internet access and faster mobile networks. According to ITU, nearly 6 billion people, or around 74% of the global population, were using the internet in 2025, compared with 60% in 2020. In addition, Ericsson reported that 5G subscriptions reached 3.1 billion by Q1 2026, with North America recording 79% 5G penetration. This is important because metaverse applications such as virtual meetings, digital twins, immersive training, and real-time collaboration require high-speed and low-latency connectivity.
Enterprise digital transformation is also strengthening market demand. Public cloud spending increased from USD 595.7 billion in 2024 to USD 723.4 billion in 2025, showing strong investment in scalable digital infrastructure. AR/VR headset shipments are expected to grow rapidly through 2029, increasing access to metaverse platforms. As businesses continue adopting virtual tools for training, design, commerce, and collaboration, demand for metaverse solutions is expected to expand strongly across major industries.
Key Takeaway
- The Metaverse Market was valued at USD 149.6 billion in 2025.
- The market is projected to reach USD 6,192.1 billion by 2035, growing at a 45.2% CAGR during 2026–2035.
- The hardware segment led the market with 38.7% share, supported by strong demand for immersive devices, sensors, displays, chips, and headsets.
- Desktop/Laptops remained the leading platform type, capturing 56.4% share due to wide accessibility and high computing power.
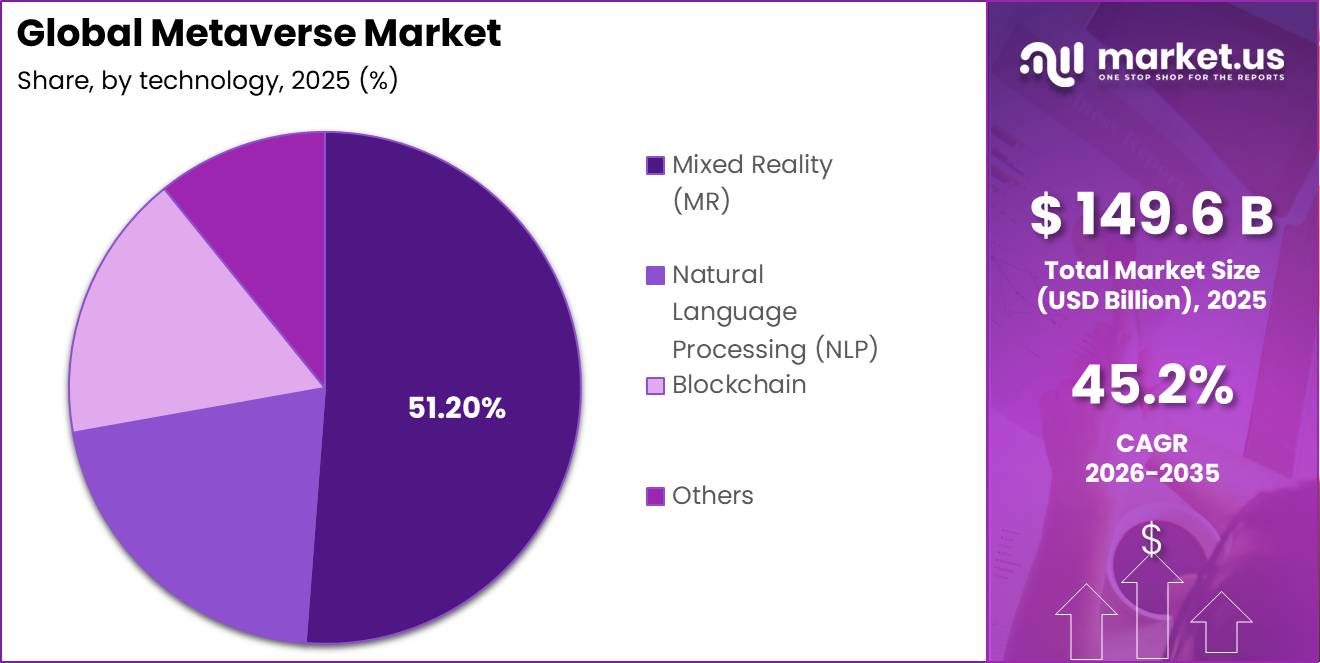
- Mixed Reality (MR) dominated the technology segment with 51.2% share, driven by rising use of blended physical and digital environments.
- Media & Entertainment led the end-use industry segment with 26.5% share, supported by gaming, virtual events, digital content, and immersive experiences.
- North America dominated the market with a 42.4% share, generating nearly USD 63.4 billion in revenue in 2025.
By Product
Hardware dominates with 38.7% due to its essential physical access gateway role.
The Hardware segment holds a leading position in the metaverse market because immersive digital experiences depend on physical devices and advanced computing components. Metaverse platforms cannot operate at scale without processors, memory chips, sensors, displays, optics, headsets, haptic devices, and edge computing systems. These components form the main access layer through which users enter virtual environments.
The dominance of hardware is strongly supported by rising semiconductor demand. According to the Semiconductor Industry Association, global semiconductor sales reached USD 791.7 billion in 2025, increasing by 25.6% from USD 630.5 billion in 2024. This growth was driven by strong demand for AI-based logic chips and high-bandwidth memory, both of which are important for real-time spatial rendering and high-performance XR devices.
Device adoption is also strengthening this segment. IDC reported that global smart glasses shipments increased by 167% year-on-year in Q1 2026, reaching nearly 2.25 million units. IDC also expects XR shipments to rise from about 13.6 million units in 2026 to 27.3 million units by 2030. This shows that enterprises and consumers are increasingly adopting hardware needed for virtual collaboration, digital twin simulation, training, gaming, and immersive commerce.
By Platform Type
Desktop/Laptops dominate with 56.4% due to superior processing power and display fidelity.
The Desktop/Laptops segment is growing rapidly in the metaverse market, mainly due to the strong expansion of global mobile connectivity and smartphone access. Mobile devices are becoming one of the most important entry points for metaverse applications because they are widely available, affordable, and easier to use compared with high-end PCs or dedicated XR systems.
This growth is supported by a large connected user base. According to GSMA’s Mobile Economy 2026 report, the world has around 5.8 billion unique mobile subscribers, representing nearly 70% of the global population. GSMA tracker data for Q3 2026 further shows that unique mobile subscribers reached about 5.87 billion. In addition, ITU reported that 5G networks covered 55% of the global population in 2025.
Mobile platforms are also helping expand metaverse access in emerging markets, where smartphone adoption is high but PC ownership remains limited. GSMA notes that 96% of the global population now lives within reach of a mobile broadband network. This gives mobile platforms a strong advantage in reaching users across different income groups and regions.
By Technology
Mixed Reality (MR) dominates with 51.2% due to seamless physical-digital environment blending.
Mixed Reality holds a strong position in the metaverse technology market because it connects digital content with the real physical world. Unlike Virtual Reality, which creates a fully virtual space, or basic Augmented Reality, which only places simple digital elements on a screen, Mixed Reality allows virtual objects to be fixed to real-world locations.
The segment’s growth is supported by rising demand from large industrial sectors. According to UNIDO’s International Yearbook of Industrial Statistics 2025, global Manufacturing Value Added grew by 2.9% in 2024, representing an industrial base of around USD 16.8 trillion. This large manufacturing ecosystem is increasingly adopting spatial tools for assembly support, equipment maintenance, quality checks, and worker training.
Device adoption is also strengthening the segment. IDC reported that MR headset shipments are expected to reach 7.7 million units in 2025, growing by 21.7% year-on-year. By 2030, MR device revenue is projected to reach USD 7.1 billion, up from USD 2.4 billion in 2026. As MR devices use advanced sensors, depth mapping, LiDAR, and real-time rendering, they provide high-value enterprise use cases, supporting the segment’s leading role in the metaverse technology landscape.
By End Use Industry
Media and Entertainment dominates with 26.5% due to immersive content demand and a massive user base.
The Media and Entertainment segment holds a leading position in metaverse adoption because the industry is closely linked to immersive and engaging digital experiences. Metaverse platforms support exactly what this sector needs, including virtual events, interactive content, digital concerts, gaming worlds, avatar-based engagement, and new forms of audience participation.
This leadership is supported by the large size and continued growth of the global media and entertainment industry. According to PwC’s Global Entertainment & Media Outlook 2026 to 2030, the industry reached USD 3.5 trillion in revenue in 2025, growing by 5.3% year-on-year. It is expected to reach USD 4.2 trillion by 2030. This strong revenue expansion shows that digital content, online platforms, and immersive experiences are becoming more important revenue channels for media companies.
The music industry also reflects this shift. According to IFPI’s Global Music Report 2026, recorded music revenue reached USD 31.7 billion in 2025, increasing by 6.4%, with streaming revenue exceeding USD 22 billion. As audiences move from passive viewing and listening toward more interactive and experience-based entertainment, metaverse platforms create new opportunities for virtual concerts, fan communities, branded events, and digital merchandise.
Key Market Segments
By Product
- Hardware
- Holographic Displays
- eXtended Reality (XR) Hardware
- Haptic Sensors and Devices
- Smart Glasses
- Omni Treadmills
- AR/VR Devices
- Others
- Infrastructure
- Chips and Processors
- Network Capabilities
- Cloud and Edge Infrastructure
- Cybersecurity
- Software
- Asset Creation Tools
- Programming Engines
- Virtual Platforms
- Avatar Development
- Services
- User Experiences
- Asset Marketplaces
- Financial Services
By Platform Type
- Desktop/Laptops
- Mobile
- Wearables
By Technology
- Mixed Reality (MR)
- Natural Language Processing (NLP)
- Blockchain
- Others
By End Use Industry
- Aerospace and Defense
- Education
- Aerospace and Defense
- Tourism and Hospitality
- BFSI
- Retail
- Media and Entertainment
- Automotive
- Others
Geopolitical Impact Analysis
The metaverse market faces a major challenge from rising supply chain pressure and higher operating costs. The market depends heavily on hardware such as XR headsets, spatial computing devices, AI chips, sensors, optical parts, and high-bandwidth memory. These components require critical raw materials and advanced semiconductor supply chains, which are increasingly affected by geopolitical tensions, especially between the U.S. and China.
China’s export controls on rare earth elements, including dysprosium, terbium, and gadolinium, create added risk for manufacturers of XR devices, haptic systems, display components, and precision optical equipment. Since these materials are used in magnets, sensors, and advanced electronic parts, any restriction can delay production and increase component costs. In addition, trade uncertainty and tariff pressure are forcing companies to diversify suppliers, hold higher inventory, and manage currency risks.
Energy cost is another important restraint for the metaverse market. Metaverse platforms rely on cloud rendering, real-time data processing, AI workloads, and low-latency edge computing. These activities require large data centers with high electricity consumption. According to the International Energy Agency, global data center electricity use is expected to rise from 485 TWh in 2025 to around 950 TWh by 2030. As power demand and energy prices increase, operating costs for metaverse platforms may rise further.
Regional Analysis
North America leads with a 42.4% share and a USD 63.4 billion market value.
North America holds the leading position in the metaverse market, accounting for around 42.4% of global revenue, equal to nearly USD 63.4 billion. This dominance can be attributed to the region’s strong technology base, advanced enterprise digital adoption, and high consumer spending on immersive digital content.
The presence of major cloud service providers, gaming companies, social media platforms, semiconductor firms, and XR hardware manufacturers has created a strong ecosystem for metaverse infrastructure, devices, and applications. Enterprises in the region are also early adopters of virtual collaboration, digital twins, immersive training, and customer engagement tools. In addition, high IT spending, strong 5G coverage, and advanced fiber networks continue to support large-scale metaverse deployment.
Asia-Pacific is expected to be the fastest-growing regional market, supported by a large mobile-first population, rapid urban development, and increasing investment in digital platforms. Countries such as China, India, South Korea, and key Southeast Asian markets are witnessing strong growth in online gaming, social commerce, virtual entertainment, and digital services.
Key Regions and Countries
North America
- US
- Canada
Europe
- Germany
- France
- The UK
- Spain
- Italy
- Rest of Europe
Asia Pacific
- China
- Japan
- South Korea
- India
- Australia
- Rest of APAC
Latin America
- Brazil
- Mexico
- Rest of Latin America
Middle East & Africa
- GCC
- South Africa
- Rest of MEA
Market Dynamics
Challenge
Last-mile connectivity and limited edge infrastructure remain major constraints for the metaverse, as immersive multi-user experiences typically require end-to-end latency below 20-30 ms, while many mass-market 4G/5G networks in APAC and emerging regions still operate at 40-80 ms, with congestion often pushing latency above 120 ms.
Although global XR device shipments are expected to grow by more than 30% in 2026, edge data center capacity remains concentrated in North America, Western Europe, and East Asia. In industrial metaverse applications, the absence of nearby edge nodes can add 30-60 ms of latency and increase synchronization intervals from sub-second to 3-5 seconds, reducing real-time performance and limiting the number of concurrently monitored assets.
These infrastructure gaps reduce addressable demand in latency-sensitive applications by an estimated 10-15% and create roughly a 1.5 percentage point drag on global CAGR. Addressing this challenge will require broader edge deployment, network slicing, and phased infrastructure expansion over the next 4-7 years, alongside workload designs that adapt to varying latency conditions.
| Challenge | (~) % CAGR | Geographic Relevance | Mitigation Horizon |
|---|---|---|---|
| Fragmented standards & identity | -1.8% | North America, EU regulatory hubs, East Asia platforms | Long term (≥ 4 years) |
| High-latency infra & edge gaps | -1.5% | APAC logistics corridors, Emerging markets, EU rural zones | Long term (≥ 4 years) |
| Immersive hardware adoption friction | -1.3% | North America core, EU consumer markets, Urban APAC | Medium term (2-4 years) |
| Persistent talent & toolchain deficit | -1.1% | Global tech hubs, Tier-2 cities, Offshore dev centers | Long term (≥ 4 years) |
| Enterprise ROI & governance ambiguity | -1.0% | North America enterprises, EU regulatory hubs, APAC corporates | Medium term (2-4 years) |
| Cyber, IP leakage & trust deficit | -0.9% | Global, with higher impact in cross-border data hubs | Medium term (2-4 years) |
Opportunity
Spatial commerce and virtual retail media represent a significant growth opportunity because most current metaverse forecasts are still centered on gaming and social experiences, while immersive retail and advertising remain in the early stages of adoption.
If 3-5% of global online retail GMV shifts into immersive shopping environments by 2030, with platform, payment, logistics, and media providers capturing a 15-20% take rate, the resulting revenue opportunity could exceed USD 500-700 billion annually by 2035. Retailers can also reduce customer acquisition costs by 15-25% and improve conversion rates by 20-30% through 3D product visualization, AI-assisted shopping, and personalized virtual experiences.
Virtual retail media, including 3D product placements, branded virtual worlds, and interactive shopping events, can command 2-3x higher CPMs than traditional digital display advertising due to stronger engagement and longer user dwell times. Since measurement standards, ad technology integration, and large-scale retailer participation are still evolving, immersive commerce remains an underrepresented opportunity in current metaverse market forecasts rather than a baseline growth driver.
| Opportunity | (~) % Potential CAGR | Geographic Relevance | Execution Window |
|---|---|---|---|
| Industrial & enterprise metaverse platforms | +2.5% | North America, Europe, East Asia | Medium term (2–4 years) |
| Metaverse payments, DeFi & tokenized assets | +1.8% | North America, APAC, GCC hubs | Medium term (2–4 years) |
| Spatial commerce & virtual retail media | +1.5% | North America core, EU, APAC emerging | Short term (≤ 2 years) |
| Metaverse-based education, training & healthcare | +1.2% | APAC, Middle East, Latin America | Long term (≥ 4 years) |
| Open, interoperable avatar & identity layer | +0.8% | Global tier-1 digital economies | Long term (≥ 4 years) |
| Telco & cloud “metaverse infra-as-a-service” | +1.0% | North America, Europe, APAC developed | Medium term (2–4 years) |
Driver
Wider 5G and edge node deployments are accelerating metaverse adoption by shifting compute closer to users, reducing round-trip latency and lowering per-session bandwidth costs. This architectural transition supports real-time spatial computing experiences such as persistent multi-user worlds and haptic interactions, contributing an estimated 3.2 percentage points to CAGR.
By enabling 30-70 ms end-to-end latency, edge infrastructure allows platform operators to replace high-cost centralized GPU processing with localized edge instances, reducing compute costs per concurrent user by an estimated 20-40% in dense urban areas.
These efficiency gains improve service economics while enabling low-latency SLAs for enterprise AR and immersive collaboration use cases across APAC, Europe, and North America, making edge-enabled infrastructure a key enabler of next-generation metaverse applications.
| Driver | (~) % Impact on CAGR | Geographic Relevance | Impact Timeline |
|---|---|---|---|
| 1. Consumer AR/VR device adoption acceleration | +2.8% | APAC corridors, North America core | Short term (≤ 2 years) |
| 2. Edge + 5G deployment reducing latency costs | +3.2% | APAC corridors, EU corridors, North America core | Medium term (2–4 years) |
| 3. Enterprise XR / B2B verticalisation (healthcare, manufacturing) | +1.6% | North America core, EU core, APAC industrial hubs | Short–Medium term (≤4 years) |
| 4. Token/NFT monetization maturation and regulation | +1.1% | North America core, EU regulatory zone, select APAC markets | Medium term (2–4 years) |
| 5. Interoperability & standards (avatars, identity, assets) | +1.4% | EU corridors, North America core, APAC developer hubs | Long term (≥4 years) |
| 6. Privacy & data-governance compliance costs (regulatory tightening) | -1.5% | EU regulatory zone, North America core, APAC with data laws | Short–Medium term (≤4 years) |
Restraint
XR hardware affordability remains a key restraint on metaverse adoption because consumer and enterprise uptake still depends heavily on headsets and smart glasses. In 2026, global XR headwear shipments are forecast to decline by 12% to 6.2 million units, reflecting weaker demand for VR and mixed reality headsets despite growing interest in lower-cost smart glasses.
The challenge extends beyond device pricing to total deployment costs. A typical XR rollout includes hardware, software licensing, device management, content development, and ongoing support, meaning a 10-15% increase in hardware costs can raise the overall pilot budget per user by 25-40%.
These higher ownership costs slow the transition from pilot projects to large-scale deployments, shifting enterprise spending toward replacement cycles instead of expansion. This delays adoption across gaming, training, and collaboration applications, limiting near-term metaverse market growth until hardware becomes more affordable and deployment costs decline.
| Restraint | (~) % Impact on CAGR | Geographic Relevance | Impact Timeline |
|---|---|---|---|
| XR hardware affordability | -2.0% | North America core, EU, APAC urban | Short term (≤ 2 years) |
| Privacy and biometric rules | -1.7% | EU core, US states, UK | Medium term (2-4 years) |
| Cybersecurity and fraud risk | -1.4% | North America core, EU, APAC finance hubs | Short term (≤ 2 years) |
| ROI and integration friction | -1.9% | Global enterprise markets | Medium term (2-4 years) |
| Component shortages and lead times | -1.5% | APAC supply chain, North America assembly, EU import markets | Short term (≤ 2 years) |
| Standards fragmentation and platform lock-in | -1.2% | North America core, EU, APAC | Long term (≥ 4 years) |
Key Players Analysis
Tier-1 metaverse leaders are defined by their ability to combine large platform revenues with strong investment in infrastructure, hardware, cloud computing, artificial intelligence, and R&D. Meta Platforms remains one of the largest financial supporters of the consumer metaverse ecosystem. The company reported USD 200.97 billion in total revenue in 2025.
Microsoft also holds a strong Tier-1 position through Xbox, Azure, and Mesh-enabled collaboration tools. In FY2025, Microsoft’s Gaming revenue increased by USD 2.0 billion, or 9%, while Xbox content and services revenue rose by 16%, supported by the Activision Blizzard acquisition and Game Pass. These assets provide a strong content, cloud, and platform foundation for metaverse applications.
NVIDIA represents the core compute layer of the metaverse, supported by its fiscal 2025 revenue of USD 130.5 billion, up 114% year-on-year. Its growth was mainly driven by data center accelerated computing and AI platforms, which are essential for real-time 3D rendering, simulation, and large-scale virtual environments. Together, Meta, Microsoft, and NVIDIA can be reasonably viewed as controlling around 50% to 60% of the global metaverse infrastructure value pool, based on their combined strength in AI, cloud, XR platforms, and immersive technology investment.
Tier-2 metaverse challengers are mainly represented by content-led, experience-driven, and 3D development platforms such as Roblox, Unity, Epic Games, NetEase, The Sandbox, and Active Theory. Roblox is the strongest pure-play metaverse ecosystem, with USD 4.9 billion in 2025 revenue, reflecting 36% year-on-year growth. The company also reported USD 6.8 billion in bookings, up 55%, supported by 144 million daily active users and 35 billion engagement hours.
Top Key Players in the Market
- Unity Technologies
- The Sandbox
- Active Theory
- Roblox Corporation
- NVIDIA Corporation
- Antiersolutions.
- NetEase, Inc.
- Microsoft
- Meta
- Lilith Games
- Epic Games, Inc.
- Decentraland
- ByteDance Ltd.
- Tencent Holdings Ltd.
- Nextech AR Solutions Inc.
Recent Developments
- In January 2026, Meta announced the closure of three VR game studios (Sanzaru Games, Twisted Pixel, Armature Studio) within Reality Labs to reallocate several hundred million dollars of operating expense toward Horizon OS, next-generation VR headsets, and AR wearables, while maintaining a USD 19.19 billion Reality Labs operating loss in 2025 as disclosed in its 2025 Form 10-K.
- In May 2026, NVIDIA expanded its industrial metaverse footprint by commercializing NVIDIA Omniverse as a set of physical AI microservices for digital twins and robotics simulation, backed by USD 130.5 billion fiscal 2025 revenue and triple-digit data center segment growth that funds large-scale Omniverse R&D and ecosystem partnerships.
Report Scope
| Report Features | Description |
|---|---|
| Market Value (2025) | USD 149.6 Billion |
| Forecast Revenue (2035) | USD 6,192.1 Billion |
| CAGR (2026-2035) | 45.2% |
| Base Year for Estimation | 2025 |
| Historic Period | 2020-2024 |
| Forecast Period | 2026-2035 |
| Report Coverage | Revenue Forecast, Market Dynamics, Competitive Landscape, Recent Developments |
| Segments Covered | By Product (Hardware, (Holographic Displays, eXtended Reality (XR) Hardware, Haptic Sensors and Devices, Smart Glasses, Omni Treadmills, AR/VR Devices, Others), Infrastructure (Chips and Processors, Network Capabilities, Cloud and Edge Infrastructure, Cybersecurity), Software (Asset Creation Tools, Programming Engines, Virtual Platforms, Avatar Development), Services (User Experiences, Asset Marketplaces, Financial Services)), By Platform Type (Desktop/Laptops, Mobile, Wearables), By Technology (Mixed Reality (MR), Natural Language Processing (NLP), Blockchain, Others), By End Use Industry (Aerospace and Defense, Education, Tourism and Hospitality, BFSI, Retail, Media and Entertainment, Automotive, Others) |
| Regional Analysis | North America – US, Canada; Europe – Germany, France, The UK, Spain, Italy, Rest of Europe; Asia Pacific – China, Japan, South Korea, India, Australia, Singapore, Rest of APAC; Latin America – Brazil, Mexico, Rest of Latin America; Middle East & Africa – GCC, South Africa, Rest of MEA |
| Competitive Landscape | Unity Technologies, The Sandbox, Active Theory, Roblox Corporation, NVIDIA Corporation, Antier Solutions, NetEase Inc., Microsoft Corporation, Meta Platforms Inc., Lilith Games, Epic Games Inc., Decentraland, ByteDance Ltd., Tencent Holdings Ltd., Nextech AR Solutions Inc. |
| Customization Scope | Customization for segments and region- and country-level will be provided. Moreover, customization can be tailored to the requirements. |
| Purchase Options | We have three licenses to opt for: Single User License, Multi-User License (Up to 5 Users), Corporate Use License (Unlimited Users and Printable PDF) |





























