


Report Overview
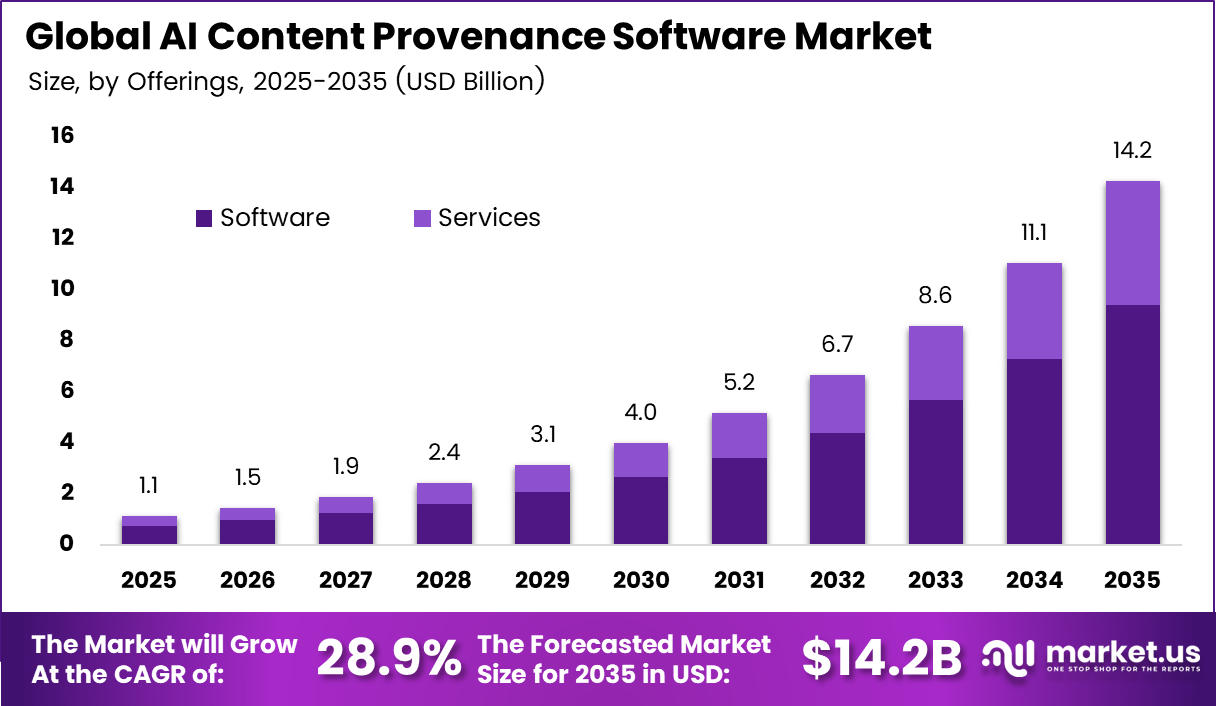
In 2025, the Global AI Content Provenance Software Market was valued at USD 1.1 billion. The market is projected to grow at a CAGR of 28.9% during 2026–2035, reaching approximately USD 14.2 billion by 2035. North America dominated the global market in 2025, accounting for more than 34.6% of the total market share and generating approximately USD 380 million in revenue.
Provenance software records where digital content comes from and how it changes. It uses signed metadata, watermarks, and detection models. Demand grows as more people go online and AI fraud rises. The ITU reported that about 6.0 billion people used the internet in 2025, or nearly 74% of the world. Each of these users now sees more AI-generated images, audio, and text.
The FBI Internet Crime Complaint Center logged USD 16.6 billion in reported losses in 2024, up 33% from 2023. Banks, media firms, insurers, and schools now buy tools that prove content is real before they act on it.
North American region holds the largest group of AI model makers, cloud providers, and C2PA founding members. The IMF puts US GDP at more than USD 29 trillion in 2025, about 26% of world output. US federal agencies also fund detection work directly. The Defense Innovation Unit chose one vendor from a pool of 36 companies for a deepfake detection prototype.
Key Takeaways
- The Global AI Content Provenance Software Market reached USD 1.1 billion in 2025 and will hit USD 14.2 billion by 2035. The market will grow at a CAGR of 28.9% during the forecast period.
- By Offerings, Software led with a 72.4% share of the market.
- By Deployment Model, Cloud led with a 68.1% share of the market.
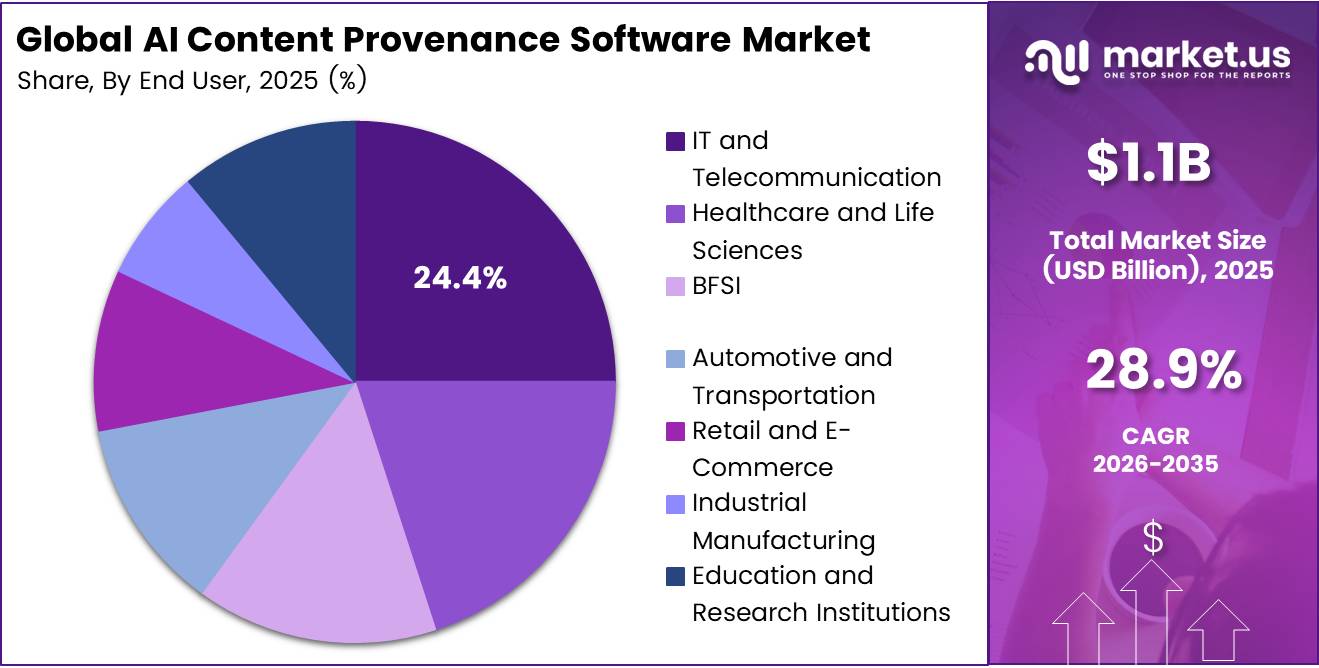
- By End User, IT and Telecommunications led with a 24.4% share of the market.
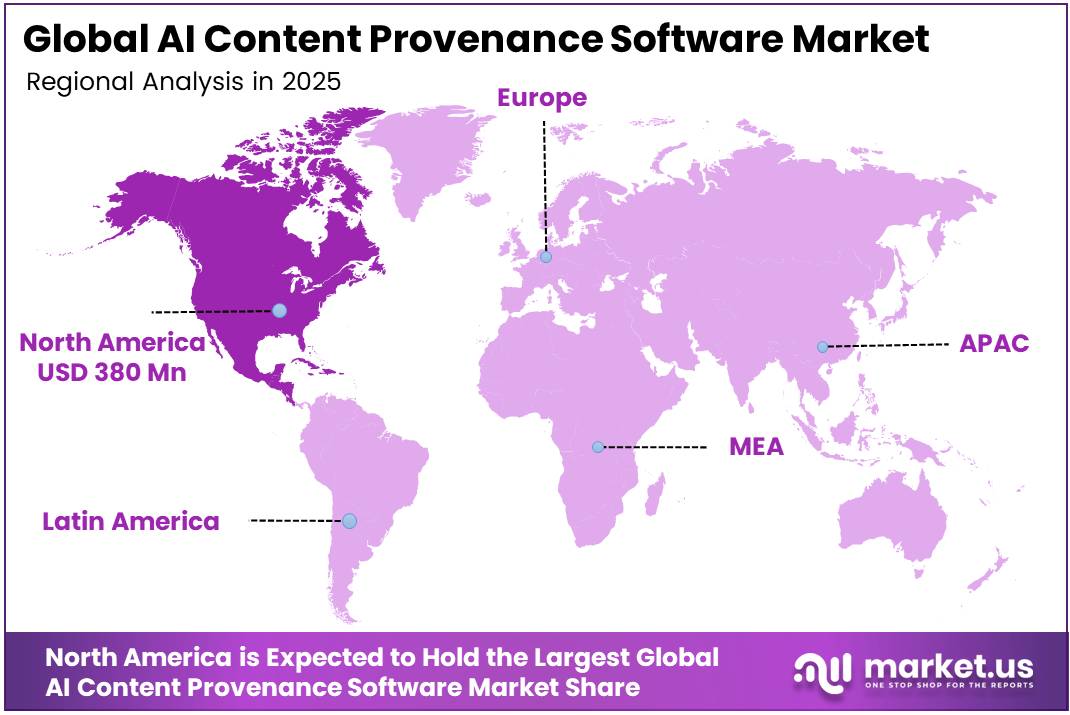
- North America led the market with a 34.6% share, worth USD 380 million in revenue.
By Offerings
Software dominates with 72.4% due to built-in content signing across major platforms.
Software leads because companies need tools that sign, label, and check digital content at scale. More than 6,000 members and affiliates now run live apps that use Content Credentials, the open standard from the C2PA (Coalition for Content Provenance and Authenticity).
Services are growing fastest because laws now make provenance a duty instead of a choice. The EU AI Act’s Article 50 transparency rules apply from August 2026. They require AI-made content to carry machine-readable labels, and breaches can cost up to €15 million or 3% of global yearly turnover. Most firms lack the in-house skills to meet these rules, so they hire outside experts for setup, audits and staff training.
The C2PA started a Conformance Program in late 2025 and released Content Credentials version 2.3 soon after. Each new version pushes vendors to retest and update their systems. Service partners link provenance tools to existing content systems and keep clients up to date, which creates steady repeat demand.
By Deployment Model
Cloud dominates with 68.1% due to wide enterprise use of paid cloud services.
Cloud holds the top spot because most businesses already run their daily work online. In 2025, 52.7% of EU enterprises paid for cloud computing services, up 7.4 percentage points from 2023. That is a big jump from 17.8% in 2014. Provenance tools hosted in the cloud plug easily into these existing setups.
Hybrid is gaining fastest because cloud uptake is still very uneven. Finland reached 79.21% cloud use, while Greece stood at 24.33% and Bulgaria at 17.83%. Many firms in slower markets keep key systems on their own servers. A hybrid model lets them add cloud features without moving everything at once.
Regulated buyers also want to keep their signing keys and sensitive files on-site while running checks in the cloud. Hybrid setups let them follow strict data rules and still grow capacity when demand spikes. On-premises demand stays limited to defence and high-security users who need full control.
By End User
IT and telecommunications dominate with 24.4% due to huge volumes of shared digital content.
IT and telecom firms lead because they carry most of the world’s digital media. According to the ITU, about 6 billion people, or 74% of the world’s population, used the internet in 2025. Networks and platforms of this size need provenance tools to flag fake or altered files before they spread.
Healthcare and life sciences are growing fastest as AI spreads through medical care. The FDA reports more than 1,600 AI-enabled medical devices authorized for the US market by September 2026. The agency authorized 181 such devices in the first half of 2026, compared with 173 in the same period of 2025.
Every AI-made scan, report, or image needs a clear record of who created it and how it changed. Hospitals and drug makers use provenance software to protect patient safety, pass audits, and defend against legal claims. This demand for proof will keep pushing healthcare spending up.
Key Market Segments
By Offerings
- Software
- Services
By Deployment Model
- Cloud
- Hybrid
- On-premises
By End User
- IT and Telecommunication
- Healthcare and Life Sciences
- BFSI
- Automotive and Transportation
- Retail and E-Commerce
- Industrial Manufacturing
- Education and Research Institutions
- Others
Geopolitical Impact Analysis
Provenance software runs on GPUs, servers, and secure chips. Trade fights over these parts now raise costs for vendors. In 2025, the US raised its tariffs on many Chinese goods by more than 100% at the peak, before cutting them. The WTO warned that world goods trade volume could fall by 0.2% in 2025 because of these moves. Vendors that train detection models feel these costs first.
Export controls also shape supply. US rules limit sales of advanced AI chips to China and some other markets. This splits the market into two tech stacks. Chinese buyers lean on local cloud and local models. Western vendors lose access to a large group of buyers but gain government demand at home.
Shipping delays add to hardware costs. UNCTAD reported that Suez Canal transits fell by more than 50% after Red Sea attacks. Ships that go around Africa add about 10 to 14 days to Asia-to-Europe trips. Server and camera module deliveries for data centres and capture devices slip as a result. This pushes buyers toward cloud delivery, which needs less local hardware.
Energy prices matter too. The IEA expects data centre power use to more than double to about 945 TWh by 2030. Gas price spikes tied to conflict in Europe raise hosting costs for detection workloads. The World Bank also tracks steady disinformation risk around elections. In 2024, more than 60 countries held national votes, and that drove public sector demand for deepfake checks.
Regional Analysis
North America dominates the AI Content Provenance Software Market, holding a 34.6% share and generating USD 380 million in revenue. The US drives most of this demand. American firms such as Adobe, Microsoft, Google, and OpenAI back the C2PA standard.
The US government acts as a major early buyer. The Department of Defense signed a USD 2.4 million two-year deepfake detection contract with Hive. Federal agencies run detection models offline, on their own sites, which lifts hybrid and on-premises demand. Banks add more pull.
Asia Pacific is the fastest-growing region in this market. China’s labelling measures for AI-generated content took effect on September 1, 2025, and require both visible and hidden labels. India proposed rules that require labels covering at least 10% of the visual area of synthetic media. Japan and South Korea add demand through strong telecom and media sectors.
Europe holds the second largest position, driven by regulation. The EU AI Act requires providers of generative AI to mark synthetic content in a machine-readable format from August 2026. Fines can reach EUR 15 million or 3% of global turnover. Germany, France, and the UK lead buying, mostly in media, banking, and the public sector.
Key Regions and Countries
North America
- US
- Canada
Europe
- Germany
- France
- The UK
- Spain
- Italy
- Rest of Europe
Asia Pacific
- China
- Japan
- South Korea
- India
- Australia
- Rest of APAC
Latin America
- Brazil
- Mexico
- Rest of Latin America
Middle East and Africa
- GCC
- South Africa
- Rest of MEA
Market Dynamics
Drivers
| Driver | (~) % Impact on CAGR Forecast | Geographic Relevance | Impact Timeline |
|---|---|---|---|
| EU AI Act Article 50 Enforcement | +1.8% | European Union; global exporters | Short term (2 years or less) |
| Generative-Content Volume Growth | +1.2% | Global; strongest in North America, Europe, and East Asia | Short term (2 years or less) |
| Impersonation-Fraud Escalation | +0.9% | North America, Europe, and Asia-Pacific | Short term (2 years or less) |
| Platform Labelling Procurement | +0.7% | Global digital-platform markets | Medium term (2 to 4 years) |
| Brand-Safety Verification Demand | +0.5% | North America, Europe, and mature advertising markets | Medium term (2 to 4 years) |
| Rights-Evidence Requirements | +0.4% | United States, European Union, United Kingdom, and creative-export economies | Medium term (2 to 4 years) |
EU AI Act Article 50 Enforcement
The European Commission states that Article 50 transparency obligations became applicable on 2 August 2026, requiring machine-readable marking of synthetic outputs and perceptible disclosure of deepfakes and certain public-interest text, while EUR-Lex records the regulation’s entry into force on 1 August 2024 and its requirement for effective, interoperable, robust, and reliable marking where technically feasible.
The European Commission places maximum non-compliance exposure at €15 million or 3% of worldwide annual turnover, while NIST’s 2024 synthetic-content guidance identifies provenance records, digital signatures, watermarking, and detection as complementary controls rather than optional metadata.
Calibrating the commercial mechanism to those European Commission enforcement thresholds and NIST control expectations supports an estimated +1.8% contribution relative to the 28.9% baseline CAGR, policy dashboards, and audit-retention subscriptions capable of raising contract value by approximately 15%–25% while shortening enterprise approval cycles by an estimated 10%–20%.
Restraints
| Restraint | (~) % Impact on CAGR Forecast | Geographic Relevance | Impact Timeline |
|---|---|---|---|
| Unsettled Evidentiary Liability | -1.3% | United States and legally fragmented markets | Short term (2 years or less) |
| SME Willingness-to-Pay Ceiling | -1.0% | Global; strongest in price-sensitive emerging markets | Medium term (2 to 4 years) |
| Privacy-Metadata Objections | -0.8% | European Union, United Kingdom, and privacy-regulated jurisdictions | Short term (2 years or less) |
| Free-Verifier Commoditisation | -0.6% | Global self-service and developer markets | Medium term (2 to 4 years) |
| Procurement-Budget Fragmentation | -0.5% | Global enterprises and public institutions | Short term (2 years or less) |
| Jurisdictional Mandate Asymmetry | -0.3% | Cross-border and developing markets | Long term (4 years or more) |
Unsettled Evidentiary Liability
The U.S. Copyright Office concluded in 2024 that gaps in existing protection warranted federal legislation for unauthorized digital replicas after reviewing more than 10,000 public comments, but provenance records still do not automatically establish ownership, consent, falsity, or legal liability.
Calibrating procurement risk to these U.S. Copyright Office, NIST, and California policy gaps produces an estimated -1.3% baseline CAGR deduction: legal departments may limit deployments to non-dispositive monitoring, reduce initial seat commitments by approximately 15%–25%, and defer enterprise-wide contracts for 6–12 months until courts, statutes, or contractual warranties clarify how provenance assertions can be used in disputes.
Challenges
| Challenge | (~) % CAGR Friction Drag | Geographic Relevance | Mitigation Horizon |
|---|---|---|---|
| Metadata Stripping Resilience | -1.4% | Global content-distribution ecosystems | Medium term (2 to 4 years) |
| Multimodal Detection Drift | -1.0% | Global; highest in fast-moving model markets | Long term (4 years or more) |
| Trust-List Governance Scale | -0.8% | Global standards and certificate ecosystems | Medium term (2 to 4 years) |
| Legacy Workflow Integration | -0.6% | Global media, government, and regulated enterprises | Medium term (2 to 4 years) |
| Forensics Talent Scarcity | -0.5% | Global; acute in emerging technology markets | Long term (4 years or more) |
| Real-Time Verification Latency | -0.4% | Global high-volume platforms and streaming services | Medium term (2 to 4 years) |
Metadata Stripping Resilience
The C2PA security specification states that cryptographic hashes and signatures expose manifest tampering but cannot prevent complete manifest removal, while NIST reports that metadata is frequently stripped during sharing and that adversaries can remove or manipulate even robust watermark signals.
Calibrating the mitigation burden to C2PA’s repository architecture and NIST’s adversarial findings indicates approximately -1.4% friction against maximum CAGR potential, with multi-signal validation potentially increasing per-asset processing cost by 20%–35%, adding 100–300 milliseconds to complex media checks, and compressing software gross margin by roughly 150–300 basis points unless suppliers invest in edge caching, perceptual fingerprints, and modality-specific recovery models.
Opportunities
| Opportunity | (~) % Potential CAGR Upside | Geographic Relevance | Execution Window |
|---|---|---|---|
| Enterprise Provenance Orchestration | +1.4% | Global large enterprises and digital supply chains | Medium term (2 to 4 years) |
| Training-Data Lineage Licensing | +0.9% | United States, European Union, and content-producing economies | Medium term (2 to 4 years) |
| On-Device Capture Attestation | +0.7% | Global smartphone, camera, and field-workforce markets | Long term (4 years or more) |
| Insurance Claims Evidence | +0.5% | North America, Europe, Japan, and Australia | Medium term (2 to 4 years) |
| Agentic-Content Audit Trails | +0.4% | Global enterprise-software markets | Long term (4 years or more) |
| Public-Record Authenticity Networks | +0.3% | Governments, courts, elections, and public archives globally | Long term (4 years or more) |
Enterprise Provenance Orchestration
This opportunity remains future white space rather than a present driver because most deployments verify individual files or generation events instead of maintaining an interoperable chain across creation, editing, approval, distribution, and archival systems.
Eurostat recorded EU enterprise AI adoption rising from 13.5% in 2024 to 20.0% in 2025, while only 9.5% used AI to generate images, video, or audio. OECD data similarly place firm-level AI use at 20.2% in 2025 versus 14.2% in 2024 and 8.7% in 2023, while the Content Authenticity Initiative’s expansion from 4,000 members in late 2024 to 5,000 in 2025 signals ecosystem breadth without yet establishing end-to-end enterprise monetisation.
A scenario calibrated to Eurostat, OECD, and content-authenticity adoption milestones supports potential upside of +1.4% above the 28.9% baseline CAGR: orchestration subscriptions, verification APIs, and auditable evidence vaults could lower verification cost per asset by approximately 30%–50%, lift recurring gross margin by 20%–35%, and expand revenue per enterprise by roughly 25%–40% compared with stand-alone detection licences.
Key Players Analysis
Tier 1 leaders include Turnitin, Digimarc, Hive, and Truepic. Turnitin holds the largest footprint in education. Advance Publications bought it for USD 1.75 billion in 2019. Digimarc is the only publicly listed pure play here. It reported FY2025 revenue of USD 33.9 million, down from USD 38.4 million in FY2024. It still spent USD 20.5 million on R&D, which is about 60% of revenue.
Digimarc also cut operating costs by 18% to USD 54.1 million after a reorganisation of 96 employees. It now ties its watermarking to the C2PA standard. Hive leads in detection for platforms. It scans billions of content items each month and won a USD 2.4 million Department of Defense contract. Truepic, a C2PA founding member, focuses on signed capture for insurers and inspections.
Tier 2 challengers hold strong niche positions. Reality Defender raised a Series A of USD 33 million and added strategic backers BNY and Samsung Next in 2025. GPTZero reached USD 30 million in annual recurring revenue and more than 20 million users on only USD 13.5 million raised. Copyleaks and Originality.ai compete with GPTZero in text detection for schools and publishers.
Attestiv serves insurance claims checks. OriginStamp offers blockchain timestamping. Serelay focuses on verified mobile capture. Sensity AI sells forensic deepfake detection to police and banks. Consolidation is speeding up. Superhuman agreed to buy GPTZero in June 2026, and buyers now value detection teams at 10x or more of the capital they raised.
Top Key Players in the Market
- Truepic, Inc.
- Attestiv, Inc.
- OriginStamp GmbH
- Serelay Ltd
- Digimarc Corporation
- Reality Defender, Inc.
- Sensity AI
- Hive Technology, Inc.
- Copyleaks, Inc.
- GPTZero, Inc.
- Originality.ai Inc.
- Turnitin, LLC
Recent Developments
- In July 2025, Reality Defender launched a public API with a free tier of 50 deepfake scans per month, which opened its enterprise detection models to developers. Reality Defender released Real Suite, which bundles 4 products (RealScan, RealAPI, RealCall, and RealMeeting) into one enterprise platform.
- In March 2026, Digimarc Corporation reported FY2025 revenue of USD 33.9 million and cut operating expenses by 18% to USD 54.1 million as it shifted toward C2PA provenance and authentication.
- In June 2026, Superhuman agreed to acquire GPTZero, Inc., a business with USD 30 million in annual recurring revenue and more than 20 million registered users.
- In August 2026, Deel acquired deepfake security firm Clarity in a deal worth about USD 40 million to USD 50 million, paid in cash and shares.
Report Scope
| Report Features | Description |
|---|---|
| Market Value (2025) | USD 1.1 Billion |
| Forecast Revenue (2035) | USD 14.2 Billion |
| CAGR (2026-2035) | 28.9% |
| Base Year for Estimation | 2025 |
| Historic Period | 2020-2024 |
| Forecast Period | 2026-2035 |
| Report Coverage | Revenue Forecast, Market Dynamics, Competitive Landscape, Recent Developments |
| Segments Covered | By Offerings (Software, Services); By Deployment Model (Cloud, Hybrid, On-premises); By End User (IT and Telecommunication, Healthcare and Life Sciences, BFSI, Automotive and Transportation, Retail and E-Commerce, Industrial Manufacturing, Education and Research Institutions, Others) |
| Regional Analysis | North America – US, Canada; Europe – Germany, France, The UK, Spain, Italy, Rest of Europe; Asia Pacific – China, Japan, South Korea, India, Australia, Singapore, Rest of APAC; Latin America – Brazil, Mexico, Rest of Latin America; Middle East & Africa – GCC, South Africa, Rest of MEA |
| Competitive Landscape | Truepic, Inc., Attestiv, Inc., OriginStamp GmbH, Serelay Ltd, Digimarc Corporation, Reality Defender, Inc., Sensity AI, Hive Technology, Inc., Copyleaks, Inc., GPTZero, Inc., Originality.ai Inc., Turnitin, LLC |
| Customization Scope | Customization for segments and region/country-level will be provided. Moreover, additional customization can be done based on the requirements. |
| Purchase Options | We have three licenses to opt for: Single User License, Multi-User License (Up to 5 Users), Corporate Use License (Unlimited Users and Printable PDF) |





























