


Report Overview
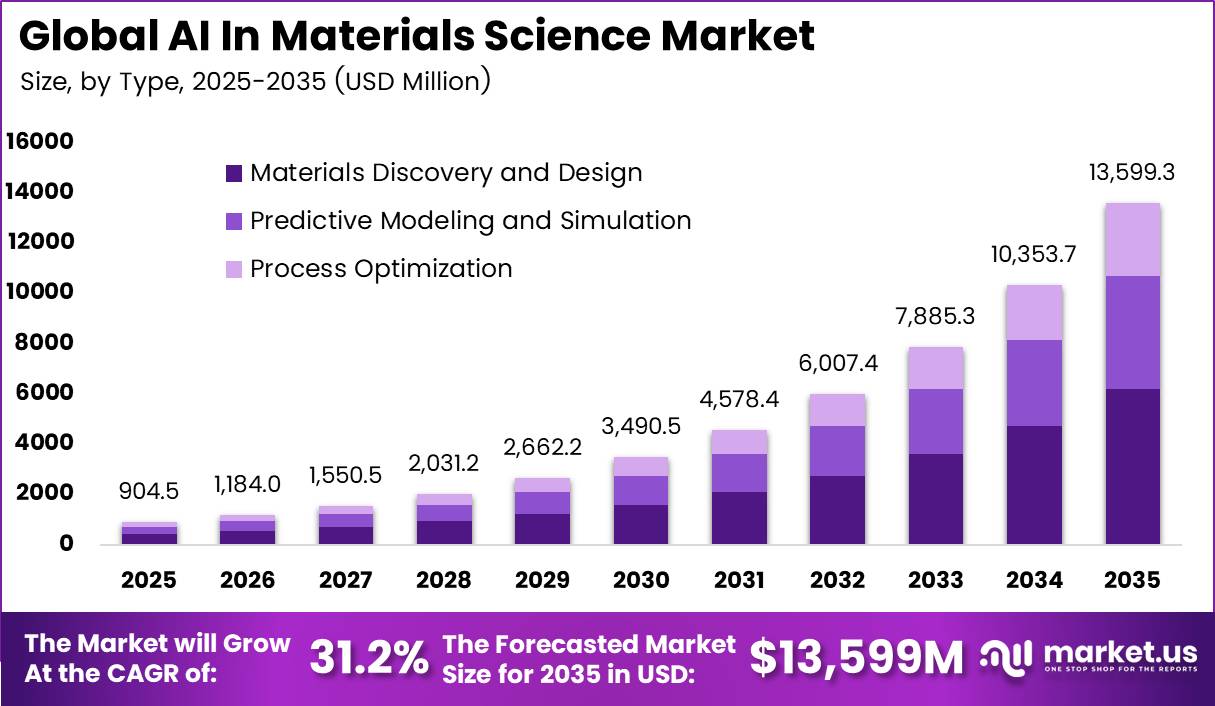
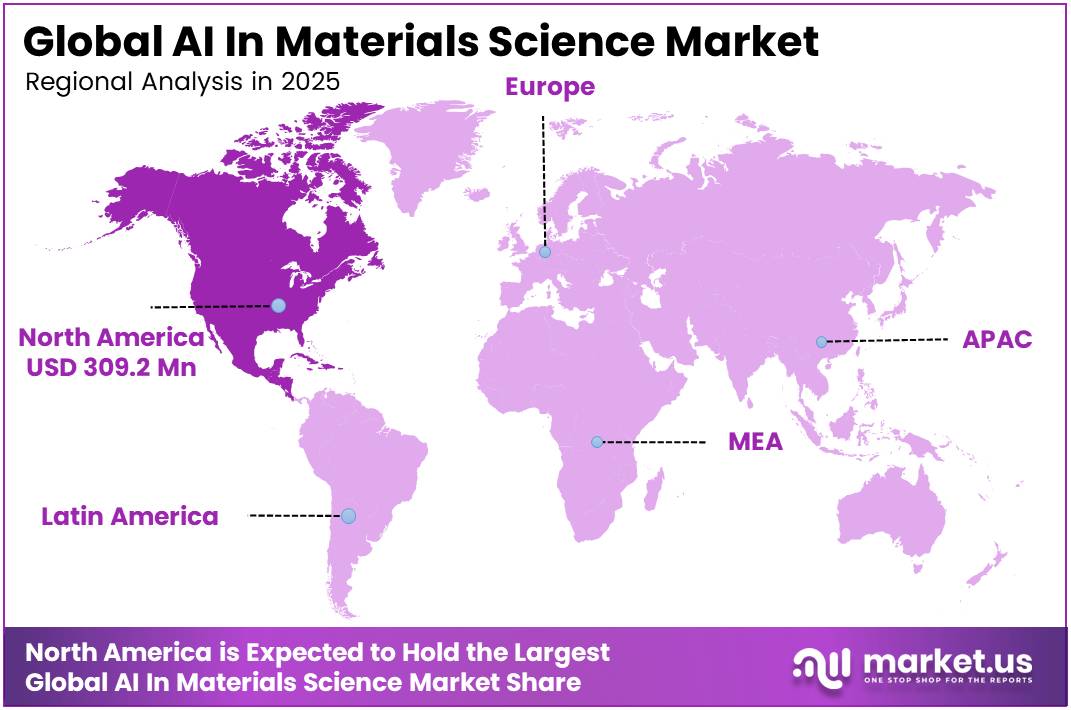
In 2025, the Global AI in Materials Science Market was valued at USD 904.5 million. The market is projected to grow at a CAGR of 31.2% during 2026–2035, reaching approximately USD 13,599.3 million by 2035. North America dominated the global market in 2025, accounting for more than 34.2% of the total market share and generating approximately USD 309.2 million in revenue.
Drug makers create the largest pull for these tools. PhRMA reported that its member companies invested about $104 billion in R&D in 2024, equal to about 21% of their global revenue. Firms with research budgets this large want faster ways to find molecules, polymers, and formulations. AI tools help them cut the number of costly lab tests. Hardware demand also adds fuel.
The WTO reported that trade in AI-related goods, such as semiconductors and servers, rose 20% year on year in the first half of 2025. Each new chip generation needs better materials, and AI helps engineers design them in months instead of years.
North American region backs science with deep budgets. Eurostat data show that the United States spent 3.44% of its GDP on R&D in 2024, well above the EU ratio of 2.26%. US business R&D alone equaled 2.67% of GDP. The region also hosts the cloud and chip companies that train and run large AI models. This mix of research money and local computing power gives North American labs a strong head start in AI-driven materials work.
Key Takeaways
- The AI in materials science market reached USD 904.5 million in 2025 and will hit USD 13,599.3 million by 2035. The market will grow at a CAGR of 31.2% over the forecast period.
- By type, Materials Discovery and Design leads with a 42.3% share.
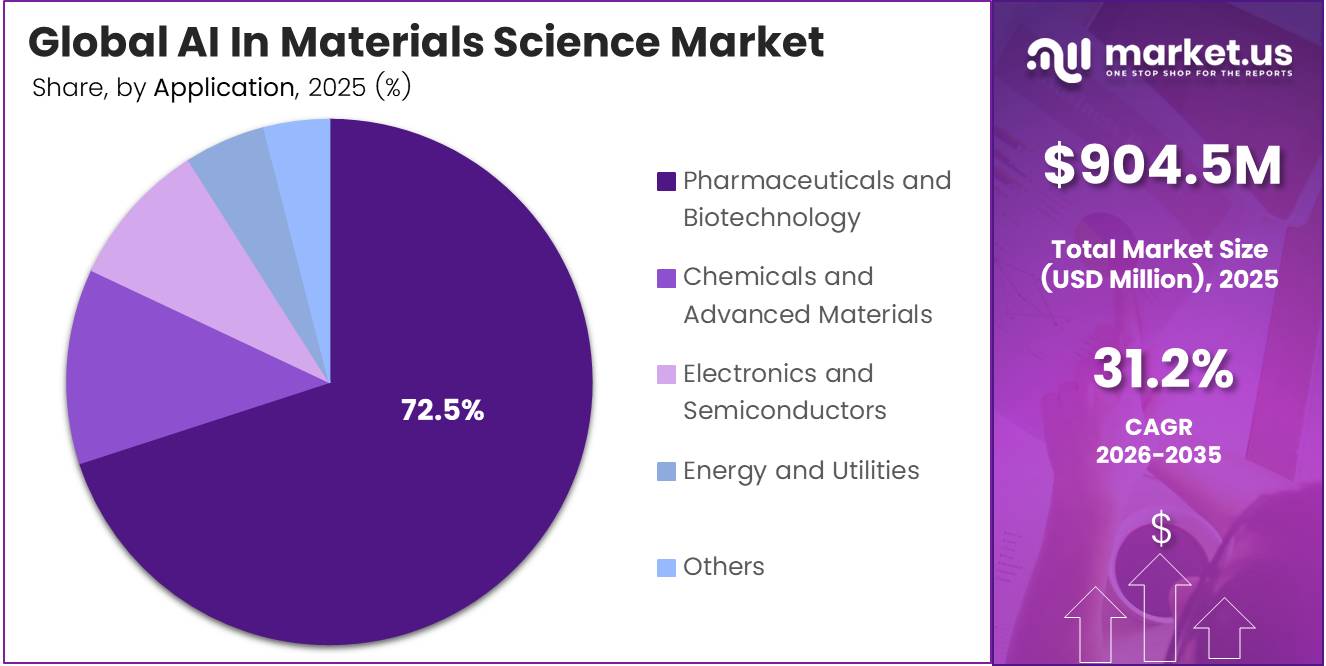
- By application, Pharmaceuticals and Biotechnology leads with a 72.5% share.
- North America dominates with a 34.2% share and USD 309.2 million in revenue.
By Type
Materials Discovery and Design dominates with 42.3% due to rapid AI-led crystal structure screening.
Materials Discovery and Design leads the market because companies want new materials faster and at a lower cost. Google DeepMind’s GNoME tool found 2.2 million new crystal structures, and about 380,000 of them look stable enough for lab work. DeepMind says this equals nearly 800 years of past knowledge. Results like these show buyers that AI can cut search cycles from years to weeks.
Predictive Modeling and Simulation is the fastest-growing type because firms now trust AI forecasts before they build anything. DeepMind reports that its model raised the discovery hit rate from about 50% to 80%. Outside labs have already made 736 of the predicted structures, which shows the models work in real life. Each correct forecast cuts wasted lab tests, saves money, and speeds up product launches.
By Application
Pharmaceuticals and Biotechnology dominate with 72.5% due to heavy AI use in drug development.
Pharmaceuticals and Biotechnology hold the largest share because drug makers spend heavily on AI to find and test new molecules. The FDA’s drug center saw just 1 AI-linked submission in 2016, but that number jumped to 132 in 2021. By 2023, the agency had handled more than 500 drug and biologic submissions with AI parts.
Clear rules also build buyer trust. The FDA used more than 800 public comments to shape its draft guidance on AI model credibility. This guidance tells drug firms how to prove their AI models work, which lowers the risk of investing.
Chemicals and Advanced Materials is the fastest-growing application because chemical makers now use AI to cut long, costly lab work. According to the American Chemistry Council, U.S. chemical firms invest $14.8 billion in research and development. Most companies spend 2–3% of yearly sales on research, and some spend up to 8–9%.
These large budgets let firms buy AI tools that test new polymers, coatings, and catalysts on screen first. The ACC also reports that 25% of chemical company capital spending goes to sustainable manufacturing, which raises demand for greener material design.
Key Market Segments
By Type
- Materials Discovery and Design
- Predictive Modeling and Simulation
- Process Optimization
By Application
- Pharmaceuticals and Biotechnology
- Chemicals and Advanced Materials
- Electronics and Semiconductors
- Energy and Utilities
- Others
Geopolitical Impact Analysis
Trade policy now shapes the cost of AI materials work. The WTO expects world merchandise trade volume growth to slow from 2.8% in 2024 to 2.4% in 2025 and just 0.5% in 2026. Higher US tariffs took effect in August 2025. These tariffs raise the landed cost of the GPUs, servers, and lab robots that AI materials platforms need.
Critical mineral controls hit this market directly. China controls about 98% of primary gallium supply. Western gallium spot prices rose 186%, from $240/kg in June 2023 to $687/kg in May 2025. German exports fell almost 60% in 2025, and European germanium prices reached $5,380/kg by October 2025. These metals go into chips and optical parts. Their scarcity pushes chipmakers to use AI to screen substitute materials.
Shipping problems add delay and cost. UNCTAD reported that Suez Canal tonnage stayed 70% below 2023 levels in May 2025. Ships that once crossed the Red Sea in days now sail for weeks around the Cape of Good Hope. Rerouting pushed ton-miles up a record 6% in 2024. Longer routes delay deliveries of specialty chemicals and lab equipment to research sites in Europe and Asia.
UNCTAD also expects maritime trade to grow just 0.5% in 2025. Slow and costly trade gives firms a clear reason to buy AI tools. Simulation lets labs test thousands of material options on screen, so they ship fewer physical samples across risky routes. This makes geopolitical stress both a cost burden and a demand driver for the market.
Regional Analysis
North America dominates the AI In Materials Science Market, holding a 34.2% share and generating USD 309.2 million in revenue. The United States anchors this lead. The OECD reported that US R&D spending reached $1.01 trillion in 2024 on a purchasing power basis, up 3.4% from the year before. The US also spends 0.5% of GDP on basic research, compared with 0.19% for China.
Basic research feeds the open data sets that AI models need to learn material behavior. Federal agencies also fund AI materials startups directly. ARPA-E awarded Citrine Informatics $300,000 to build tools for fusion power plant materials. The National Science Foundation picked Arzeda to lead a consortium worth about $6.3 million to scale cell-free biomanufacturing with AI-designed enzymes.
Asia Pacific is the fastest-growing region in the AI in materials science market. China drives this growth. The OECD reported that China spent $1.03 trillion on R&D in 2024 and grew spending by 9.7%. Japan spent 3.48% of GDP on R&D in 2024, and South Korea’s business R&D equaled 4.17% of GDP. India built a shared pool of more than 38,000 GPUs under its IndiaAI Mission, which has an outlay of over Rs 10,300 crore.
Europe holds a strong second position, led by Germany, France, and the UK. Eurostat reported that EU R&D spending reached €408 billion in 2024, or €909 per person. That figure rose 61.7% over ten years. Large chemical groups in Germany use AI to design catalysts and polymers. Growth is uneven across countries, though.
Key Regions and Countries
North America
- US
- Canada
Europe
- Germany
- France
- The UK
- Spain
- Italy
- Rest of Europe
Asia Pacific
- China
- Japan
- South Korea
- India
- Australia
- Rest of APAC
Latin America
- Brazil
- Mexico
- Rest of Latin America
Middle East and Africa
- GCC
- South Africa
- Rest of MEA
Market Dynamics
Drivers
| Driver | (~) % Impact on CAGR Forecast | Geographic Relevance | Impact Timeline |
|---|---|---|---|
| Foundation Models Industrialize Screening | +2.4% | Global; strongest in North America, Europe, and East Asia | Short term (2 years or less) |
| Autonomous Laboratories Scale Experimentation | +1.9% | United States, Europe, Japan, South Korea and China | Short term (2 years or less) |
| Clean-Energy Materials Demand | +1.5% | Global battery, hydrogen and renewable-energy clusters | Medium term (2 to 4 years) |
| Public AI-for-Science Funding | +1.2% | United States, European Union, United Kingdom and Asia-Pacific | Short term (2 years or less) |
| Accessible Cloud and HPC Infrastructure | +0.9% | Global research and industrial innovation hubs | Short term (2 years or less) |
| Industrial R&D Digitization | +0.7% | Advanced chemicals, electronics and manufacturing economies | Medium term (2 to 4 years) |
Foundation Models Industrialize Screening
Materials foundation and graph models are shifting commercial delivery from bespoke computational projects toward API-metered screening, recurring enterprise platforms and co-development licenses because reusable models can evaluate large candidate libraries before laboratory expenditure begins, consistent with NIST’s emphasis on integrated AI.
Materials Project release records documented additions of 15,483 and a further 30,000 GNoME-originated materials calculated at higher-fidelity theory levels. Department of Energy investment then exceeded US$320 million across initiatives that included 14 robotics and automated-laboratory projects and 37 foundational-AI awards, widening the customer base for model hosting, workflow integration and validated-data services while lowering customer-acquisition friction through publicly supported infrastructure.
Restraints
| Restraint | (~) % Impact on CAGR Forecast | Geographic Relevance | Impact Timeline |
|---|---|---|---|
| Qualification and Liability Gates | -1.9% | Global aerospace, nuclear, medical and automotive sectors | Long term (4 years or more) |
| Autonomous-Lab Capital Burden | -1.4% | Global; acute among universities and smaller manufacturers | Medium term (2 to 4 years) |
| Compute and Energy Economics | -1.1% | North America, Europe and power-constrained Asian hubs | Short term (2 years or less) |
| Sovereign Technology Controls | -0.8% | United States, China, European Union and allied markets | Medium term (2 to 4 years) |
| Pilot-Budget Concentration | -0.7% | Global industrial enterprises and public laboratories | Short term (2 years or less) |
| Restricted Cloud Deployment | -0.5% | Defense, nuclear and proprietary industrial environments | Medium term (2 to 4 years) |
Qualification and Liability Gates
The European Commission records that the AI Act became generally applicable on 2 August 2026 and requires risk management, traceability, documentation, human oversight, robustness and accuracy for covered high-risk systems, increasing assurance work where AI becomes a safety component of regulated products.
The Berkeley Lab-led A-Lab demonstration completed 355 experiments in 17 days and produced 41 of 58 target materials, a 71% target-level success rate, but only 37% of tested recipes yielded their intended targets; this residual failure rate preserves human-validation, insurance and audit costs, delays production CapEx and prevents software vendors from recognizing full deployment revenue at the discovery stage.
Challenges
| Challenge | (~) % CAGR Friction Drag | Geographic Relevance | Mitigation Horizon |
|---|---|---|---|
| Sparse Experimental Data | -1.8% | Global across specialized and emerging material classes | Long term (4 years or more) |
| Synthesis Translation Gap | -1.4% | Global laboratories and pilot-production facilities | Medium term (2 to 4 years) |
| Hybrid Talent Scarcity | -1.0% | Global; acute outside major research clusters | Long term (4 years or more) |
| Instrument Interoperability Burden | -0.8% | Global brownfield laboratory environments | Medium term (2 to 4 years) |
| Cross-Chemistry Model Drift | -0.6% | Global multi-domain platform providers | Medium term (2 to 4 years) |
| Benchmark Reproducibility Gaps | -0.5% | Global academic and commercial ecosystems | Long term (4 years or more) |
Sparse Experimental Data
The structural vulnerability is not raw record volume but the shortage of standardized, property-complete, and failure-inclusive experimental observations: Materials Project legacy statistics listed 144,595 inorganic compounds but only 14,072 elastic tensors and 3,402 piezoelectric tensors, leaving many commercially important property labels far thinner than structural datasets.
Peer-reviewed materials-informatics analysis indicates that parameter-rich models can require approximately 10,000 examples to control overfitting, yet evaluated specialist-property datasets contained only 120-8,043 examples, while NIST reports persistent deficiencies in interoperability, coordination and access to automated experimental technology.
Opportunities
| Opportunity | (~) % Potential CAGR Upside | Geographic Relevance | Execution Window |
|---|---|---|---|
| Outcome-Based Discovery Licensing | +1.8% | Global chemicals, energy, electronics and advanced manufacturing | Medium term (2 to 4 years) |
| Critical-Mineral Substitution Platforms | +1.4% | North America, Europe, India, Japan and South Korea | Medium term (2 to 4 years) |
| Circular-Materials Optimization | +1.0% | European Union, North America and industrial Asia | Medium term (2 to 4 years) |
| Shared Laboratories for SMEs | +0.8% | Emerging manufacturing clusters and regional innovation hubs | Medium term (2 to 4 years) |
| Edge AI Process Control | +0.7% | Global metals, chemicals, semiconductor and battery plants | Long term (4 years or more) |
| Adjacent Low-Carbon Materials | +0.6% | Global construction, biomaterials and packaging sectors | Long term (4 years or more) |
Outcome-Based Discovery Licensing
The untapped white space is not faster candidate screening itself, which is already contributing to baseline adoption, but converting validated discoveries into milestone fees, production royalties and shared intellectual-property economics rather than relying primarily on seats, compute consumption or time-limited pilots.
Experimental materials-science literature reports that self-driving laboratories can accelerate synthesis-structure-property learning by 10-100 times while consuming 100-1,000 times fewer reagents, although constructing a domain-specific system can still require 1-3 years; Berkeley Lab’s A-Lab separately demonstrated 355 experiments in 17 days and more than 2 realized materials per day.
A commercialization scenario calibrated to those productivity benchmarks, NIST’s industrial autonomous-laboratory framework, and the Department of Energy’s objective of compressing materials development from years or decades to months or a few years supports a plausible 25-40% reduction in customer cost per validated lead and an 8-12-percentage-point reduction.
Key Players Analysis
Tier 1 leaders combine computing power with deep R&D budgets. NVIDIA posted record fiscal 2026 revenue of $215.9 billion, up 65%, and its fourth-quarter Data Center revenue hit $62.3 billion. The company spent $18.5 billion on R&D in fiscal 2026. Microsoft spent $32.5 billion on R&D in FY2025, or 12% of its $281.7 billion revenue, and its Intelligent Cloud revenue grew $18.8 billion.
Dassault Systèmes and BASF lead on the software and chemistry side. Dassault Systèmes reported 2025 revenue of €6.24 billion, with 3DEXPERIENCE revenue up 10%. In July 2026, it agreed to buy ArisGlobal for $1.8 billion in cash plus up to $200 million in milestone payments. BASF spent €1,995 million on R&D in 2025. The company earned about €11 billion in sales from products launched in the past five years.
Tier 2 challengers win through niche platforms. Orbital Materials raised a $50 million Series B, lifting total funding to $71 million, with NVIDIA’s NVentures taking part. Arzeda raised a $38 million Series C in 2024 and now leads an NSF consortium worth $7.8 million.
Citrine Informatics, Kebotix, Mat3ra, MaterialsZone, Optibrium, DeepMaterials, and Aionics compete in focused niches such as data platforms, autonomous labs, and battery electrolytes. Citrine won $300,000 in ARPA-E funding, which shows how federal grants back this tier.
Top Key Players in the Market
- Arzeda Corp.
- BASF SE
- Citrine Informatics Inc.
- Dassault Systemes SE
- DeepMaterials LLC
- Kebotix Inc.
- Mat3ra Inc.
- MaterialsZone Ltd.
- Microsoft Corp.
- NVIDIA Corp.
- Optibrium
- Orbital Materials Inc.
Recent Developments
- In February 2025, Citrine Informatics raised $2.6 million from an offering of $6.1 million to grow its AI platform for materials and chemicals R&D.
- In September 2025, Arzeda won an NSF award to lead a $7.8 million consortium with Missouri S&T and Novonesis. The group will build AI-designed enzyme cascades for CO2 to methanol conversion, targeting more than 70% energy efficiency.
- In May 2026, Orbital Materials raised a $50 million Series B led by Plural, with NVentures joining. The round lifts its total funding to $71 million for AI-designed materials used in data centers.
- In July 2026, Dassault Systèmes agreed to buy ArisGlobal for $1.8 billion in cash plus up to $200 million tied to AI revenue milestones, funded fully from cash on its balance sheet.
Report Scope
| Report Features | Description |
|---|---|
| Market Value (2025) | USD 904.5 Million |
| Forecast Revenue (2035) | USD 13,599.3 Million |
| CAGR (2026-2035) | 31.2% |
| Base Year for Estimation | 2025 |
| Historic Period | 2020-2024 |
| Forecast Period | 2026-2035 |
| Report Coverage | Revenue Forecast, Market Dynamics, Competitive Landscape, Recent Developments |
| Segments Covered | By Type (Materials Discovery and Design, Predictive Modeling and Simulation, Process Optimization); By Application (Pharmaceuticals and Biotechnology, Chemicals and Advanced Materials, Electronics and Semiconductors, Energy and Utilities, Others) |
| Regional Analysis | North America – US, Canada; Europe – Germany, France, The UK, Spain, Italy, Rest of Europe; Asia Pacific – China, Japan, South Korea, India, Australia, Singapore, Rest of APAC; Latin America – Brazil, Mexico, Rest of Latin America; Middle East & Africa – GCC, South Africa, Rest of MEA |
| Competitive Landscape | Aionics Inc., Arzeda Corp., BASF SE, Citrine Informatics Inc., Dassault Systèmes SE, DeepMaterials LLC, Kebotix Inc., Mat3ra Inc., MaterialsZone Ltd., Microsoft Corp., NVIDIA Corp., Optibrium, Orbital Materials Inc. |
| Customization Scope | Customization for segments and region/country-level will be provided. Moreover, additional customization can be done based on the requirements. |
| Purchase Options | We have three licenses to opt for: Single User License, Multi-User License (Up to 5 Users), Corporate Use License (Unlimited Users and Printable PDF) |





























