Report Overview
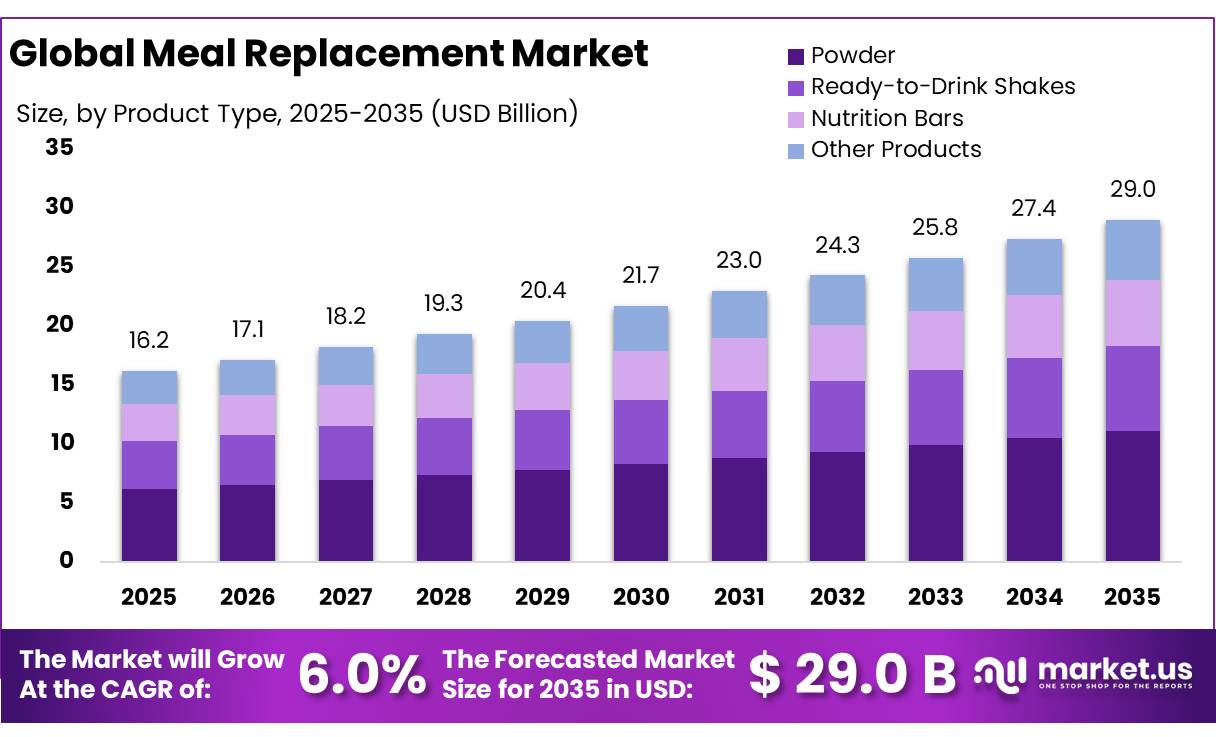
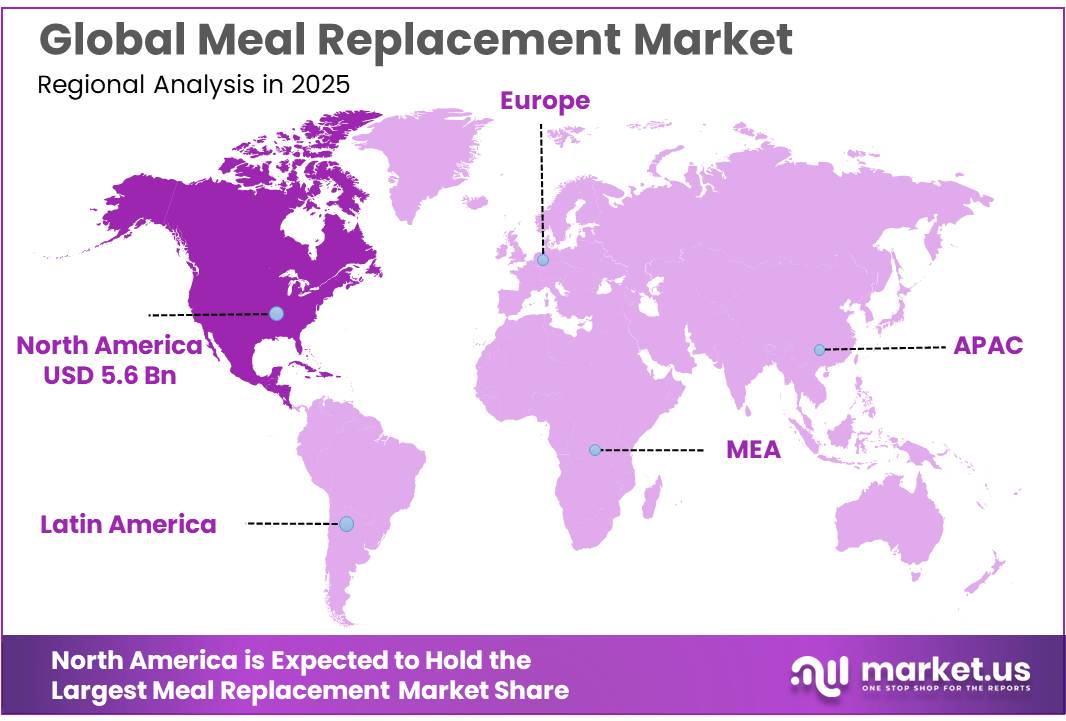
The Global Meal Replacement Market size is expected to be worth around USD 29.0 Billion by 2035, from USD 16.2 Billion in 2025, growing at a CAGR of 6.0% during the forecast period from 2026 to 2035. In 2025, North America held a dominant market position, capturing more than a 35.00% share, holding USD 5.6 Billion revenue.
The meal replacement industry has developed as an important part of the global nutrition and functional food sector. It includes products such as ready-to-drink nutritional shakes, protein powders, nutrition bars, powdered meal mixes and nutritionally balanced beverages designed to replace one or more regular meals. These products are developed to provide a controlled combination of proteins, carbohydrates, fats, dietary fibre, vitamins and minerals.
- The industrial scenario is influenced by changing food consumption habits, rising interest in preventive nutrition and demand for convenient food formats. The United States Department of Agriculture’s Economic Research Service highlights the long-term growth in demand for convenience foods in the United States. Its consumer survey found that average consumption of ready-to-eat foods increased from 1.9 times in 2007–2008 to 2.2 times during 2017–March 2020, measured over the previous 30 days.
Demand is also supported by growing awareness of weight management and nutrition-related health concerns. According to the World Health Organization (WHO), approximately 2.5 billion adults worldwide were overweight in 2022, including 890 million adults living with obesity. This growing health burden has increased interest in structured dietary programmes and products offering measured calorie intake, protein content and essential nutrients. Meal replacement products are increasingly used as part of weight-management plans, fitness routines and busy working lifestyles.
- Government regulations and nutritional standards also influence industrial development. In the European Union, Commission Delegated Regulation (EU) 2017/1798 establishes specific compositional and labelling requirements for total diet replacement products intended for weight control. It specifies 600–1,200 kcal of energy and 75–105 grams of protein per total daily ration, together with minimum requirements for essential vitamins and minerals. These requirements encourage manufacturers to improve formulation accuracy, ingredient selection and quality-control procedures.
Future growth opportunities are expected to emerge from product innovation, plant-based nutrition, personalized dietary solutions and convenient nutritional formats. Manufacturers can expand their portfolios through low-sugar shakes, high-protein meal bars, lactose-free beverages, fibre-enriched powders and products designed for specific nutritional requirements. Investment in advanced food processing, improved packaging and ingredient research can further strengthen production efficiency and product quality. E-commerce platforms, subscription-based nutrition programmes and direct-to-consumer distribution also provide opportunities to increase product accessibility.
Key Takeaways
- Meal Replacement Market size is expected to be worth around USD 29.0 Billion by 2035, from USD 16.2 Billion in 2025, growing at a CAGR of 6.0%.
- Powder held a dominant market position, capturing more than a 38.00% share.
- Liquid held a dominant market position, capturing more than a 40.00% share.
- Supermarkets and Hypermarkets held a dominant market position, capturing more than a 29.00% share.
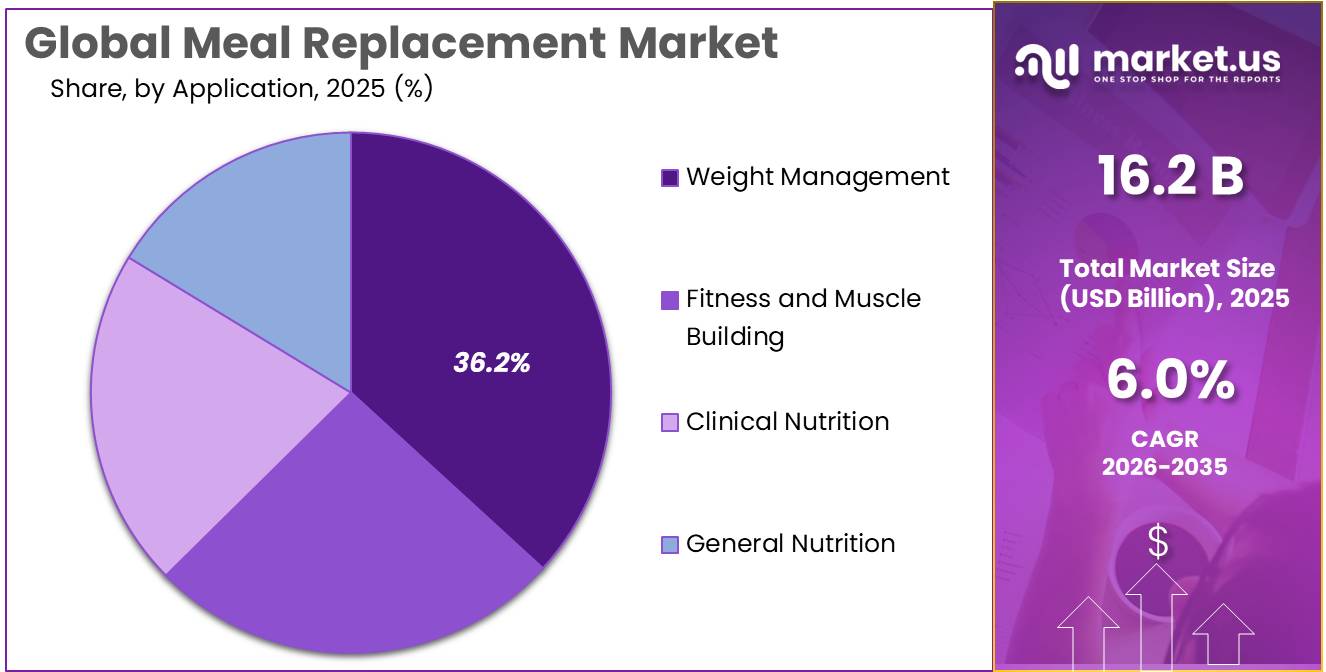
- Weight Management held a dominant market position, capturing more than a 36.00% share.
- Adults held a dominant market position, capturing more than a 37.00% share
- North America held the leading position in the Meal Replacement Market in 2025, accounting for 35.00% of the global market, valued at USD 5.6 billion.
By Product Type Analysis
Powder leads the market through its convenience, longer shelf life and flexibility in preparation.
In 2025, “Powder” held a dominant market position, capturing more than a 38.00% share of the Meal Replacement Market by product type. The segment benefits from its easy storage, convenient transportation and flexible preparation, allowing consumers to mix nutritional powders with water, milk or other beverages. Powder-based meal replacements are widely used by consumers seeking portion control, weight management and convenient daily nutrition. Manufacturers are also focusing on protein-rich formulations, improved flavour and better solubility to strengthen product acceptance.
Ready-to-Drink Shakes represent an important product category in the Meal Replacement Market, supported by demand for convenient nutrition without mixing or preparation. These products are suitable for working professionals, fitness-focused consumers and individuals with busy daily schedules. Their ready-to-consume format makes them attractive for breakfast replacement, between-meal nutrition and post-workout consumption.
According to the USDA Economic Research Service, average consumption of ready-to-eat foods among American adults increased from 1.9 times in 2007–2008 to 2.2 times during 2017–March 2020, showing increased consumer acceptance of convenient food formats. This trend provides supporting evidence for the convenience-driven demand behind ready-to-drink nutritional products, although the USDA figures do not specifically measure meal replacement shakes.
By Form Analysis
Liquid products lead through easy consumption, quick preparation and suitability for busy lifestyles.
In 2025, “Liquid” held a dominant market position, capturing more than a 40.00% share of the Meal Replacement Market by form. The segment benefits from its ready-to-consume format, making it convenient for consumers who require quick nutritional intake without additional preparation. Liquid meal replacements are commonly available as nutritional shakes and fortified beverages, offering a practical combination of proteins, carbohydrates, fats, vitamins and minerals.
Their portability and ease of consumption support demand among working professionals, fitness-focused consumers and individuals following weight-management programmes. In 2025, manufacturers continued to focus on improving flavour, nutritional composition and packaging to strengthen product acceptance. The segment is expected to maintain its market importance through convenient formats and the development of high-protein and plant-based liquid formulations.
Solid meal replacement products include nutrition bars, fortified food bars and other compact food formats designed to provide essential nutrients in a convenient serving. The segment benefits from easy transportation, simple storage and suitability for consumers who prefer solid foods over beverages. In 2025, demand was supported by interest in protein-enriched bars, fibre-based formulations and products designed for weight management and fitness nutrition.
Manufacturers are focusing on improving taste, texture and nutritional value while introducing plant-based ingredients and reduced-sugar options. Solid formats also provide opportunities for product innovation through different flavours, ingredient combinations and convenient individual packaging. These developments are expected to support the segment during 2026 as consumers continue to seek practical alternatives to conventional meals.
By Distribution Channel Analysis
Supermarkets and hypermarkets dominate through wide product availability, brand variety and convenient in-store shopping.
In 2025, “Supermarkets and Hypermarkets” held a dominant market position, capturing more than a 29.00% share of the Meal Replacement Market by distribution channel. The segment benefits from its extensive retail networks, allowing consumers to compare different meal replacement products, nutritional compositions, flavours and prices in one place. These stores provide manufacturers with strong product visibility through dedicated nutrition shelves, promotional displays and discounts.
In 2025, demand was supported by the availability of protein powders, nutritional shakes, meal replacement bars and other packaged nutrition products through established retail outlets. Consumers also benefit from the opportunity to check product labels and packaging before purchasing. The channel is expected to remain important in 2026 as retailers expand their health and wellness product selections and manufacturers strengthen their supermarket distribution partnerships.
Government statistics supporting the retail distribution landscape: According to the USDA Economic Research Service, grocery stores accounted for 56.2% of US food-at-home sales in 2025, while convenience stores contributed 1.2%. These figures demonstrate the importance of grocery retailing and the smaller but established role of convenience outlets in food distribution. These statistics cover general food retailing rather than meal replacement sales specifically.
By Application Analysis
Weight Management leads through rising demand for portion-controlled nutrition and convenient dietary solutions.
In 2025, “Weight Management” held a dominant market position, capturing more than a 36.00% share of the Meal Replacement Market by application. The segment benefits from increasing consumer interest in controlled calorie intake, balanced nutrition and convenient dietary planning. Meal replacement products are widely used as part of structured weight-management programmes because they offer measured portions and a consistent nutritional composition.
In 2025, manufacturers focused on developing low-sugar, high-protein and fibre-enriched formulations to meet changing consumer preferences. The segment is expected to maintain its importance in 2026 as consumers continue to seek practical nutrition options that support their dietary and weight-management goals.
Fitness and Muscle Building represent an important application segment of the Meal Replacement Market, supported by growing interest in physical fitness, muscle recovery and protein consumption. Consumers increasingly use meal replacement shakes, protein-enriched powders and nutritional bars to complement their daily food intake and exercise routines. In 2025, manufacturers focused on products containing whey protein, plant-based proteins, essential amino acids and other nutrients to serve fitness-oriented consumers.
Ready-to-drink shakes and easily prepared powders are particularly suitable for individuals seeking convenient nutrition before or after physical activity. During 2026, opportunities are expected to come from improved protein formulations, plant-based alternatives, reduced-sugar products and specialised sports nutrition offerings.
By End User Analysis
Adults dominate through greater demand for convenient nutrition, weight management and balanced daily diets.
In 2025, “Adults” held a dominant market position, capturing more than a 37.00% share of the Meal Replacement Market by end user. The segment benefits from increasing demand for convenient food products among working professionals, fitness-conscious consumers and individuals managing their daily nutritional intake. Adults commonly use meal replacement powders, ready-to-drink shakes and nutrition bars as practical alternatives when regular meals are difficult to manage.
In 2025, demand was supported by growing interest in portion control, protein intake and weight-management programmes. Manufacturers are focusing on low-sugar formulations, high-protein products and convenient packaging to meet adult nutritional preferences. The segment is expected to maintain its leading position in 2026 as demand for easy-to-consume and nutritionally balanced products continues to develop.
Government statistics supporting the dominating Adults segment: According to the World Health Organization, approximately 2.5 billion adults worldwide were overweight in 2022, including 890 million adults living with obesity. These figures highlight the importance of adult nutrition and weight-management initiatives, although they do not directly measure meal replacement product consumption.
Key Market Segments
By Product Type
- Powder
- Ready-to-Drink Shakes
- Nutrition Bars
- Other Products
By Form
- Solid
- Liquid
- Powder
By Distribution Channel
- Supermarkets and Hypermarkets
- Convenience Stores
- Pharmacies and Drugstores
- Online Retail
- Specialty Stores
- Other Distribution Channels
By Application
- Weight Management
- Fitness and Muscle Building
- Clinical Nutrition
- General Nutrition
By End User
- Adults
- Teenagers
- Older Adults
Driver Analysis
Obesity-Led Weight Management
Obesity creates the largest structural demand pool, but category growth depends on converting health concerns into repeated meal-replacement purchases rather than simply counting overweight consumers. WHO’s October 2026 update estimates that 2.6 billion adults were overweight in 2024, including 940 million living with obesity; these represent 45% and 16% of adults, respectively, while adult overweight prevalence increased from 25% in 1990 to 45% in 2024. These figures establish the addressable health need, not a commercially reachable customer base.
Meal replacements can monetize that need through defined portions and repeatable nutritional specifications: the European weight-control claims framework specifies 200–250 kcal per qualifying replacement meal, with replacing two main meals supporting the permitted weight-loss claim and replacing one supporting weight maintenance after weight loss.
The strategic opportunity is therefore a progression from initial weight-loss purchases into maintenance replenishment, with value captured through adherence, taste and repeat purchase rather than unsupported efficacy claims. The modeled +1.0 pp contribution assumes 40% demand exposure gains an additional 2.5 pp of annual growth; uptake beyond established US and European channels remains conditional on local affordability, dietary preferences and distribution.
Drivers Impact Analysis
| Driver | (~) % Impact on CAGR Forecast | Geographic Relevance | Impact Timeline |
|---|---|---|---|
| Obesity-led weight management | +1.0 pp | US, UK, EU; urban China, India, Brazil | Medium term (2–4 years) |
| GLP-1 nutrition support | +0.7 pp | US core; UK, Germany | Short term (≤ 2 years) |
| Clinically funded diet replacement | +0.5 pp | England core; wider UK/EU potential | Medium term (2–4 years) |
| Affordable powder-led meals | +0.7 pp | US, UK, EU; urban India/Brazil potential | Short term (≤ 2 years) |
| Omnichannel convenience | +0.8 pp | US, UK, Germany; wider EU | Short term (≤ 2 years) |
| Claims-led product differentiation | +0.3 pp | US, EU | Medium term (2–4 years) |
Restraint Analysis
Price–Value Friction
The core affordability restraint is the difference between competing with purchased convenience food and competing with a household’s existing grocery basket: US food-at-home prices increased 2.4% during 2025, versus 4.1% for food away from home, making the reference meal important when assessing value rather than assuming all food inflation benefits replacements. Manufacturer listings illustrate the category’s wide price ladder: Huel advertises powder from approximately $2.21 per 400-kcal meal and Black Edition ready-to-drink from approximately $4.83 per bottle, although starting prices depend on purchasing conditions and are not category-wide averages.
At those reference prices, replacing one meal on 22 working days implies approximately $49 versus $106 monthly expenditure—a roughly $58 gap that can encourage format switching rather than incremental category spending. In an illustrative demand stress test, a 5% price increase combined with a −1.2 own-price elasticity produces approximately 6% lower volume and 1.3% lower revenue after the price increase; neither elasticity nor outcome is an observed market estimate.
The strategic consequence is a constrained ability to pass through costs without increasing promotions, encouraging downtrading or sacrificing purchase frequency, particularly where imported products target price-sensitive urban households. The modeled −0.7 pp contribution assumes 35% of revenue experiences a 2.0 pp annual growth shortfall; lower-priced powders can mitigate this restraint, but their affordability should not be confused with universal superiority to locally prepared meals.
Restraint Impact Analysis
| Restraint | (~) % Impact on CAGR Forecast | Geographic Relevance | Impact Timeline |
|---|---|---|---|
| Price–value friction | −0.7 pp | US, UK, EU; urban India/Brazil | Short term (≤ 2 years) |
| Protein supply costs | −0.6 pp | US, EU; dairy-importing APAC | Short term (≤ 2 years) |
| GLP-1 substitution | −0.5 pp | US core; UK, Germany | Medium term (2–4 years) |
| Claims compliance | −0.4 pp | US, EU | Medium term (2–4 years) |
| Retention economics | −0.5 pp | US, UK, Germany | Medium term (2–4 years) |
| Safety and recall exposure | −0.3 pp | US core; EU institutional channels | Short term (≤ 2 years) |
Opportunity Analysis
Senior Meal Services
The opportunity is a caregiver-purchased, scheduled meal-replacement service for independently living older adults not population ageing itself, nor a relabeling of existing clinical supplements. WHO projects 1.4 billion people aged 60 or above by 2030, approximately one in six globally, compared with 1 billion in 2020; this establishes demographic scale but does not establish willingness to buy meal replacements. The proposed white space is a service combining age-appropriate complete meals, easy-open packaging, scheduled delivery and caregiver replenishment oversight, initially targeting specific underserved cohorts in Japan, Germany, the UK and the US rather than treating every older adult as a customer.
An illustrative programme serving 100,000 subscribers at 15 meals monthly and $3.50 net revenue per meal would generate 18 million annual servings and $63 million product revenue; at an assumed 30% contribution margin after ingredients, packaging and variable fulfilment, annual contribution would reach $18.9 million before acquisition, clinical support and overhead. At $75 acquisition cost, simplified contribution payback would be approximately 4.8 months, conditional on uninterrupted purchasing. These are operating assumptions, not observed senior-channel economics.
Commercial differentiation must come from demonstrably better usability, taste and continuity rather than unsubstantiated disease or muscle-health claims, with professional review for customers whose medical needs make standard products unsuitable. The +0.60 pp upside assumes this service creates new meal-replacement occasions worth 4.0 revenue-index points by 2031; switching existing supplement customers without increasing in-scope consumption would not qualify.
Opportunity Impact Analysis
| Opportunity | (~) % Potential CAGR Upside | Geographic Relevance | Execution Window |
|---|---|---|---|
| Senior meal services | +0.60 pp | Japan, Germany, UK, US | Medium term (2–4 years) |
| Employer meal benefits | +0.53 pp | India, US, UK | Short term (≤ 2 years) |
| Outcome-linked contracts | +0.45 pp | US, UK, Germany | Medium term (2–4 years) |
| Localized savory meals | +0.38 pp | India, Indonesia, Brazil | Medium term (2–4 years) |
| Complete-meal licensing | +0.30 pp | EU, India, Southeast Asia | Medium term (2–4 years) |
| Post-acquisition expansion | +0.23 pp | EU-to-APAC; US-to-LatAm | Medium term (2–4 years) |
Challenges Analysis
Formulation Transfer Across Plants
The structural challenge is reproducing a nutritionally specified product across different mixers, homogenizers, thermal systems and filling lines without changing its safety, consistency or consumer experience; a successful laboratory formula is not automatically a transferable industrial process. FDA’s May 2025 guidance reiterates that applicable shelf-stable low-acid products require establishment registration and scheduled-process filings for each product, product style, container size and type, and processing method; the low-acid classification generally covers products with equilibrium pH above 4.6 and water activity above 0.85, subject to stated exceptions.
FDA inspection guidance also explains that changes in starches, gums and other thickening agents can materially alter heating characteristics, with even a starch adjustment from 1% to 2% potentially affecting thermal performance; this illustrates process sensitivity, not a universal meal-replacement formulation limit. In an analyst-modeled transfer programme, four formulations × two manufacturing sites × three validation batches require 24 batches; at 10,000 litres per batch, 240,000 litres must be produced, sampled and assessed before assuming commercial equivalence.
If one six-batch site–formulation grouping requires repetition, validation volume increases 25%, potentially consuming scarce pilot or production capacity without creating proportional sellable output. The corporate response is a common process-transfer dossier, defined viscosity and dispersion specifications, qualified processing-authority involvement where required, and stage-gated scale-up rather than simultaneous multi-site launches. The −0.45 pp friction estimate applies a 1.5 pp annual growth shortfall to 30% exposure, reflecting slower commercial rollout—not an assumed sales ban or recurring safety failure.
Challenges Impact Analysis
| Challenge | (~) % CAGR Friction Drag | Geographic Relevance | Mitigation Horizon |
|---|---|---|---|
| Formulation Transfer Across Plants | −0.45 pp | US, EU, APAC manufacturing | Medium term (2–4 years) |
| Production Scheduling And Changeovers | −0.35 pp | US, UK, EU | Medium term (2–4 years) |
| Cross-Border Inventory Synchronization | −0.35 pp | EU–Asia; US–Asia corridors | Medium term (2–4 years) |
| Packaging Transition And Validation | −0.30 pp | EU core; exporting APAC | Long term (≥ 4 years) |
| Lot-Level Data Interoperability | −0.25 pp | US core; EU/APAC suppliers | Medium term (2–4 years) |
| Ingredient Substitution And Qualification | −0.30 pp | US, EU, dairy-importing APAC | Medium term (2–4 years) |
Geopolitical Impact Analysis
Geopolitical Impact Analysis: Impact of Ongoing Wars on the Meal Replacement Market
Conflicts in the Middle East and Ukraine are creating cost and supply risks for the Meal Replacement Market. Disruptions around the Strait of Hormuz and the Black Sea are affecting energy flows, grain shipments, fertilizer supplies and shipping schedules. These pressures can raise costs for inputs, including milk and whey ingredients, cereals, vegetable oils, sugar, protein blends and packaging materials. Higher fuel and freight charges increase expenses for processing, refrigeration and distribution, particularly for ready-to-drink shakes.
The World Bank reported in October 2026 that energy prices are projected to rise 32% in 2026, while food commodity prices are expected to increase about 10% in 2026 and a further 7% in 2027. The Food and Agriculture Organization reported that its Food Price Index reached 136.0 points in September 2026, up 5.8% from a year earlier. These figures indicate cost pressure for manufacturers.
For meal replacement producers, instability may squeeze margins, force price revisions and delay launches. Smaller brands may struggle to secure ingredients at prices. Companies can reduce exposure by diversifying suppliers, holding inventory, using alternative protein and grain sources, and improving production efficiency. Firms maintaining reliable sourcing and transparent pricing will be better placed to protect supply and consumer access.
Regional Insights
North America – Dominating Region
North America held the leading position in the Meal Replacement Market in 2025, accounting for 35.00% of the global market, valued at USD 5.6 billion. The region benefits from strong consumer awareness of weight management, fitness nutrition and convenient food products. The United States and Canada have established retail networks, well-developed e-commerce platforms and strong availability of nutritional shakes, protein powders and meal replacement bars.
Demand is further supported by working professionals and consumers seeking portion-controlled food options. According to the US Centers for Disease Control and Prevention (CDC), adult obesity prevalence in the United States reached 33.5% in 2025, highlighting the importance of weight-management and nutritional solutions. This health-related demand supports the regional opportunity for meal replacement manufacturers.
Asia-Pacific presents significant growth opportunities for meal replacement manufacturers, supported by urbanisation, changing food habits and rising interest in convenient nutrition. The region offers opportunities across China, Japan, South Korea, Australia and Southeast Asian markets. Demand is expected to benefit from increasing acceptance of ready-to-drink nutritional beverages, protein powders and functional food products. According to the World Bank, 65% of the East Asia and Pacific population lived in urban areas in 2025.
Key Regions and Countries Insights
- North America
- US
- Canada
- Europe
- Germany
- France
- The UK
- Spain
- Italy
- Rest of Europe
- Asia Pacific
- China
- Japan
- South Korea
- India
- Australia
- Rest of APAC
- Latin America
- Brazil
- Mexico
- Rest of Latin America
- Middle East & Africa
- GCC
- South Africa
- Rest of MEA
Key Players Analysis
Nestlé S.A. maintains a strong position in the meal replacement market through its nutrition, health science, and weight-management product portfolio. Its brands, including OPTIFAST and BOOST, support demand for nutritional drinks, meal replacement shakes, and portion-controlled products. In 2025, Nestlé reported annual sales of approximately CHF 89.5 billion, supported by its global distribution network and established nutrition business.
Herbalife Ltd. is a major participant in the meal replacement market, offering protein shakes, nutritional powders, meal replacement formulas, and weight-management products. Its Formula 1 Nutritional Shake Mix is an important product in its weight-management portfolio. In 2025, the company generated approximately USD 5.04 billion in net sales, compared with USD 4.99 billion in 2024. Herbalife operates across 95 markets, supported by approximately 6.4 million members and nearly 63,000 nutrition clubs, strengthening its consumer reach and distribution network.
Glanbia plc strengthens its position in the meal replacement and nutritional products market through its protein-based nutrition portfolio and brands such as Optimum Nutrition and SlimFast. Its products cater to consumers seeking convenient protein intake, weight management, and balanced nutrition. In 2025, Glanbia recorded approximately USD 3.9 billion in group revenue, while its Performance Nutrition division generated USD 1.80 billion.
Top Key Players Outlook
- Abbott Laboratories
- Nestlé S.A.
- Herbalife Ltd.
- Glanbia plc
- The Simply Good Foods Company (Atkins)
- Amway Corporation
- Huel Ltd.
- Soylent Nutrition, Inc.
- Orgain, Inc.
- Danone S.A.
- Kellanova
- USANA Health Sciences, Inc.
- Medifast, Inc.
- The Hut Group (Myprotein)
- GNC Holdings, LLC
Recent Developments
- In March 2026, Amway reported global sales of USD 7.3 billion for 2025, while its nutrition category accounted for 64% of its product portfolio. The company also operates in more than 100 countries and territories, with over 1 million Amway Business Owners, providing a strong distribution base for its nutrition products.
- In April 2026, Starco Brands reported Soylent’s 2025 segment revenue of USD 21.7 million, compared with USD 36.1 million in 2024, while gross profit reached USD 5.6 million and adjusted earnings before interest, taxes, depreciation, and amortization reached USD 2.4 million, compared with USD 0.36 million in 2024.
Report Scope
| Report Features | Description |
|---|---|
| Market Value (2025) | USD 16.2 Bn |
| Forecast Revenue (2035) | USD 29.0 Bn |
| CAGR (2026-2035) | 6.0% |
| Base Year for Estimation | 2025 |
| Historic Period | 2020-2024 |
| Forecast Period | 2026-2035 |
| Report Coverage | Revenue Forecast, Market Dynamics, Competitive Landscape, Recent Developments |
| Segments Covered | By Product Type (Powder, Ready-to-Drink Shakes, Nutrition Bars, Other Products), By Form (Solid, Liquid, Powder), By Distribution Channel (Supermarkets and Hypermarkets, Convenience Stores, Pharmacies and Drugstores, Online Retail, Specialty Stores, Other Distribution Channels), By Application (Weight Management, Fitness and Muscle Building, Clinical Nutrition, General Nutrition), By End User (Adults, Teenagers, Older Adults) |
| Regional Analysis | North America – US, Canada; Europe – Germany, France, The UK, Spain, Italy, Rest of Europe; Asia Pacific – China, Japan, South Korea, India, Australia, Singapore, Rest of APAC; Latin America – Brazil, Mexico, Rest of Latin America; Middle East & Africa – GCC, South Africa, Rest of MEA |
| Competitive Landscape | Abbott Laboratories, Nestlé S.A., Herbalife Ltd., Glanbia plc, The Simply Good Foods Company (Atkins), Amway Corporation, Huel Ltd., Soylent Nutrition, Inc., Orgain, Inc., Danone S.A., Kellanova, USANA Health Sciences, Inc., Medifast, Inc., The Hut Group (Myprotein), GNC Holdings, LLC |
| Customization Scope | Customization for segments, region/country-level will be provided. Moreover, additional customization can be done based on the requirements. |
| Purchase Options | We have three licenses to opt for: Single User License, Multi-User License (Up to 5 Users), Corporate Use License (Unlimited User and Printable PDF) |