


Report Overview
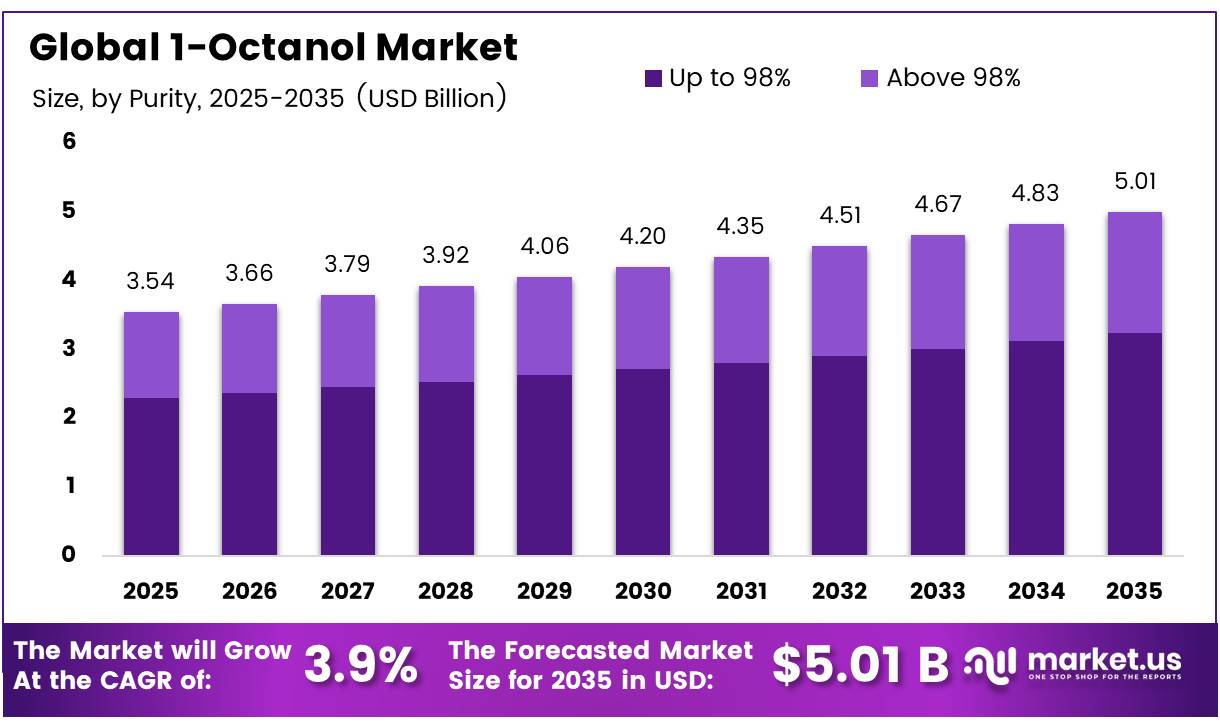
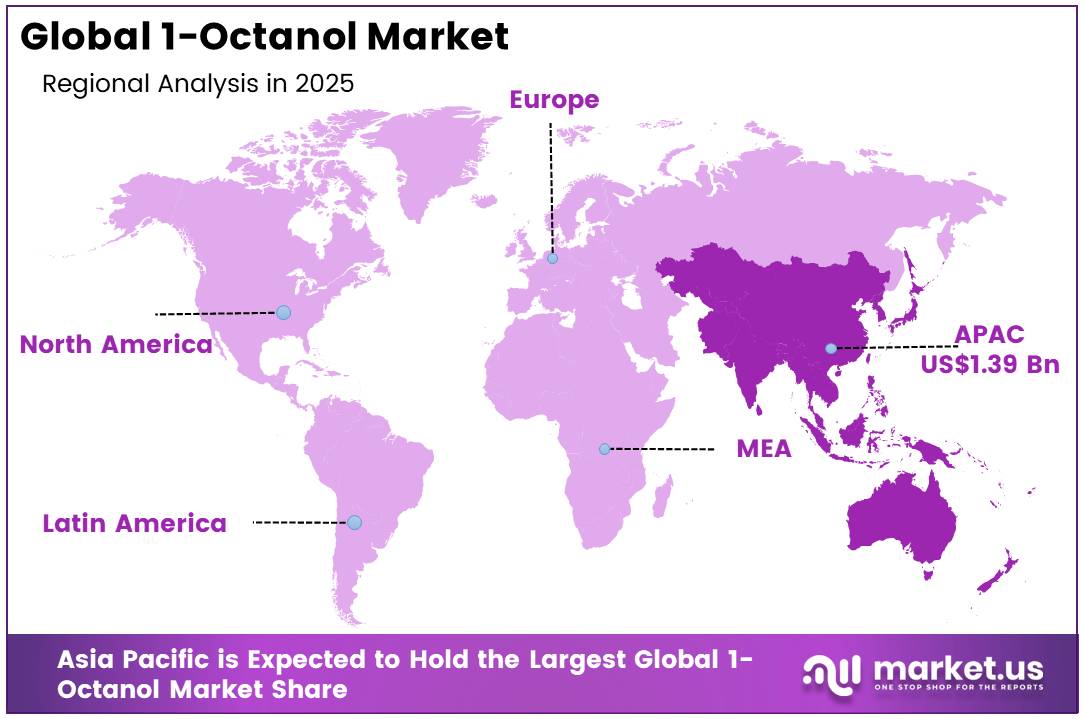
The Global 1-Octanol Market size is expected to be worth around USD 3.54 Billion by 2025, growing at a CAGR of 3.9% during the forecast period from 2026 to 2035, reaching USD 5.01 Billion by 2035. Asia Pacific held a dominant market position, capturing more than a 39.2% share, holding USD 1.39 Billion in revenue.
1-Octanol is a linear C8 fatty alcohol used as a solvent and chemical intermediate in esters, surfactants, plasticizers, lubricants, fragrances and specialty formulations.
- In September 2025, according to the U.S. National Institutes of Health’s PubChem database, the compound had the molecular formula C8H18O and a molecular weight of 130.23 g/mol. Its oil solubility and chemical stability support its use across coatings, personal care, cleaning products and industrial fluids.
Key Takeaways
- The Global 1-Octanol Market size was USD 3.54 Billion in 2025.
- The Global Market is estimated to grow to USD 5.01 Billion by 2035.
- The Compound Annual Growth Rate (CAGR) of the market from 2026 to 2035 will be at 3.9%.
- Up to 98% Purity has the dominating market share of 64.6% in the total purity segment.
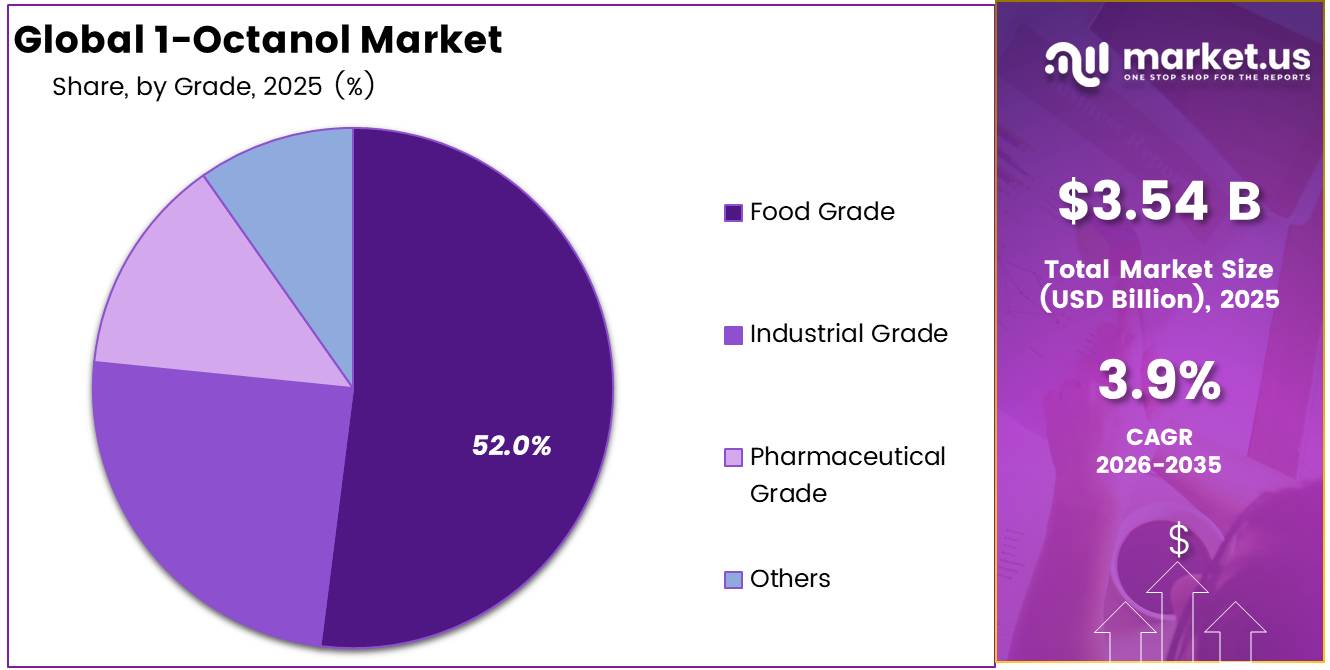
- Food Grade dominated the grade segment, accounting for 52% of the total sales.
- Natural (Bio-based/Oleochemical) has the highest revenue share in the source segment, accounting for 58.5% of the total.
- Food & Beverage has the highest revenue share among end-use industry segments, accounting for 28% of total sales.
- Direct Sales/B2B dominates the distribution channel segment, accounting for 60.5% of total revenue.
- Asia Pacific is the dominant regional market, accounting for 39.2% of worldwide sales.
1-Octanol is a linear C8 fatty alcohol used as a solvent and chemical intermediate in esters, surfactants, plasticizers, lubricants, fragrances and specialty formulations. In September 2025, according to the U.S. National Institutes of Health’s PubChem database, the compound had the molecular formula C8H18O and a molecular weight of 130.23 g/mol. Its oil solubility and chemical stability support its use across coatings, personal care, cleaning products and industrial fluids.
- In March 2026, according to the U.S. Census Bureau, U.S. chemical manufacturing shipments increased by 22.4%, rising from US$735.9 billion in 2017 to US$901.0 billion in 2022. Petrochemical manufacturing shipments reached US$77.6 billion in 2022, indicating a strong downstream environment for alcohol-based intermediates.
Future opportunities are expected in bio-based production and lower-emission processing. In January 2025, according to the U.S. Department of Energy, up to US$23 million was announced for renewable chemicals and fuels produced from biomass and waste. This initiative may support improved catalysts, renewable feedstocks and cleaner 1-octanol manufacturing technologies.
1-Octanol Market Segments
Purity Analysis
Up to 98% Purity represents dominant segment in the market
Food Grade holds the largest share of the 1-Octanol market at 52%. In June 2026, according to the USDA Economic Research Service, U.S. food spending reached $2.51 trillion in 2025, up from an inflation-adjusted $1.56 trillion in 1997. This sustained growth in food spending supports steady demand for FDA-approved food-grade ingredients.
Pharmaceutical Grade is expanding fastest, tracking pharma sector momentum. In January 2026, according to NIH-hosted research (PMC), the FDA approved 44 new drugs in 2025, with biologics accounting for 25% of approvals. In a 2026 report, according to the U.S. Bureau of Labor Statistics, healthcare and social assistance is projected to see the fastest job growth of all 20 sectors, at 8.4% between 2024 and 2034, reinforcing rising demand for pharma-grade inputs.
Grade Analysis
Food Grade a significant grade
Food Grade dominates the 1-Octanol market, holding the largest share at 52%. This aligns with its long-standing regulatory recognition: the FDA lists 1-Octanol as an approved food additive and FEMA GRAS substance, occurring naturally in fruits like apple, apricot, blueberry, and cherry, and it’s widely used in chewing gum, beverages, ice cream, baked goods, and candy. This broad, government-recognized presence across everyday food and beverage products is exactly why this grade continues to lead the market by such a wide margin.
Pharmaceutical Grade is the fastest-expanding segment, riding the momentum of rising drug development activity. As drug formulation, solubility enhancement, and manufacturing scale up to meet this pace of approvals, demand for high-purity, pharmaceutical-grade 1-Octanol as a solvent and excipient is climbing in step, positioning this segment for the strongest relative growth ahead.
Source Analysis
Natural Bio-Based are the most widely utilized source
Natural, bio-based 1-Octanol leads the market by a clear margin, holding 58.50% of total share. This mirrors a broader shift toward renewable chemistry. According to USDA, in March 2024, biobased products contributed $489 billion to the U.S. economy in 2021, up from $464 billion in 2020, a 5.1% increase. This steady federal push toward plant- and marine-derived chemicals explains why oleochemical-based 1-Octanol continues to outpace its synthetic counterpart so decisively.
Synthetic, petroleum-derived 1-Octanol remains the faster-moving segment on the feedstock side. According to the U.S. Energy Information Administration, in a 2026 report, U.S. ethane exports a core petrochemical feedstock used to produce ethylene for plastics grew 19% in 2025, reaching 579,000 barrels per day. Rising global cracker capacity keeps petrochemical-based production expanding briskly, even as it trails the natural segment in overall share.
End-Use Industry Analysis
Food and Beverage held a major share of the market
The Food & Beverage sector dominates the end-user industry vertical, accounting for 28% revenue share, owing to the indispensable role played by 1-Octanol as a naturally occurring flavoring agent in the production of beverages, candy, baked goods, and processed foods with citrus, floral, and fat notes. Due to its GRAS approval and compliance with flavor regulations in the EU, 1-Octanol is an irreplaceable constituent for food companies looking for certified natural flavor agents
Cosmetics and Personal Care is the fastest growing end use application sector, owing to increasing usage of emollients and fragrance fixatives in luxury skin, hair, and personal care products. The other end use applications include Pharmaceutical and Healthcare, Paints and Coatings & Adhesives, Agriculture, Chemical Manufacturing, and Others.
Distribution Channel Analysis
Direct Sales and B2B is the most utilized distribution channel
Distribution by means of Direct Sales/B2B accounts for 60.5% market share due to the bulk buying pattern exhibited by industrial chemical suppliers, flavoring suppliers, cosmetic ingredient suppliers, and API manufacturers, who demand specification-compliant, high-volume shipments within the framework of long-term contracts entered into with oleochemical and petrochemical producers themselves.
Distributors and Traders cater to mid-level and regional purchasers of chemicals who need small quantities and flexibility with deliveries, whereas Online Channels make up the fastest-growing distribution channel, fuelled by the increasing use of online specialty chemical sales for cosmetics and research purposes worldwide.
Key Market Segments
By Purity
- Up to 98%
- Above 98%
By Grade
- Food Grade
- Industrial Grade
- Pharmaceutical Grade
- Others
By Source
- Natural (Bio-based/Oleochemical)
- Synthetic (Petrochemical)
By End-Use Industry
- Food & Beverage
- Cosmetics & Personal Care
- Pharmaceutical & Healthcare
- Paints, Coatings & Adhesives
- Agriculture
- Chemical Manufacturing
- Others
By Distribution Channel
- Direct Sales/B2B
- Distributors & Traders
- Online Platforms
Driver Analysis
Biofuel by-product pull into surfactants and process chemicals
The biofuel complex is increasingly relevant to 1-octanol because renewable diesel, biodiesel, and broader bio-based chemical processing expand the addressable need for co-solvents, defoamers, wetting agents, extraction aids, and downstream specialty intermediates used in plant operations and formulated products.
EPA’s 2023–2025 final RFS rule lifted total renewable fuel obligations from 20.94 billion RINs in 2023 to 22.33 billion in 2025, while the 2025 proposal for 2026–2027 raised the 2026 total to 24.02 billion and the biomass-based diesel obligation to 7.12 billion RINs, up 32.8% from 2025; that scale-up matters because higher throughput in vegetable-oil and waste-lipid processing expands demand for alcohol-based auxiliaries used in cleaning, fractionation, and surfactant synthesis, particularly in North America where plant utilization and feedstock logistics are densest.
The OECD-FAO outlook also indicates that Canada’s biofuel use is projected to grow about 6% annually, while U.S. biomass-based diesel is expected to keep expanding, creating a corridor where oleochemical and oxo-alcohol users can justify longer offtake contracts, improve asset utilization, and shift product mix toward higher-margin specialty grades rather than commodity solvent sales alone.
Drivers Impact Analysis
| Driver | (~) % Impact on CAGR | Geographic Relevance | Impact Timeline |
|---|---|---|---|
| Biofuel by-product pull into surfactants and process chemicals | +1.2% | North America core, Brazil, selected EU blending corridors | Medium term (2-4 years) |
| Domestic-feedstock preference under U.S. RFS rulemaking | +0.9% | U.S. core, Canada spill-over, LatAm export interface | Short term (≤ 2 years) |
| Personal care and fragrance formulation growth via digital retail | +0.8% | North America core, EU, Northeast Asia urban markets | Short term (≤ 2 years) |
| EU chemical compliance and product-notification intensity | +0.7% | EU core, UK alignment spill-over, export-oriented APAC suppliers | Medium term (2-4 years) |
| Trade-flow localization and import substitution in oxo chains | +0.6% | U.S., India, EU coastal hubs, Northeast Asia | Medium term (2-4 years) |
| Industrial solvent and specialty intermediate recovery across chemicals | +0.5% | EU, U.S., China-linked APAC corridors | Short term (≤ 2 years) |
Restraint Analysis
Construction-led demand softness
A meaningful share of octanol-family demand is indirectly tied to coatings, plasticizers, solvents, surfactants, and construction chemicals, so weak building activity transmits quickly into volume restraint, and current public data point to that pressure persisting through the near term: U.S. privately owned housing starts were running at 1.177 million annualized in May 2026, with single-family starts down 1.9% month over month, while total private construction spending in May 2026 was essentially flat month over month at $1.669 trillion annualized.
In practice, this kind of end-market softness typically reduces order visibility for formulators from 90 days toward 30 to 45 days, suppresses distributor restocking, and can knock 4% to 8% off discretionary solvent and specialty-intermediate call-offs relative to a stronger construction cycle; the strategic impact is lower plant utilization, weaker pricing power for non-contracted volumes, and deferred downstream formulation launches, warranting a modeled –1.1 percentage point CAGR reduction for 2026-baselined forecasts.
Restraint Impact Analysis
| Restraint | (~) % Impact on CAGR | Geographic Relevance | Impact Timeline |
|---|---|---|---|
| Feedstock-energy volatility | -1.4% | EU core, North America core, NE Asia | Short term (≤ 2 years) |
| Import-duty and trade friction | -0.9% | India, EU-linked import corridors, Asia export hubs | Medium term (2-4 years) |
| Construction-led demand softness | -1.1% | North America core, EU, China-linked export chains | Short term (≤ 2 years) |
| Environmental handling costs | -0.7% | EU, US, OECD manufacturing clusters | Medium term (2-4 years) |
| Carbon-compliance pass-through | -0.6% | EU trade corridors, export-oriented Asia, Middle East suppliers | Long term (≥ 4 years) |
| Trade concentration risk | -0.8% | India, APAC corridors, import-dependent markets | Medium term (2-4 years) |
Opportunity Analysis
Industrial solvents pivot under VOC rules
Government and safety-data sheets for 1‑octanol report occupational exposure limits around 50 ppm (US WEEL) and indicate that the substance is not classified as a carcinogen by IARC or NTP, is readily biodegradable, and exhibits moderate aquatic toxicity thresholds (LC50 around 13.3 mg/L), creating a regulatory risk profile that is relatively manageable under evolving industrial-emissions regimes compared with more hazardous solvents.
If industrial formulators reallocate just 2–3% of solvent volume in targeted sectors such as waterborne metalworking fluids, printing inks, and specialty coatings toward 1‑octanol blends that meet OECD toxicity and biodegradability guidelines, the incremental TAM could add USD 100–150 million by 2030 with EBITDA margin improvements of 150–250 basis points driven by lower long-term remediation and compliance costs and a 5–10% reduction in insurance premiums for facilities using lower-risk solvents.
Because current 1‑octanol demand in industrial chemicals is mostly tethered to legacy formulations, this pivot would constitute a new application-layer rather than a continuation of existing drivers; its execution in the next 24 months, aligned with near-term VOC and safety-rule updates, could raise realized demand growth from, say, a baseline mid‑single-digit rate to upper‑single-digit outcomes, equating to about +1.2 percentage points of CAGR upside through 2035 if scaled across North American, EU and East Asian industrial clusters.
Opportunity Impact Analysis
| Opportunity | (~) % Potential CAGR Upside | Geographic Relevance | Execution Window |
|---|---|---|---|
| Bio-based 1-octanol via oleochemical policies | +2.0% | EU, Indonesia, Malaysia, APAC emerging | Medium term (2–4 years) |
| Fragrance & cosmetics safety-led expansion | +1.5% | North America, EU, Asia personal care hubs | Medium term (2–4 years) |
| Industrial solvents pivot under VOC rules | +1.2% | North America, EU, East Asia industrial | Short term (≤ 2 years) |
| Specialty plasticizers & lubricants downstream | +1.8% | APAC manufacturing, Middle East, EU | Medium term (2–4 years) |
| Supply-chain traceability & green-premium pricing | +1.0% | EU, UK, North America | Long term (≥ 4 years) |
| M&A roll-up of fragmented octyl alcohol assets | +1.3% | Global (multi-region platforms) | Medium term (2–4 years) |
Challenges Analysis
Energy- and carbon-intense assets
The 1‑octanol itself is not classified as persistent, bioaccumulative and toxic in several regulatory assessments, the broader shift toward low-carbon and resource-efficient operations means that producers with 0.4–0.6 tons of CO₂-equivalent emissions per ton of 1‑octanol must consider investments that could reach 8–12% of annual turnover over a 5–7 year horizon to upgrade boilers, electrify unit operations, and integrate waste heat recovery or renewable power contracts.
Government and multilateral economic outlooks suggest global growth moderating to around 2.9% in 2026, which constrains the ability of downstream customers in coatings, flavors, and specialty surfactants to absorb significant pass-through of decarbonization capex, forcing producers into a staged transition where they prioritize process debottlenecking and 2–3% incremental efficiency gains per year instead of immediate deep retrofits.
This slow capital-recycling cycle produces an estimated 1.0 percentage point drag on the sector’s achievable CAGR because plants operating with older energy systems face 5–10% higher variable costs and increased sensitivity to power and gas price shocks, while carbon-related disclosures and potential extension of emissions pricing to broader chemical portfolios in the EU and some OECD Asian economies could marginalize sub-scale assets lacking clear decarbonization roadmaps.
Challenges Impact Analysis
| Challenge | (~) % CAGR Friction Drag | Geographic Relevance | Mitigation Horizon |
|---|---|---|---|
| Volatile petro-feedstock chains | -1.3% | APAC, EU, North America | Medium term (2-4 years) |
| Energy- and carbon-intense assets | -1.0% | EU regulatory hubs, OECD Asia, North America core | Long term (≥ 4 years) |
| Evolving multi-use regulatory load | -0.8% | US, EU, Japan, high-compliance markets | Medium term (2-4 years) |
| Fragmented specialty capacity footprint | -0.9% | APAC logistics corridors, India, ASEAN | Long term (≥ 4 years) |
| Skilled process-chemistry talent gap | -0.7% | India, China coastal, Eastern Europe | Long term (≥ 4 years) |
| Port, storage and safety bottlenecks | -0.6% | APAC export hubs, Middle East, Latin America | Short term (≤ 2 years) |
Geopolitical Impact Analysis
Geopolitical Realignment and Supply Chain Fragmentation Reshaping 1-Octanol Manufacturing
Trade diplomacy is actively reshaping access to 1-Octanol’s key feedstocks. In October 2025, according to the U.S. Trade Representative, the U.S. and Malaysia reached a reciprocal trade agreement maintaining a 19% tariff on most goods, while palm oil and related products were moved to a zero percent rate under Annex III of Executive Order 14346. Since Malaysia is a major oleochemical source, this realignment directly eases cost pressure on natural, bio-based 1-Octanol supply chains. United States Trade Representative
Petrochemical-linked feedstocks tell a different story. According to the U.S. Energy Information Administration, in a 2026 report, China reduced its U.S. propane receipts by 29% amid reciprocal tariffs on imports from the United States This shift shows how tariff friction is fragmenting synthetic feedstock flows, pushing producers to diversify sourcing and reroute trade toward alternative partners
Regional Analysis
Asia Pacific Leads Global 1-Octanol Market Driven by Strong Production Base and Expanding Industrial Demand
Asia Pacific commands the largest regional share of the 1-Octanol market at 39.20%, reflecting its dominance in chemical manufacturing and oleochemical processing. According to the U.S. Bureau of Economic Analysis, in February 2026, U.S. imports of industrial supplies and materials rose $23.3 billion in 2025, while the trade deficit with China alone reached $202.1 billion, underscoring how deeply industrial chemical trade is tied to the region. This scale of activity keeps Asia Pacific firmly in the lead.
Latin America, though smaller, is emerging as the fastest-growing region. According to the U.S. Census Bureau, in a February 2026 release, the U.S. recorded its highest-ever exports to Mexico at $338.0 billion in 2025. This surge signals expanding industrial and chemical demand across the region, positioning it as the market with the strongest upward momentum.
Key Regions and Countries Covered
- North America
- The US.
- Canada
- Europe
- Germany
- France
- The UK.
- Italy
- Spain
- Russia & CIS
- Rest of Europe
- Asia Pacific
- China
- Japan
- South Korea
- India
- ASEAN
- Rest of Asia Pacific
- Latin America
- Brazil
- Mexico
- Rest of Latin America
- Middle East & Africa
- GCC Countries
- South Africa
- Rest of Middle East & Africa
Key Players Analysis
Competitive strategies adopted by key players in the international 1-Octanol market include vertical integration of sourcing capabilities for oleochemical-based feedstock materials, diversity of grades, and distribution within various regions. Major strategic initiatives that include RSPO sustainability-certified supply chain setup, pharmaceutical-grade production with complete pharmacopoeia documentation, and production capacities for bio-based applications targeted at premium buyers of clean-label product categories from the food, cosmetics, and pharmaceutical industries are pursued continuously by major players.
Institutional pricing premiums are secured via investment in the certification of palm oil sources as sustainable. Capacity enhancement efforts in the Middle East and South East Asia regions ensure that production aligns with the requirements of chemical, flavor house, and personal care ingredient consumers. Registration under REACH regulations, COSMOS standards compliance, and Halal documentation enables the inclusion of products for sale into institutional procurement programs within Europe, North America, and the Middle East, with long-term supply framework agreements until 2035.
The Major Key Players In The Market
- Kao Corporation
- BASF SE
- PTT Global Chemical (PTTGC)
- KLK Oleo (Kuala Lumpur Kepong Berhad)
- Musim Mas Holdings
- Sasol Limited
- Emery Oleochemicals
- P&G Chemicals (Procter & Gamble)
- VVF LLC
- Axxence Aromatic GmbH
- Auro Chemicals
- Huachen Energy Co., Ltd.
- Xiyingmen Oil Chemical Co., Ltd.
- YouYang Industrial Co., Ltd.
- Other Key Players
Key Development
- In January 2026, KLK Oleo received expanded RSPO Mass Balance certification across its Malaysian fatty alcohol production facilities, strengthening its certified sustainable 1-Octanol supply capability for European cosmetics and personal care institutional buyers requiring documented sustainable sourcing credentials.
- In February 2026, BASF SE expanded its bio-based 1-Octanol procurement framework through new long-term supply agreements with RSPO-certified Southeast Asian oleochemical manufacturers, supporting increased bio-based feedstock utilization across its European care chemical and plasticizer ingredient product lines.
- In March 2026, Emery Oleochemicals introduced new high-purity 1-Octanol grades meeting USP and EP pharmacopoeial standards, targeting growing pharmaceutical institutional demand from API manufacturers in India, Europe, and North America requiring documented purity certification for solvent and synthesis applications.
Report Scope
| Report Features | Description |
|---|---|
| Market Value (2025) | USD 3.54 Billion |
| Forecast Revenue (2035) | USD 5.01 Billion |
| CAGR (2026-2035) | 3.9% |
| Base Year for Estimation | 2025 |
| Historic Period | 2020-2024 |
| Forecast Period | 2026-2035 |
| Report Coverage | Revenue Forecast, Market Dynamics, Competitive Landscape, Recent Developments |
| Segments Covered | By Purity (Up to 98%, Above 98%), By Grade (Food Grade, Industrial Grade, Pharmaceutical Grade, Others), By Source (Natural / Bio-based, Synthetic / Petrochemical), By End-Use Industry (Food & Beverage, Cosmetics & Personal Care, Pharmaceutical & Healthcare, Paints & Coatings, Agriculture, Chemical Manufacturing, Others), By Distribution Channel (Direct Sales / B2B, Distributors & Traders, Online Platforms) |
| Regional Analysis | North America – The US & Canada; Europe – Germany, France, The UK, Spain, Italy, Russia & CIS, Rest of Europe; APAC – China, Japan, South Korea, India, ASEAN & Rest of APAC; Latin America – Brazil, Mexico & Rest of Latin America; Middle East & Africa – GCC, South Africa & Rest of MEA |
| Competitive Landscape | Kao Corporation, BASF SE, PTT Global Chemical (PTTGC), KLK Oleo (Kuala Lumpur Kepong Berhad), Musim Mas Holdings, Sasol Limited, Emery Oleochemicals, P&G Chemicals (Procter & Gamble), VVF LLC, Axxence Aromatic GmbH, Auro Chemicals, Huachen Energy Co., Ltd., Xiyingmen Oil Chemical Co., Ltd., YouYang Industrial Co., Ltd., Other Key Players |
| Customization Scope | Customization for segments, region/country-level will be provided. Moreover, additional customization can be done based on the requirements. |
| Purchase Options | We have three licenses to opt for: Single User License, Multi-User License (Up to 5 Users), Corporate Use License (Unlimited Users and Printable PDF) |





































