


Report Overview
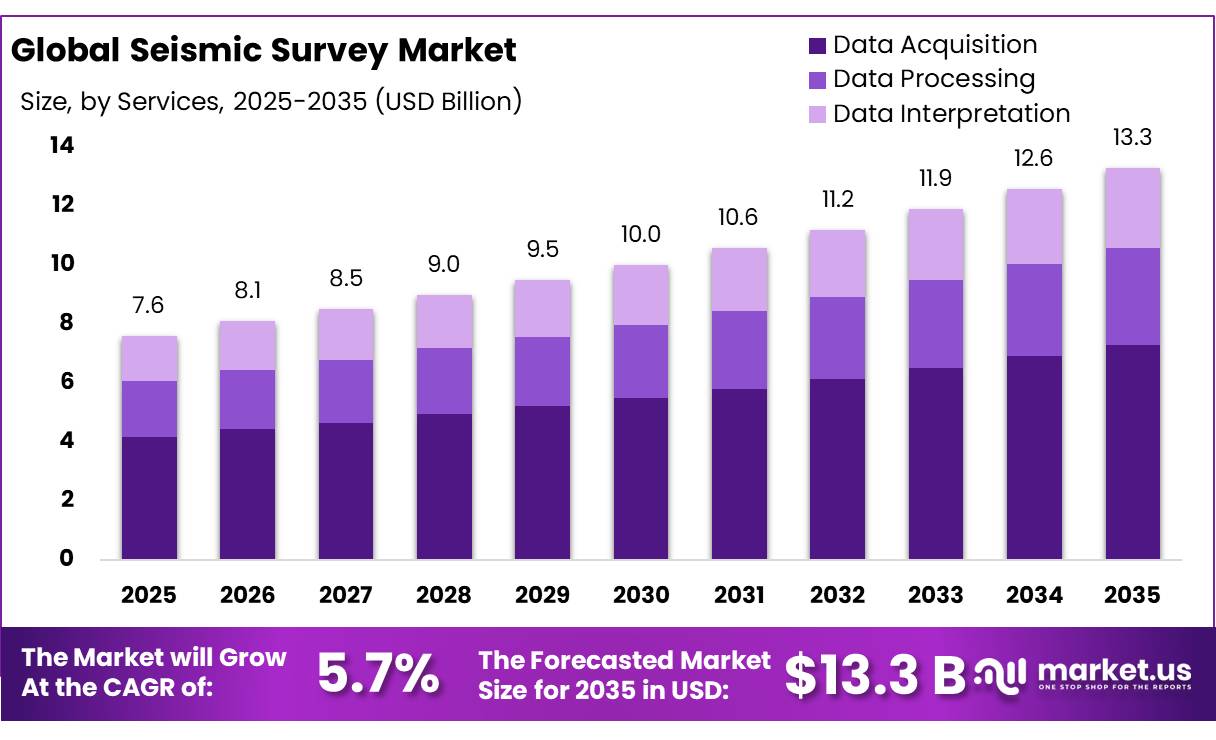
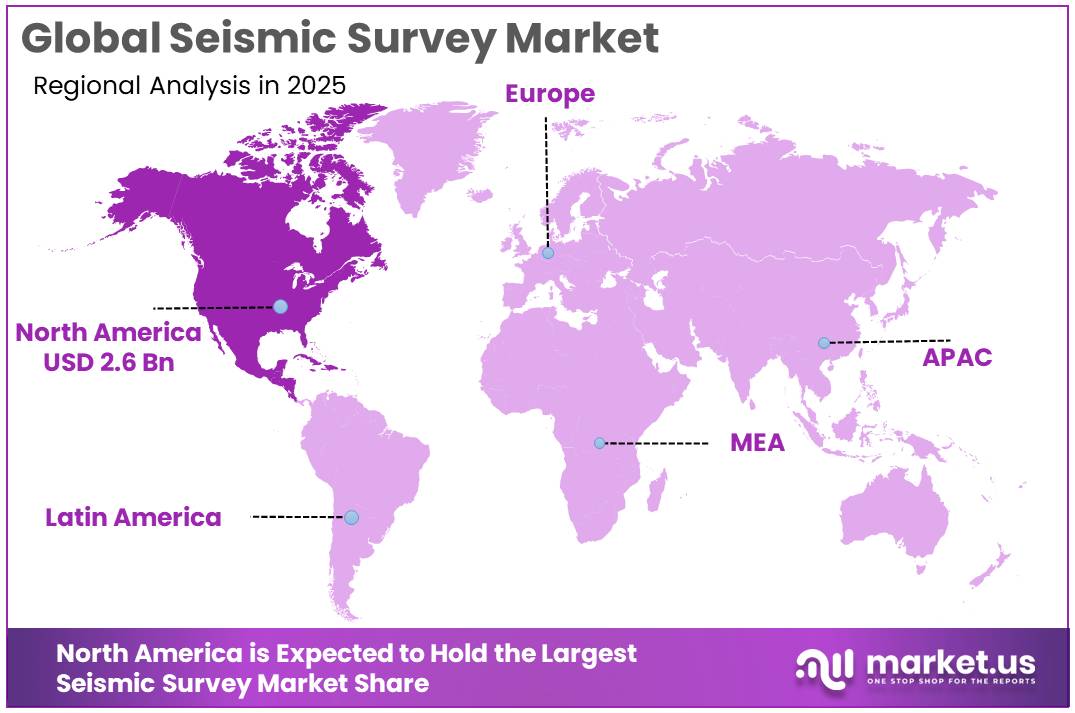
The Global Seismic Survey Market size is expected to be worth around USD 13.3 Billion by 2035, from USD 7.6 Billion in 2025, growing at a CAGR of 5.7% during the forecast period from 2026 to 2035. In 2025, North America held a dominant market position, capturing more than a 35.21% share, holding USD 2.6 Billion revenue.
Seismic surveys are an important part of the global energy and geophysical exploration industry. They use controlled sound waves, sensors, and advanced data-processing systems to identify underground rock formations, geological structures, and potential oil and natural gas deposits. The technology is widely used in offshore and onshore exploration, reservoir development, geological hazard assessment, and selected mineral and carbon storage projects.
The industrial scenario is increasingly shaped by high-resolution imaging, digital processing, offshore exploration, and demand for reliable subsurface information. The United States Geological Survey and the Bureau of Ocean Energy Management (BOEM) jointly support access to historical marine seismic information through the National Archive of Marine Seismic Surveys.
- In January 2024, the USGS reported that the archive provided access to more than 1,100 marine seismic datasets, including 2D and 3D survey information within the United States Exclusive Economic Zone. These resources support geological research and the assessment of offshore mineral and sediment resources, while demonstrating the long-term value of seismic data beyond their original exploration purpose.
Driving factors include the need to improve exploration accuracy, maintain energy security, extend the productive life of existing oil and gas fields, and identify suitable geological formations for emerging energy projects. The International Energy Agency (IEA), in its Oil 2025 outlook, projected that global oil demand would increase by 2.5 million barrels per day between 2024 and 2030, reaching approximately 105.5 million barrels per day by the end of the decade.
However, global oil production capacity is projected to increase by 5.1 million barrels per day to 114.7 million barrels per day over the same period. These changing supply and demand conditions may encourage producers to prioritize cost-effective exploration, improve existing reservoir performance, and use seismic imaging to support investment decisions.
Future growth opportunities extend beyond conventional hydrocarbon exploration into carbon capture and storage, geothermal energy, offshore mineral assessment, and geological risk monitoring. The US Bureau of Ocean Energy Management (BOEM) is assessing offshore carbon storage potential using existing geological and geophysical information across 26 planning areas of the continental and Alaskan Outer Continental Shelf. This creates opportunities for seismic survey contractors, geophysical equipment providers, and data-processing specialists to support subsurface characterization and storage-site assessment.
Key Takeaways
- Seismic Survey Market size is expected to be worth around USD 13.3 Billion by 2035, from USD 7.6 Billion in 2025, growing at a CAGR of 5.7%.
- Data Acquisition held a dominant market position, capturing more than a 54.83% share.
- Geological Exploration held a dominant market position, capturing more than a 46.89% share.
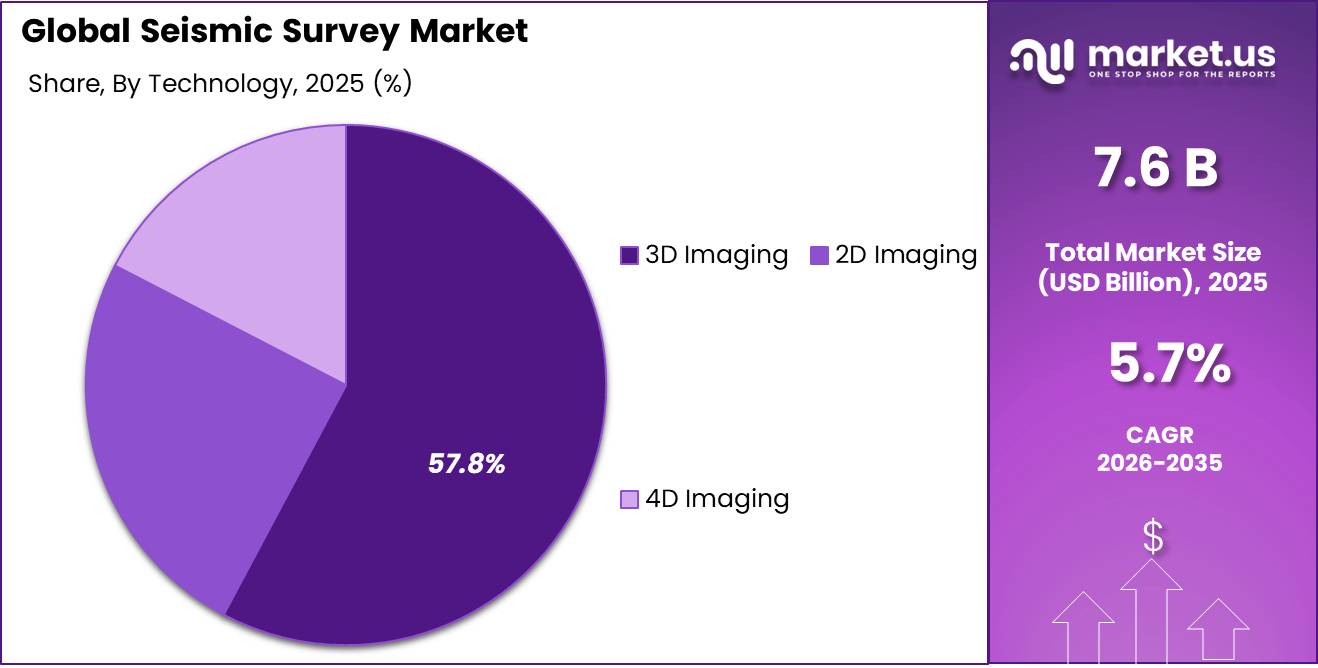
- 3D Imaging held a dominant market position, capturing more than a 57.80% share.
- North America held a dominant market position, accounting for 35.21% of the global seismic survey market, valued at USD 2.6 billion.
By Services Analysis
Seismic Survey Market by Services: Data Acquisition
In 2025, Data Acquisition held a dominant market position, capturing more than a 54.83% share. Data acquisition remains an essential service in seismic surveys because it involves collecting underground geological information through seismic sources, sensors, and field recording systems. Oil and gas companies rely on this service to identify subsurface structures and support exploration and drilling decisions. Offshore and onshore projects require accurate field data to reduce geological uncertainty and improve the quality of subsequent interpretation.
Data Processing supports accurate subsurface interpretation through advanced analysis of collected seismic information. In 2025, data processing remained an important service because exploration companies required reliable images of underground rock formations to evaluate potential drilling locations and reservoir conditions. Processing includes noise removal, signal enhancement, imaging, and the conversion of raw survey records into useful geological information. The US Bureau of Ocean Energy Management (BOEM) reported in March 2026 that it had released 5 three-dimensional (3D) seismic survey datasets from the Beaufort Sea.
By Application Analysis
Geological Exploration leads with a 46.89% share in 2025, supported by the need for accurate subsurface mapping.
In 2025, “Geological Exploration” held a dominant market position, capturing more than a 46.89% share. Seismic surveys support geological exploration by helping operators identify underground rock layers, structural formations, faults, and potential resource deposits. These findings help exploration teams assess geological conditions before committing to drilling or other field activities. The service also supports geological studies beyond conventional energy projects, including the evaluation of underground formations for carbon storage.
Oil and Gas remains a key application for seismic survey services because operators use underground imaging to identify potential hydrocarbon deposits, assess geological structures, and select suitable drilling locations. In 2025, the United States produced a record 13.6 million barrels of crude oil per day, representing a 3% increase compared with 2024, according to the U.S. Energy Information Administration (EIA). The Permian Basin accounted for approximately 48% of total U.S. crude oil production, demonstrating the importance of established producing regions where seismic information can support exploration and reservoir management.
By Technology Analysis
3D Imaging leads with a 57.80% share in 2025, supported by detailed subsurface mapping and improved exploration decisions.
In 2025, “3D Imaging” held a dominant market position, capturing more than a 57.80% share. Three-dimensional imaging enables seismic survey providers to create detailed representations of underground geological formations, helping oil and gas companies identify faults, evaluate reservoir structures, and select potential drilling locations.
Compared with conventional two-dimensional surveys, this technology provides information across a broader subsurface area, supporting more detailed geological interpretation and reducing uncertainty during exploration. It is particularly useful for complex offshore fields and mature reservoirs where accurate imaging can guide development planning.
2D Imaging remains useful for seismic surveys because it provides cross-sectional views of underground formations, helping exploration companies identify geological structures and determine areas that require further investigation. In 2025, the technology continued to serve as a practical option for regional mapping and preliminary exploration, particularly where broad geological coverage is needed without the cost of more detailed 3D imaging.
The U.S. Geological Survey (USGS) and the Bureau of Ocean Energy Management (BOEM) maintain public access to marine seismic records. BOEM reported that, as of July 2023, the National Archive of Marine Seismic Surveys contained 593 2D seismic surveys, covering 34,058 tracklines and approximately 1.67 million line kilometres.
Key Market Segments
By Services
- Data Acquisition
- Data Processing
- Data Interpretation
By Application
- Oil and Gas
- Geological Exploration
- Mining
- Others
By Technology
- 2D Imaging
- 3D Imaging
- 4D Imaging
Driver Analysis
Energy-Security Frontier Exploration
Exploration in frontier basins is now the strongest source of new seismic demand, as the 2026 Gulf supply shock adds urgency to replacing reserves. Contractors’ order books reflect this. TGS reported Q2 2026 orders of $377M, taking its backlog to $756M, up 78% year on year, with streamer utilization of 94%, the highest since Q3 2013. Multi-client revenue rose to $222.5M from $162.1M. Viridien’s Earth Data revenue rose to $76M from $66M on new acquisition in Uruguay, Guyana and Norway, with 12 reprocessing projects under way, many in frontier basins.
It also has government data agreements in Morocco, Senegal and Egypt. New basins are opening. Ibama licensed Petrobras to drill FZA-M-059 on Brazil’s Equatorial Margin on October 20, 2025. In Namibia’s Orange Basin, new 2D and 3D surveys are planned to support farm-outs in 2026. Shearwater’s backlog has risen to $401M and its tender pipeline is improving into 2027. The business model is shifting toward multi-client libraries co-funded with host governments and reprocessed with FWI and AI. We estimate a well-placed frontier 3D library earns back 1.8 to 2.5 times its cost over 5 to 8 years, while contract vessel dayrates rise 10% to 15% as streamer capacity tightens.
Drivers Impact Analysis
| Driver | (~) % Impact on CAGR Forecast | Geographic Relevance | Impact Timeline |
|---|---|---|---|
| Energy-Security Frontier Exploration | +1.2% | Atlantic margins, NW Africa, Norway | Medium term (2-4 years) |
| Mandated U.S. Gulf Lease Sales | +1.0% | North America core (U.S. Gulf) | Short term (≤ 2 years) |
| OBN and 4D Reservoir Monitoring | +1.0% | Brazil, North Sea, U.S. Gulf | Medium term (2-4 years) |
| NOC Mega-Survey Programs | +0.9% | UAE, Saudi Arabia, Red Sea | Medium term (2-4 years) |
| CCS Plume Monitoring Mandates | +0.6% | U.S., Norway, UK, EU | Long term (≥ 4 years) |
| India State Seismic Incentives | +0.5% | India onshore basins | Short term (≤ 2 years) |
Restraint Analysis
Weak Contract Acquisition Economics
Multi-client order books are strong, but day-to-day contract acquisition remains unprofitable for many vessel owners. That limits fleet investment and pricing power. Shearwater reported Q2 2026 revenue of $148.7M but EBITDA of only $22.6M, a margin of about 15%, citing a continued slow marine contract acquisition market. Fleet utilization was 76% across 7.7 active vessels, and the company needed a $40M equity injection, a vessel sale and bank facility amendments to strengthen liquidity.
TGS’s CEO said industry streamer capacity fell by almost 50% between 2019 and 2025 and is expected to be only slightly up in 2026. TGS also expects Q3 2026 multi-client investment of about $63M, down from $85.9M a year earlier. Upstream oil spending is falling for a third straight year (Reuters). We estimate contract 3D streamer pricing is still 15% to 25% below the level needed to fund new vessels. No newbuild streamer vessel is likely before 2028, and owners keep 20% to 30% of capacity idle between tenders. That caps volume growth even in a stronger demand cycle.
Restraint Impact Analysis
| Restraint | (~) % Impact on CAGR Forecast | Geographic Relevance | Impact Timeline |
|---|---|---|---|
| Weak Contract Acquisition Economics | -1.0% | Global marine, North Sea, West Africa | Short term (≤ 2 years) |
| Gulf War Maritime Disruption | -0.8% | Arabian Gulf, Red Sea, Indian Ocean | Short term (≤ 2 years) |
| Marine Mammal Permitting Limits | -0.8% | U.S. Gulf, Norway, EU waters | Medium term (2-4 years) |
| Litigation and Licensing Delays | -0.6% | South Africa, Brazil, Atlantic margins | Long term (≥ 4 years) |
| Exploration Policy Exits | -0.5% | UK, Colombia, parts of EU | Long term (≥ 4 years) |
| Reprocessing Cannibalizing Acquisition | -0.5% | Mature basins: North Sea, U.S. Gulf, SE Asia | Medium term (2-4 years) |
Opportunity Analysis
AI Foundation Model Licensing
This is a new way to earn revenue, separate from the baseline multi-client sales. Seismic libraries can be licensed as training data and used to deliver interpretation as a subscription, so existing data earns again without new acquisition. TGS won a multi-year contract from an international oil company to deliver its Seismic Foundation Model for structural and stratigraphic interpretation. It also formed a joint R&D partnership with Chevron on elastic FWI and machine-learning workflows. Viridien launched Evergreen Data Solution, an AI platform that automates transformation of fragmented subsurface data.
TGS also secured data brokerage and licensing rights from Brunei’s Petroleum Authority, a model that can be repeated with other national data repositories. We estimate that if a library of 500,000-plus km² of 3D data earns 3% to 5% of its book value a year from AI subscriptions and model-access fees, that adds $50M to $120M of recurring revenue per major data owner. Gross margins would be above 70%, against 30% to 40% for contract acquisition. Customer acquisition costs also fall, because existing late-sale clients can be moved onto subscriptions.
Opportunity Impact Analysis
| Opportunity | (~) % Potential CAGR | Geographic Relevance | Execution Window |
|---|---|---|---|
| AI Foundation Model Licensing | +0.7% | Global, IOC hubs, SE Asia | Short term (≤ 2 years) |
| Hard-Rock Critical Minerals Seismic | +0.7% | Australia, Africa copper belts, U.S. | Medium term (2-4 years) |
| Urban Geothermal 3D Surveys | +0.6% | Germany, Netherlands, France, U.S. West | Medium term (2-4 years) |
| Marine Vibrator Access Unlock | +0.5% | Norway, U.S. Gulf, Atlantic margins | Medium term (2-4 years) |
| Colombia Basin Reopening | +0.4% | Colombia, Andean spill-over | Short term (≤ 2 years) |
| Offshore Wind UHR3D Characterization | +0.4% | North Sea, UK, Norway, APAC wind | Long term (≥ 4 years) |
Challenges Analysis
Geophysicist Talent Pipeline Erosion
Seismic acquisition, processing and interpretation depend on a small, ageing pool of geophysicists, and fewer students are entering the field. The BLS counts about 25,100 geoscientist jobs with roughly 2,000 openings a year, and projects 3% growth to 2034 (Geology Programs, from BLS; Wagedex). The American Geosciences Institute projects total geoscience employment rising only 3.7%, from 461,152 to 478,091. The Canadian Society of Exploration Geophysicists reports declining enrollment in North American and European geophysics programs, geoscience being removed from school curricula, and university programs shifting away from petroleum and mineral exploration.
SEG Council has set up a committee to address the decline. Demand is moving toward FWI, OBN and AI skills, which need 5 to 8 years of experience. We estimate a 10% to 15% shortfall in senior processing geophysicists lengthens project turnaround by 4 to 8 weeks and raises senior pay by 6% to 9% a year. Contractors will need to move work to processing centers in India and Asia, where enrollment is holding up, automate routine work with AI, and build cross-training programs with data science graduates.
Challenges Impact Analysis
| Challenge | (~) % CAGR Friction | Geographic Relevance | Mitigation Horizon |
|---|---|---|---|
| Geophysicist Talent Pipeline Erosion | -0.7% | North America, Europe | Long term (≥ 4 years) |
| Aging Streamer Fleet Renewal | -0.7% | Global marine, North Sea, Atlantic | Long term (≥ 4 years) |
| GPU Compute Cost Competition | -0.6% | U.S., Europe processing hubs | Medium term (2-4 years) |
| GNSS Jamming and Spoofing | -0.5% | Baltic, Black Sea, Gulf, East Asia | Medium term (2-4 years) |
| Node and Equipment Supply Concentration | -0.5% | Global land, China-linked supply | Medium term (2-4 years) |
| Crew Security and Cyber Exposure | -0.5% | Nigeria, Colombia, global IT | Long term (≥ 4 years) |
Geopolitical Impact Analysis
Geopolitical Impact of the Ongoing Middle East War on the Seismic Survey Market
The ongoing Middle East conflict in 2026 is affecting the seismic survey market through oil price volatility, shipping risks, and uncertainty in exploration budgets. Attacks on energy infrastructure and commercial vessels have disrupted supply routes, increasing transportation costs and creating uncertainty for offshore survey operations. According to the U.S. Energy Information Administration (EIA), Brent crude oil spot prices averaged US$114 per barrel in September 2026, rising US$23 per barrel from August as attacks on oil infrastructure and tankers intensified.
EIA, October 2026 Higher oil prices may encourage producers to invest in exploration to strengthen future supply, potentially supporting demand for seismic data acquisition and processing. However, higher vessel insurance premiums, fuel costs, equipment transport expenses, and security requirements can increase survey project costs and delay offshore work in high-risk areas. The conflict may also redirect exploration investment toward regions considered safer and more commercially attractive. Meanwhile, continued uncertainty in the Russia-Ukraine war adds further pressure to energy supply planning. Energy security concerns may support long-term exploration, while operational risks and rising costs can restrict short-term seismic survey activity.
Regional Insights
North America: Dominant Regional Market
In 2025, North America held a dominant market position, accounting for 35.21% of the global seismic survey market, valued at USD 2.6 billion. The region benefits from established oil and gas exploration activities, offshore resource development, advanced geophysical technology, and demand for detailed subsurface information. The United States remains a major contributor due to its extensive shale operations and offshore energy projects.
According to the U.S. Energy Information Administration (EIA), U.S. crude oil production reached a record 13.6 million barrels per day in 2025, increasing 3% from 2024. The Permian Basin accounted for approximately 48% of national crude oil production, supporting continued demand for geological assessment and reservoir imaging. In addition, the Bureau of Ocean Energy Management (BOEM) reported that its National Archive of Marine Seismic Surveys contained 550 3D surveys and 593 2D surveys as of July 2023. These resources support exploration planning and geological analysis across offshore areas.
The fastest-growing region cannot be identified reliably from the supplied data because regional growth rates and comparable forecasts were not provided. However, offshore exploration, improved seismic imaging, and demand for subsurface data may create opportunities across several regions. The U.S. National Oceanic and Atmospheric Administration reported in March 2026 that ocean and coastal mapping projects added 70,700 square nautical miles of new bathymetric coverage during 2025.
Key Regions and Countries Insights
- North America
- US
- Canada
- Europe
- Germany
- France
- The UK
- Spain
- Italy
- Rest of Europe
- Asia Pacific
- China
- Japan
- South Korea
- India
- Australia
- Rest of APAC
- Latin America
- Brazil
- Mexico
- Rest of Latin America
- Middle East & Africa
- GCC
- South Africa
- Rest of MEA
Key Players Analysis
Polarcus Limited was a marine geophysical services provider specializing in seismic data acquisition for offshore oil and gas exploration. Its fleet included high-performance vessels equipped for 3D and 4D seismic surveys, supporting detailed subsurface imaging. The company also offered cloud-based data access and processing solutions. However, its operations faced serious financial difficulties, and lenders withdrew support for continued vessel operations in 2021, initiating a vessel sale process.
Fugro N.V. is a Netherlands-based geodata company providing geophysical surveys, seabed mapping, and subsurface investigation services for energy and infrastructure projects. In 2025, the company reported revenue of EUR 1,848.1 million, compared with EUR 2,275.4 million in 2024, reflecting a 16.1% decline on a currency-comparable basis. Fugro employed 10,227 people at year-end 2025 and operated across 52 countries. Its survey capabilities support offshore oil and gas exploration, wind farm development, and marine infrastructure planning.
CGG, which operates under the Viridien name, provides geoscience, seismic imaging, earth data, and high-performance computing services. In 2025, Viridien reported total segment revenue of USD 1.165 billion, an increase of 4% year on year. Its geoscience business generated USD 444 million, up 10%, while Earth Data revenue reached USD 406 million, increasing 6%. The company also reported segment adjusted EBITDA of USD 551 million, representing a 47% margin. Its seismic data and computing capabilities support subsurface imaging and exploration analysis for energy clients.
Top Key Players Outlook
- Polarcus Limited
- Fugro N.V.
- Compagnie Generale de Geophysique (CGG)
- Schlumberger Limited-Western Geco
- Fugro N.V.
- Petroleum GeoServices
- (TGS)-Norwegian Petroleum Exploration Consultants
- Seabird Exploration PLC
- Tomlinson Geophysical Services Inc.
- Ion Geophysical Corporation
- Other Key Players
Recent Developments
- In January 2026, SLB reported full-year 2025 revenue of USD 35.71 billion, down 2% year on year (SLB financial results). In September 2026, SLB and Shearwater GeoServices launched the Amapá 3D multiclient seismic survey offshore Brazil. Shearwater is responsible for data acquisition using its Isometrix® technology aboard the Amazon Warrior, while SLB handles advanced processing and imaging, including elastic full-waveform inversion.
- In February 2026, Fugro reported full-year revenue of EUR 1,848.1 million for 2025, with capital expenditure of EUR 248 million and a 12-month backlog of EUR 1,395.9 million. In April 2026, its Fugro GeoAI Framework received an Offshore Technology Conference award for using artificial intelligence to accelerate offshore survey data interpretation.
Report Scope
| Report Features | Description |
|---|---|
| Market Value (2025) | USD 7.6 Bn |
| Forecast Revenue (2035) | USD 13.3 Bn |
| CAGR (2026-2035) | 5.7% |
| Base Year for Estimation | 2025 |
| Historic Period | 2020-2024 |
| Forecast Period | 2026-2035 |
| Report Coverage | Revenue Forecast, Market Dynamics, Competitive Landscape, Recent Developments |
| Segments Covered | By Services (Data Acquisition, Data Processing, Data Interpretation), By Application (Oil and Gas, Geological Exploration, Mining, Others), By Technology (2D Imaging, 3D Imaging, 4D Imaging) |
| Regional Analysis | North America – US, Canada; Europe – Germany, France, The UK, Spain, Italy, Rest of Europe; Asia Pacific – China, Japan, South Korea, India, Australia, Singapore, Rest of APAC; Latin America – Brazil, Mexico, Rest of Latin America; Middle East & Africa – GCC, South Africa, Rest of MEA |
| Competitive Landscape | Polarcus Limited, Fugro N.V., Compagnie Generale de Geophysique (CGG), Schlumberger Limited-Western Geco, Fugro N.V., Petroleum GeoServices, (TGS)-Norwegian Petroleum Exploration Consultants, Seabird Exploration PLC, Tomlinson Geophysical Services Inc., Ion Geophysical Corporation, Other Key Players |
| Customization Scope | Customization for segments, region/country-level will be provided. Moreover, additional customization can be done based on the requirements. |
| Purchase Options | We have three licenses to opt for: Single User License, Multi-User License (Up to 5 Users), Corporate Use License (Unlimited User and Printable PDF) |








