


Report Overview
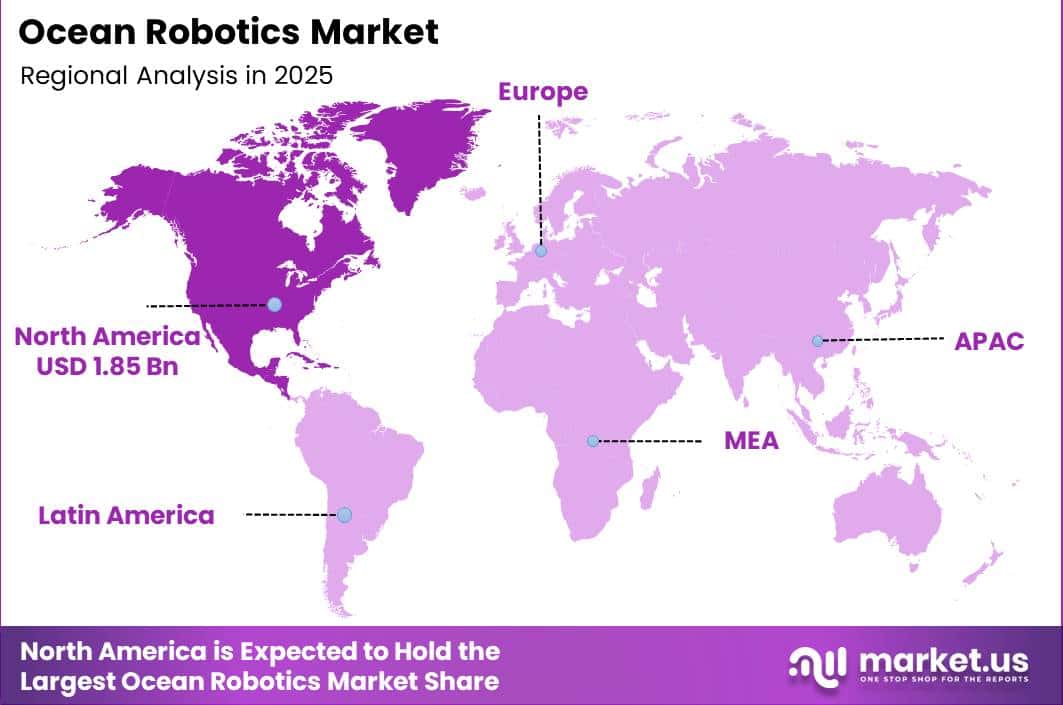
In 2025, the Global Ocean Robotics Market was valued at USD 5.1 billion. The market is projected to grow at a CAGR of 15.1% during 2026–2035, reaching approximately USD 20.7 billion by 2035. North America dominated the global market in 2025, accounting for more than 36.5% of the total market share and generating approximately USD 1.8 billion in revenue.
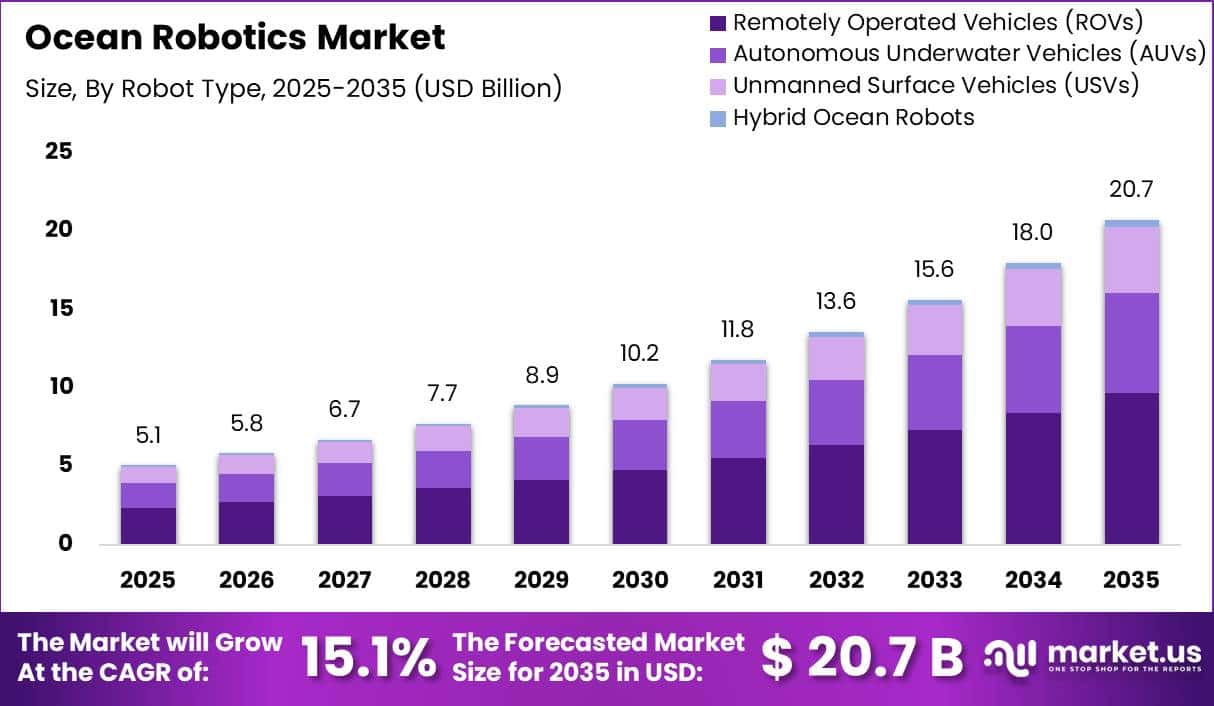
Market growth is supported by rising activity in offshore oil and gas, offshore wind energy, naval defence, marine security, and ocean research. These industries use remotely operated vehicles (ROVs) and autonomous underwater vehicles (AUVs) for subsea inspection, equipment repair, seabed surveying, environmental monitoring, and data collection.
North America held the largest regional position in 2025; its leadership is supported by extensive offshore energy operations in the Gulf of Mexico and North Atlantic, along with strong spending on naval modernization and unmanned maritime security systems. A 36.5% share means that approximately USD 36–37 of every USD 100 spent globally on ocean robotics came from North America in 2025.
Key Takeaway
- Market to grow from USD 5.1 billion in 2025 to USD 20.7 billion by 2035 at a 15.1% CAGR
- ROVs dominate robot types with 46.8% of revenue; AUVs are the fastest-growing device segment
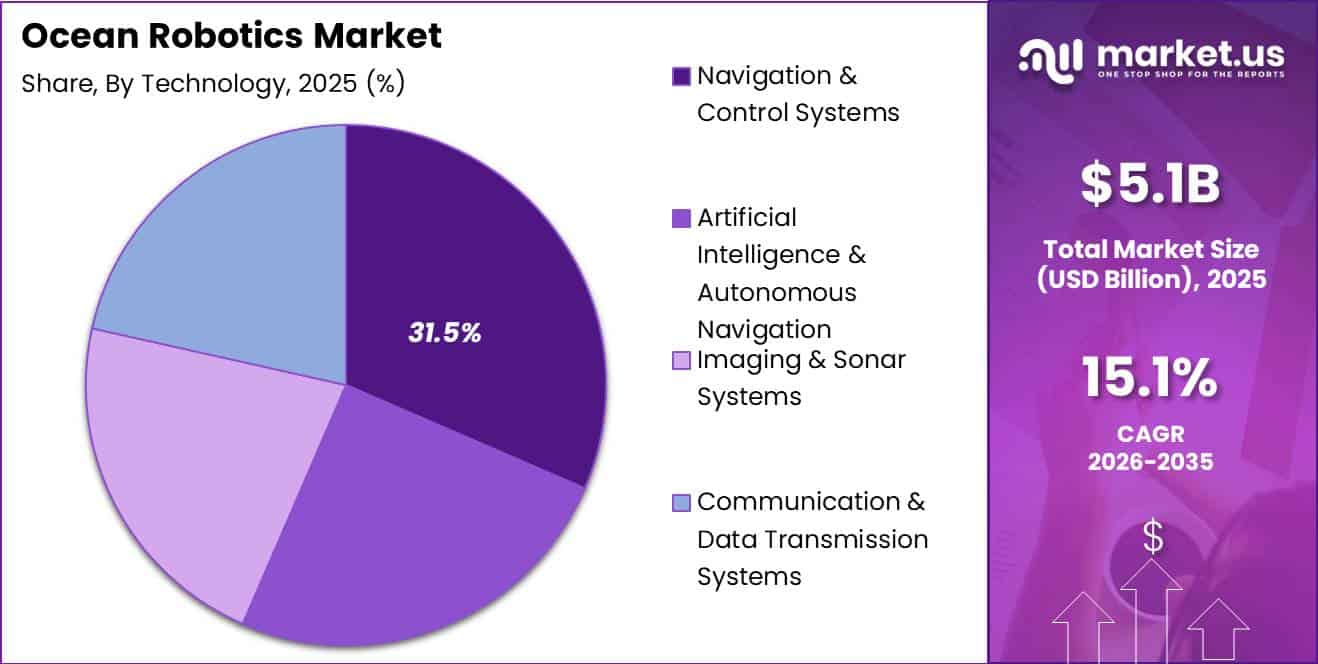
- Navigation and control systems lead technology share at 31.5%, while AI-driven autonomy grows fastest
- Offshore oil and gas inspection leads applications with a 34.7% share
- Mid-depth operations (200–3,000 meters) account for 39.2% of the depth-capability segment
- Oil and gas companies remain the top end users, contributing 37.6% of spending
- Hardware systems lead components with 58.4% share; software and analytics grow fastest
- Tethered operations hold 43.9% of the operation-mode segment, while fully autonomous systems expand quickest
- North America leads with a 36.5% share, worth around USD 1.8 billion in 2025
By Robot Type
Remotely Operated Vehicles (ROVs) held the largest share of the ocean robotics market, accounting for 46.8% of total revenue. Their strong position is supported by widespread use in offshore inspection, repair, maintenance, and construction activities where direct human access is dangerous or not possible. Global offshore operations include several hundred active platforms and thousands of subsea wells, all of which require regular visual inspection, valve control, equipment servicing, and emergency intervention.
ROVs are equipped with live video systems, powerful tools, robotic arms, and direct pilot control. These features make them suitable for pipeline and riser inspection, subsea tie-back installation, valve operation, and blowout preventer support. Divers generally cannot perform complex operations safely beyond roughly 100 meters, while fully autonomous systems may face limitations in crowded or technically difficult environments.
By Technology
Navigation and control systems lead the ocean robotics technology segment, accounting for a 31.5% share. Their strong position is supported by the essential role of accurate guidance, positioning, and vehicle stability in every ROV and AUV mission. These systems allow underwater robots to move safely, maintain their planned routes, and operate sensors or tools around pipelines, subsea equipment, and difficult ocean terrain.
According to the International Hydrographic Organization, only about 24% of the global seafloor has been mapped to modern standards. This leaves a large part of the ocean insufficiently surveyed and increases the need for advanced navigation technologies. The Seabed 2030 initiative aims to map 100% of the ocean floor by 2030.
By Application
Offshore oil and gas inspection leads the ocean robotics application segment, accounting for a 34.7% share. Its dominant position is supported by the continuous need to inspect subsea wells, pipelines, platforms, and production equipment for corrosion, structural damage, leaks, and operational faults. Thousands of offshore platforms and connected subsea assets operate worldwide, requiring regular integrity checks and regulatory inspections to maintain safe production and reduce unexpected shutdowns.
At common offshore operating depths and across long subsea distances, inspections are often difficult, costly, or unsafe for human divers. As a result, operators increasingly use ROVs and AUVs fitted with cameras, sonar systems, thickness-measuring equipment, sensors, and robotic tools. These systems can inspect pipelines, identify damaged components, operate valves, and support emergency response
By Depth Capability
Mid-depth operations between 200 and 3,000 meters lead the ocean robotics depth segment, accounting for a 39.2% share. This position is supported by the large number of offshore wells, pipelines, risers, manifolds, and flowlines installed within this depth range. Human diving is generally not practical at these depths, making robotic systems essential for installation, inspection, repair, and maintenance activities.
Thousands of subsea assets are located along continental slopes, where strong currents and high pressure create difficult operating conditions. However, these environments remain within the working limits of standard work-class ROVs and AUVs. At depths between 200 and 3,000 meters, ocean robots may need to withstand pressures ranging from approximately 20 to 300 bar while maintaining accurate movement, stable positioning, and precise tool control.
Deepwater operations beyond 3,000 meters are expected to be the fastest-growing depth segment. Oil and gas companies and scientific research programs are increasingly exploring frontier basins and deep ocean trenches where pressures exceed 300 bar. In these conditions, robotic platforms are the only practical option for collecting data and handling subsea equipment. This trend is increasing demand for stronger pressure housings, advanced sensors, reliable navigation systems, and ocean robots certified for operations at depths greater than 3,000 meters.
By End User
Oil and gas companies lead the ocean robotics end-user segment, accounting for 37.6% of total spending. Their strong position is supported by the large number of offshore platforms, subsea wells, pipelines, and production systems that require regular inspection and maintenance throughout their operating life. The oil and gas sector continues to supply about one-third of global primary energy and receives hundreds of billions of dollars in annual investment.
Operators use ROVs and AUVs for visual inspection, corrosion measurement, leak detection, equipment testing, valve operation, and mechanical repair. These robotic systems provide a safer and more practical alternative to human access in deep, high-pressure, and low-visibility environments. Regular robotic inspections also help companies reduce equipment failure, environmental risks, and unplanned production losses.
By Component
Hardware systems lead the ocean robotics component segment, accounting for 58.4% of total spending. Their dominant position is supported by the need for a complete physical platform before software or analytics can be used. Every ocean robot requires a hull, pressure housing, thrusters, power systems, tethers, connectors, and payload sensors to perform underwater missions.
Ocean robotics hardware must operate safely at depths of hundreds or thousands of meters. Manufacturers therefore use thick pressure vessels, reliable motors, corrosion-resistant materials, and specialized connectors that can withstand saltwater, repeated pressure changes, and heavy mechanical loads. These technical requirements make hardware the largest cost item within each robotic system.
By Operation Mode
Tethered operations lead the ocean robotics operating-mode segment, accounting for a 43.9% market share. Their strong position is supported by the continued need for real-time human control, reliable power supply, and high-speed data transfer during complex offshore missions. Tethered ROVs use an umbilical cable to provide continuous video, communication, and power, making them suitable for critical inspection, repair, and intervention work.
Subsea inspection services were valued at approximately USD 305 million in 2025 and are projected to reach nearly USD 429 million by 2034. This growth is supported by the increasing need to inspect aging pipelines, risers, offshore platforms, and other subsea structures under strict safety requirements.
Key Market Segments
By Robot Type
- Remotely Operated Vehicles (ROVs)
- Autonomous Underwater Vehicles (AUVs)
- Unmanned Surface Vehicles (USVs)
- Hybrid Ocean Robots
By Technology
- Navigation & Control Systems
- Artificial Intelligence & Autonomous Navigation
- Imaging & Sonar Systems
- Communication & Data Transmission Systems
By Application
- Offshore Oil & Gas Inspection
- Oceanographic Research & Monitoring
- Defense & Maritime Security
- Seabed Mapping & Surveying
- Offshore Renewable Energy Inspection
- Aquaculture Monitoring
By Depth Capability
- Mid-Depth Operations (200–3,000 m)
- Deepwater Operations (>3,000 m)
- Shallow Water Operations (<200 m)
By End User
- Oil & Gas Companies
- Research Institutes & Universities
- Defense & Naval Agencies
- Renewable Energy Developers
- Environmental Monitoring Organizations
By Component
- Hardware Systems
- Software & Analytics Platforms
- Services & Maintenance
By Operation Mode
- Tethered Operations
- Fully Autonomous Operations
- Semi-Autonomous Operations
Geopolitical Impact Analysis
Geopolitical tensions are changing costs, sourcing strategies, and delivery schedules across the ocean robotics industry. WTO and UNCTAD data indicate that average applied tariffs on non-agricultural manufactured goods exceed 6–8% in several major economies. Additional duties on electronics and machinery imported from key Asian suppliers are also increasing the landed cost of semiconductors, motors, navigation equipment, and precision sensors used in ROVs and AUVs.
Supply chain disruption is creating further pressure. UNCTAD reported that Red Sea disruptions beginning in late 2023 reduced Suez Canal transits by around 66%. Many shipping companies were forced to reroute through the Cape of Good Hope, extending Asia–Europe delivery times by approximately 10–15 days.
Ocean robotics manufacturers sourcing titanium housings, syntactic foam, connectors, and electronic components from Europe or East Asia face longer production cycles and higher inventory requirements. Freight surcharges on some routes have also increased by 20–30% compared with pre-crisis levels.
Energy price volatility continues to affect market demand. The International Energy Agency has recorded oil price movements exceeding USD 20 per barrel within individual years since 2022. Higher prices can encourage offshore operators to accelerate inspection and asset life-extension projects, increasing demand for work-class ROVs and deepwater AUVs.
Regional Analysis
North America leads the global ocean robotics market with a 36.5% share, representing an estimated value of around USD 1.8 billion. The region remains the main demand center for advanced ROVs, AUVs, and other marine robotic systems. This position is supported by strong offshore activity in the U.S. and Canada, including oil and gas production, subsea inspection, offshore wind development, defense, and homeland security operations.
The U.S. alone generates more than USD 1.2–1.3 billion in ocean robotics-related revenue. Demand is supported by offshore block leasing in the Gulf of Mexico, investment in subsea asset integrity, and naval modernization programs. Unmanned underwater vehicles are increasingly used for mine countermeasures, surveillance, seabed mapping, and maritime monitoring.
Asia-Pacific is expected to be the fastest-growing region, with marine and underwater robotics expanding at CAGRs in the low- to mid-teens. The regional market was already valued at more than USD 1.5–1.6 billion during the mid-2020s. Growth is being driven by China, Japan, South Korea, India, and Australia through investment in deep-sea exploration, maritime security, aquaculture, and ocean research.
Key Regions and Countries
North America
- US
- Canada
Europe
- Germany
- France
- The UK
- Spain
- Italy
- Rest of Europe
Asia Pacific
- China
- Japan
- South Korea
- India
- Australia
- Rest of APAC
Latin America
- Brazil
- Mexico
- Rest of Latin America
Middle East & Africa
- GCC
- South Africa
- Rest of MEA
Market Dynamics
Drivers
| Driver | (~) % CAGR | Geographic Relevance | Impact Timeline |
|---|---|---|---|
| Offshore energy subsea inspection demand | +2.2% | North America, Europe, Middle East, Asia-Pacific | Short term (≤ 2 years) |
| Defense & security underwater missions | +2.0% | North America, Europe, East Asia | Medium term (2–4 years) |
| Advances in subsea sensing & autonomy | +1.8% | Global | Medium term (2–4 years) |
| Oceanographic & climate research programs | +1.5% | Europe, North America, Asia-Pacific | Short term (≤ 2 years) |
| Lifecycle cost savings vs. manned operations | +1.3% | Global offshore basins | Medium term (2–4 years) |
| Digitalization of subsea assets & data | +1.0% | Global | Long term (≥ 4 years) |
Offshore energy subsea inspection demand
Expansion of offshore oil, gas, and wind assets has created recurring subsea inspection, maintenance, and repair workloads that are structurally too costly and hazardous to serve with crewed vessels alone, driving rapid substitution toward remotely operated and autonomous ocean robotics in key basins such as the North Sea, Gulf of Mexico, and offshore China.
Across these regions, national regulators and operators increasingly require annual or multi-yearly inspections of subsea pipelines, jackets, and cables, lifting inspection campaign counts by roughly 20–30% since 2022 and supporting additional ocean robotics-driven growth of around +2.2% on top of the baseline CAGR through higher utilization rates and fleet additions.
For individual service providers, shifting inspection hours from diver support vessels to robotics can cut day rates per inspected kilometer by roughly 15–25% and reduce vessel days by 10–15 per large campaign, improving project margins by an estimated 3–5 percentage points while enabling new outcome-based commercial models such as per-kilometer or per-asset inspection contracts tied to high-resolution seabed and structural data streams.
Restraints
| Restraint | (~) % CAGR | Geographic Relevance | Impact Timeline |
|---|---|---|---|
| High upfront CapEx for advanced systems | -2.1% | Global | Short term (≤ 2 years) |
| Limited subsea communication infrastructure | -1.7% | Emerging markets, remote basins | Medium term (2–4 years) |
| Procurement conservatism in offshore operators | -1.5% | Global oil & gas majors | Short term (≤ 2 years) |
| Fragmented certification & safety regimes | -1.3% | Global | Medium term (2–4 years) |
| Exposure to offshore project delays | -1.0% | North Sea, Latin America, Asia-Pacific | Short term (≤ 2 years) |
| Limited access to risk-tolerant finance | -0.9% | Emerging-market operators | Long term (≥ 4 years) |
High upfront CapEx for advanced systems
State-of-the-art ocean robotics platforms with full survey-grade sensor suites, robust manipulators, and long-endurance power systems can require initial hardware outlays in the high six- to low seven-figure range per unit, which, combined with support vessels and launch-and-recovery systems, can push project-level CapEx envelopes up by roughly 20–30% compared with less automated subsea methods and slow adoption among cash-constrained operators.
With central banks having kept policy rates elevated through 2024–2026, weighted average costs of capital for offshore service companies have in many cases risen by around 150–250 basis points versus pre-2022 levels, effectively shaving an estimated 2.1% from the achievable market CAGR as smaller firms defer fleet renewal and scale-up decisions in favor of sweat-the-asset strategies for existing equipment.
Strategically, this CapEx intensity compresses margins in the early years of deployment—often by 2–4 percentage points because utilization ramps lag financing schedules, leading to longer payback periods of roughly 5–7 years and forcing providers to prioritize conservative, long-term contracts over more innovative but higher-risk revenue models.
Challenges
| Challenge | (~) % CAGR | Geographic Relevance | Mitigation Horizon |
|---|---|---|---|
| Specialized subsea talent shortage | -1.9% | Global | Long term (≥ 4 years) |
| Harsh-environment reliability limits | -1.6% | Arctic, deepwater basins | Medium term (2–4 years) |
| Data management & integration complexity | -1.4% | Global | Medium term (2–4 years) |
| Evolving underwater noise expectations | -1.2% | Europe, North America, selected Asia-Pacific | Long term (≥ 4 years) |
| Cybersecurity for connected subsea assets | -1.1% | Global naval & critical energy | Long term (≥ 4 years) |
| Supply chain lead-time volatility | -1.0% | Global | Short term (≤ 2 years) |
Specialized subsea talent shortage
Ocean robotics projects depend on a narrow pool of engineers and operators with combined expertise in hydrodynamics, underwater acoustics, autonomy software, and offshore operations, yet graduation and certification rates in these disciplines have lagged demand, creating multi-year gaps that materially slow the pace at which fleets and service lines can be scaled.
Across leading markets, operators report that it can take roughly 12–24 months to fully train a new subsea robotics pilot or mission specialist, and vacancy rates in critical roles can reach 10–15% during peak offshore seasons, equating to an estimated friction drag of about -1.9% on potential CAGR as projects are sequenced more slowly and some higher-complexity missions are deferred.
To navigate this structural vulnerability, firms are spreading scarce expert teams across multiple regions, investing 3–5% of annual operating budgets into internal academies and simulation facilities, and redesigning hardware and mission-planning software for greater automation and remote operation so that a single expert can supervise multiple vehicles, gradually easing but not eliminating the talent bottleneck over a horizon of at least 4 years.
Opportunities
| Opportunity | (~) % CAGR | Geographic Relevance | Execution Window |
|---|---|---|---|
| Persistent ocean data-as-a-service models | +2.0% | Global EEZs and high seas | Medium term (2–4 years) |
| Autonomous inspection for offshore wind build-out | +1.8% | Europe, Asia-Pacific, North America | Medium term (2–4 years) |
| Dual-use defense & civilian platforms | +1.7% | North Atlantic, Indo-Pacific | Long term (≥ 4 years) |
| Environmental monitoring for noise & biodiversity | +1.5% | Europe, North America | Medium term (2–4 years) |
| Retrofit kits for legacy subsea assets | +1.3% | Brownfield offshore basins | Short term (≤ 2 years) |
| Cross-border ocean infrastructure security | +1.1% | Transnational pipelines & cables | Long term (≥ 4 years) |
Persistent ocean data-as-a-service models
This opportunity remains largely untapped because most ocean robotics deployments today are project-based, with vehicles chartered for days or weeks, whereas persistent fleets of autonomous platforms delivering continuous oceanographic, infrastructure, and environmental data streams could support subscription contracts and multi-year service-level agreements that sit structurally above the current baseline forecast.
By equipping long-endurance platforms with modular sensor payloads and standardized data formats, operators could spread hardware and maintenance costs across hundreds of client data feeds, cutting effective per-measurement costs by an estimated 30–50% versus bespoke surveys and enabling gross margins that are potentially 5–8 percentage points higher than traditional day-rate models, which translates into an incremental upside of roughly +2.0% to achievable CAGR if scaled in major exclusive economic zones.
Key Players Analysis
Tier-1 leadership in the ocean robotics market is supported by Kongsberg Maritime, Oceaneering International, Teledyne Marine, L3Harris Technologies, and General Dynamics Mission Systems. Kongsberg Maritime recorded 2025 revenue of NOK 24.2 billion, or approximately USD 2.3 billion, supported by subsea, autonomous, and marine digital solutions. Its HUGIN AUV portfolio and integrated control systems place its estimated advanced ocean systems share at 15–20%.
Oceaneering generated around USD 2.6–2.7 billion in 2025 revenue. Its Subsea Robotics division contributed more than USD 800–850 million, achieved operating margins in the mid-30% range, and operated over 250 work-class ROVs. The company is estimated to hold a 15–20% share of offshore robotics services. It also secured USD 300 million in new ROV and AUV contracts during a single quarter in 2022.
Teledyne Technologies reported Q4 2025 sales of USD 1.6 billion and annual free cash flow above USD 1 billion. It invested approximately USD 850 million in acquisitions, while marine instrumentation sales increased by 19.2%. L3Harris generated about USD 19.4 billion in 2024 revenue with high-single-digit R&D intensity, while General Dynamics recorded more than USD 42 billion in sales. Both are estimated to hold mid-single-digit market shares.
Tier-2 companies include Saab Seaeye, Fugro, DeepOcean, Forum Energy Technologies, ECA Group, Hydroid, Ocean Infinity, Bluefin Robotics, Greensea IQ, and Exail. Saab Seaeye and Fugro hold estimated regional shares of 3–7%, while autonomous specialists generate revenues ranging from tens to low hundreds of millions of dollars.
Top Key Players in the Market
- Kongsberg Maritime
- Saab Seaeye
- Oceaneering International
- Teledyne Marine
- Bluefin Robotics
- Ocean Infinity
- Fugro
- ECA Group
- Forum Energy Technologies
- Hydroid
- L3Harris Technologies
- General Dynamics Mission Systems
- DeepOcean
- Greensea IQ
- Exail
Recent Developments
- In March 2026, Teledyne Marine received a UK Ministry of Defence contract under the Royal Navy’s Future Maritime Data Gathering program. The company will supply Sentinel and Slocum gliders, APEX floats, and related services to strengthen long-duration ocean data collection. Teledyne has delivered more than 12,000 APEX floats and 1,290 Slocum gliders, including over 600 systems used by NATO naval customers. Its Gavia AUVs have also been purchased by 18 navies worldwide.
- In August 2025, Oceaneering International announced approximately USD 180 million in subsea robotics contracts awarded by Petrobras during Q2 2025. The 4-year agreements cover work-class ROV operations, specialized tooling, survey services, subsea positioning, inspection, maintenance, repair, decommissioning, mooring inspection, and FPSO support. Operations were scheduled to begin between Q3 2025 and Q1 2026, with options available to extend the contracts.
- In 2025, during hurricane season, Oshen built 15 C-Star autonomous surface robots and deployed 8 units for hurricane-monitoring missions. NOAA’s Atlantic mission included 7 Oshen C-Stars and 1 Chance MC40. Among them, 5 C-Stars were positioned near the U.S. Virgin Islands, while 3 collected continuous ocean data during Category 5 Hurricane Humberto. This successful deployment demonstrated the operational value of small autonomous robots for severe-weather monitoring and ocean data collection.
Report Scope
| Report Features | Description |
|---|---|
| Market Value (2025) | USD 5.1 Billion |
| Forecast Revenue (2035) | USD 20.7 Billion |
| CAGR (2026-2035) | 15.1% |
| Base Year for Estimation | 2025 |
| Historic Period | 2020-2024 |
| Forecast Period | 2026-2035 |
| Report Coverage | Revenue Forecast, Market Dynamics, Competitive Landscape, Recent Developments |
| Segments Covered | By Robot Type (Remotely Operated Vehicles (ROVs), Autonomous Underwater Vehicles (AUVs), Unmanned Surface Vehicles (USVs), Hybrid Ocean Robots); By Technology (Navigation & Control Systems, Artificial Intelligence & Autonomous Navigation, Imaging & Sonar Systems, Communication & Data Transmission Systems); By Application (Offshore Oil & Gas Inspection, Oceanographic Research & Monitoring, Defense & Maritime Security, Seabed Mapping & Surveying, Offshore Renewable Energy Inspection, Aquaculture Monitoring); By Depth Capability (Mid-Depth Operations (200–3,000 m), Deepwater Operations (>3,000 m), Shallow Water Operations (<200 m)); By End User (Oil & Gas Companies, Research Institutes & Universities, Defense & Naval Agencies, Renewable Energy Developers, Environmental Monitoring Organizations); By Component (Hardware Systems, Software & Analytics Platforms, Services & Maintenance); By Operation Mode (Tethered Operations, Fully Autonomous Operations, Semi-Autonomous Operations) |
| Regional Analysis | North America – US, Canada; Europe – Germany, France, The UK, Spain, Italy, Rest of Europe; Asia Pacific – China, Japan, South Korea, India, Australia, Singapore, Rest of APAC; Latin America – Brazil, Mexico, Rest of Latin America; Middle East & Africa – GCC, South Africa, Rest of MEA |
| Competitive Landscape | Kongsberg Maritime, Saab Seaeye, Oceaneering International, Teledyne Marine, Bluefin Robotics, Ocean Infinity, Fugro, ECA Group, Forum Energy Technologies, Hydroid, L3Harris Technologies, General Dynamics Mission Systems, DeepOcean, Greensea IQ, Exail |
| Customization Scope | Customization for segments, region/country-level will be provided. Moreover, additional customization can be done based on the requirements. |
| Purchase Options | We have three licenses to opt for: Single User License, Multi-User License (Up to 5 Users), Corporate Use License (Unlimited Users and Printable PDF) |





























