


Report Overview
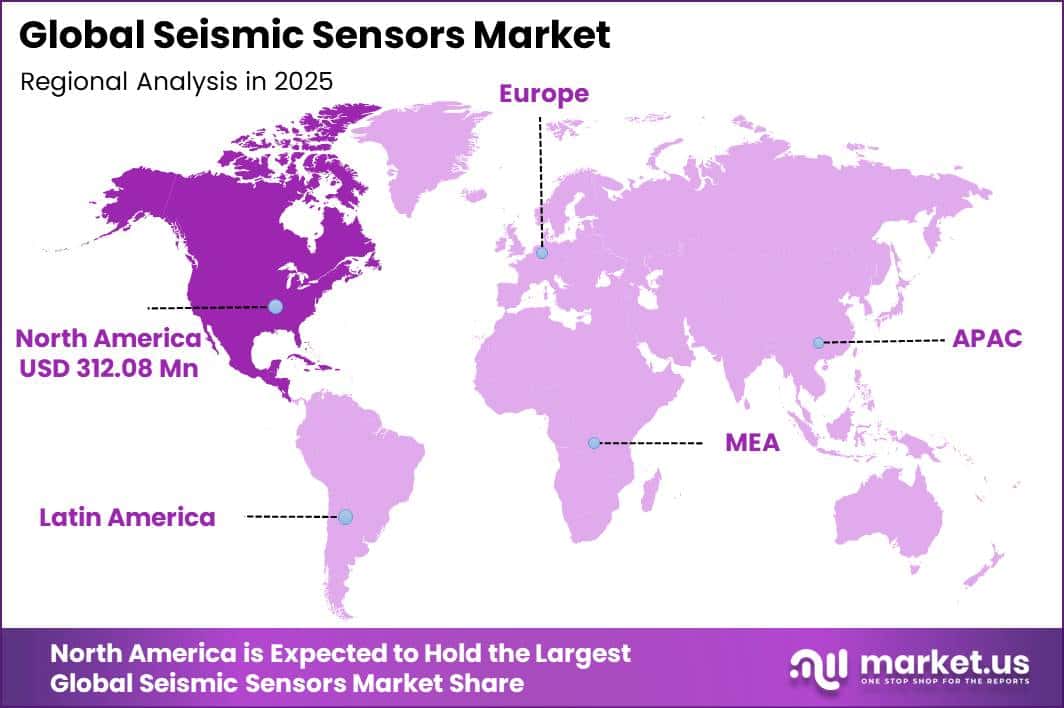
In 2025, the Global Seismic Sensors Market was valued at USD 752.0 million. The market is projected to grow at a CAGR of 6.7% during 2026–2035, reaching approximately USD 1,438.4 million by 2035. North America dominated the global market in 2025, accounting for more than 41.5% of the total market share and generating approximately USD 312.08 million in revenue.
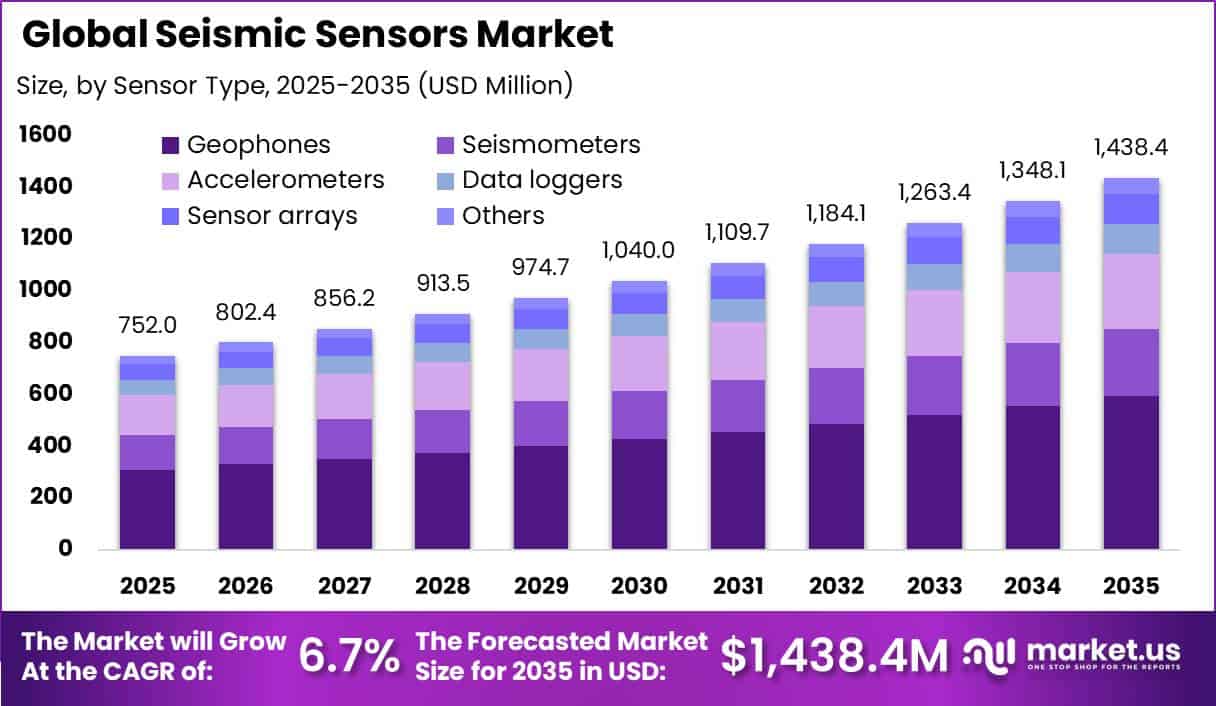
Market growth is supported by higher investment in earthquake early-warning systems, seismic-risk mapping, and monitoring of bridges, dams, power networks, transport routes, and industrial facilities. According to the U.S. Geological Survey, earthquakes caused estimated annualized losses of nearly USD 14.7 billion to U.S. building stock in 2023, around 140% higher than the agency’s 2017 estimate.
In Alaska, the USGS has proposed a 450-station earthquake early-warning network, including 270 new stations, 160 upgraded stations, and 20 existing early-warning stations, directly supporting demand for broadband and strong-motion seismic sensors. Oil and gas activity also supports sensor demand for subsurface mapping and reservoir monitoring.
U.S. crude-oil production increased by 270,000 barrels per day in 2024, reaching a record 13.2 million barrels per day, mainly driven by the Permian Basin. Production increased from 5.0 million barrels per day in 2008 to 13.2 million barrels per day in 2024, a gain of 8.2 million barrels per day, or about 164%. These factors support the market’s projected absolute increase of USD 686.4 million by 2035.
Key Takeaway
- The Seismic Sensors Market is valued at USD 752.0 million in 2025, projected to reach USD 1,438.4 million by 2035 at a 6.7% CAGR.
- Geophones dominated the seismic sensors market with a 41.3% share in 2025.
- Digital sensors captured a strong 35.6% share of the seismic sensors market in 2025.
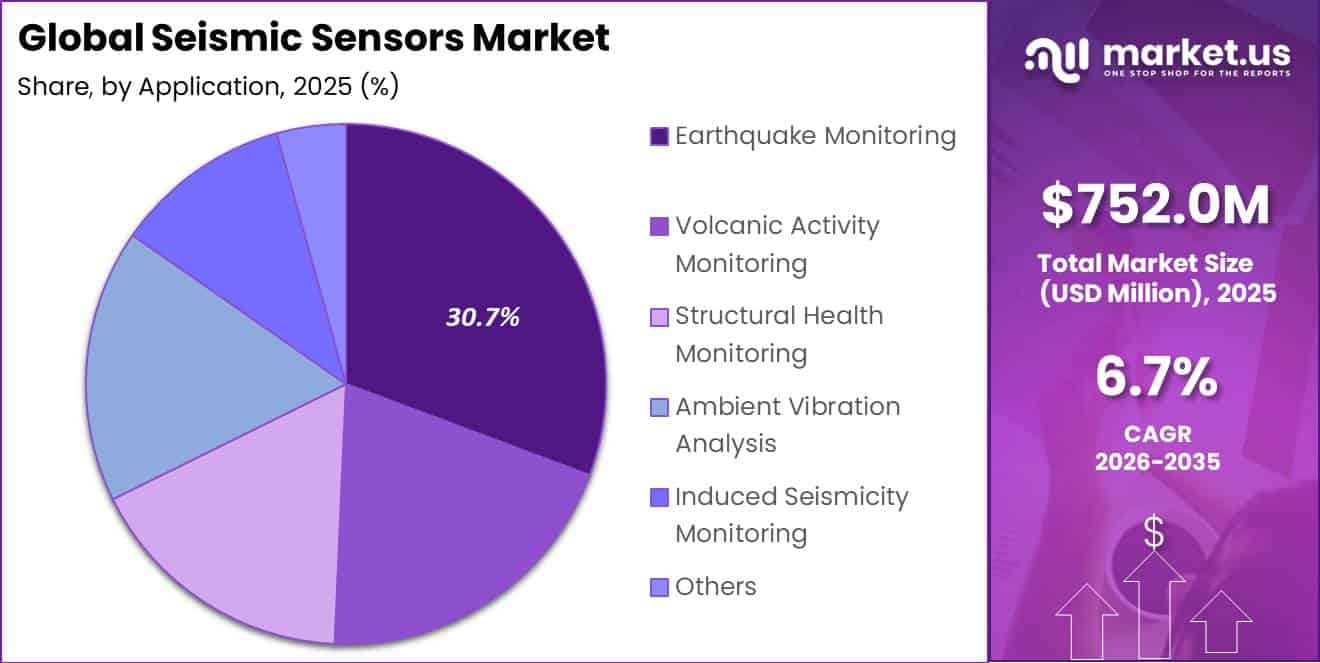
- Earthquake monitoring led the application segment with a 30.7% share in 2025.
- Oil and gas remained the leading end-use segment with a 34.2% share in 2025.
- North America led the market in 2025 with over a 41.5% share and approximately USD 312.08 million in revenue.
Market Statistics and Data Insights
- Public earthquake-monitoring investment — In 2025, the U.S. Geological Survey awarded more than USD 23 million for earthquake monitoring and applied research. This included more than USD 12.5 million for ShakeAlert, more than USD 6.5 million for Advanced National Seismic System regional networks, USD 4 million for external earthquake research, and USD 400,000 for geodetic networks.
- Economic exposure supporting monitoring demand — USGS estimates average annual U.S. earthquake losses to buildings at more than USD 14.7 billion, approximately 140% above the earlier 2017 estimate.
- Large installed seismic-instrument base — USGS and its partners have installed nearly 4,000 new or upgraded seismic instruments toward the 7,100-station target established for the Advanced National Seismic System. Around 800 instruments were added after the 2018 NEHRP reauthorization, while ShakeAlert was reported as approximately 90% built out.
- Alaska shows substantial remaining sensor requirements — The official Alaska ShakeAlert Phase 1 plan calls for 450 real-time seismic stations, including 270 new stations, 160 existing stations requiring upgrades, and 20 stations already capable of early warning. The planned capital requirement is USD 65.84 million, with annual operating and maintenance costs of USD 12.01 million.
- Telemetry remains a major network-upgrade need — Although more than 700 seismic stations currently operate across Alaska, only about 10% of seismic sites meet the latency requirement for effective earthquake early warning, and only 20% have sufficient data availability. ShakeAlert ideally requires latency below 1 second, although up to 5 seconds can be tolerated.
- China has deployed one of the largest identifiable sensor networks — China completed its National Earthquake Early Warning Project with 15,899 earthquake-monitoring stations, 3 national centres, 31 provincial centres, 173 city-level information centres, and 12,082 earthquake-warning terminals. Five major earthquake-risk zones now have second-level warning capability.
- Japan maintains a dense multi-source monitoring structure — The Japan Meteorological Agency operates around 200 seismographs and 600 seismic-intensity meters and receives real-time information from more than 3,600 additional seismic-intensity meters operated by local governments and research institutions.
- Australia maintains extensive continuous seismic coverage — Geoscience Australia operates more than 100 stations in the Australian National Seismograph Network. It monitors seismic information from more than 150 locations in Australia and more than 500 stations worldwide in near real time, with data reaching its Canberra processing facility within 30 seconds of recording.
- Oilfield activity continues to create a large seismic-survey base — U.S. crude-oil production increased 3%, or about 350,000 barrels per day, in 2025 to a record 13.6 million barrels per day. Lower-48 production outside the Gulf accounted for 11.3 million barrels per day, or 83% of total U.S. output.
- Induced seismicity creates a measurable monitoring requirement — USGS researchers analyzed 95,993 earthquakes recorded in the Raton Basin during 2016–2024, covering local magnitudes from -1 to 4.3. Researchers conducted detailed moment-tensor analysis on 90 earthquakes of magnitude 2 or higher and identified a cluster that followed roughly 1 year of increased injection activity from wells within 15 km.
- High-density wireless seismic acquisition is moving into very large fleets — In September 2026, Vector Geophysical purchased 30,000 STRYDE Halo-Connect seismic nodes. Its accompanying Nimble system can rotate as many as 3,780 nodes per day during high-density seismic acquisition.
By Sensor Type
In 2025, Geophones held a dominant position in the seismic sensors market, accounting for 41.3% of total demand. Their strong share is supported by wide use in land-based seismic surveys, where they convert ground vibrations into electrical signals for subsurface analysis. Geophones help identify underground rock layers, faults, reservoir structures, and suitable drilling locations.
This makes them important across oil and gas exploration, mineral surveys, civil engineering, and geotechnical applications. U.S. crude oil production reached 13.2 million barrels per day in 2024, increasing by 270,000 barrels per day from 2023. Much of this growth came from the Permian region, where detailed seismic information is required for well planning and reservoir development.
By Technology
In 2025, Digital Sensors held a strong position in the seismic sensors market, accounting for 35.6% of total demand. Their growth is supported by faster data processing, better signal accuracy, remote monitoring, automatic transmission, and precise time stamping. These features are especially important for earthquake early-warning systems, where even a few seconds can support faster action across rail networks, utilities, factories, and public agencies.
By December 2023, the USGS-supported ShakeAlert system on the U.S. West Coast was receiving data from 1,509 broadband and strong-motion stations, compared with about 700 stations during earlier operations. Continuous data were processed through centres in Seattle, Menlo Park, Pasadena, and Berkeley, showing the scale of digital sensor networks required for real-time alerts.
Digital sensors also improve network efficiency by allowing large volumes of seismic data to be transmitted, stored, and analyzed automatically. By December 2024, the ShakeAlert network included 1,553 seismic stations and about 1,100 geodetic stations across California, Oregon, and Washington. These stations transmitted data every 1 second, while plans called for another 122 seismic stations, further supporting demand for digital seismic sensing technology.
By Application
In 2025, Earthquake Monitoring held a dominant position in the seismic sensors market, accounting for 30.7% of total demand. The segment maintains a strong share because earthquake monitoring is a continuous public-safety requirement rather than a one-time activity.
According to the World Bank, rapid-onset natural hazards cause an average loss equal to 9.4 million full-time jobs each year across 132 countries. Earthquakes alone account for nearly 3.7 million annual job-equivalent losses, highlighting their significant impact on infrastructure, workplaces, and local economies.
Growing disaster risks are encouraging governments to expand seismic-monitoring networks and replace older equipment. Each monitoring station requires sensors that continuously measure ground vibration and transmit information for real-time analysis. In 2024, the United Nations Office for Disaster Risk Reduction supported 163 Member States through disaster-risk tools, data systems, and risk-informed decision-making.
By End Use
In 2025, Oil and Gas held a dominant position in the seismic sensors market, accounting for 34.2% of total demand. The segment leads because seismic data is widely used to identify, evaluate, and develop hydrocarbon reservoirs. Before drilling, operators use seismic surveys to send controlled energy waves underground and record reflected signals through sensor arrays.
This helps identify rock layers, faults, reservoir boundaries, and possible drilling risks. Seismic monitoring is also used during production to improve reservoir management and support future well planning. According to OPEC, global oil demand increased by 1.49 million barrels per day in 2024, reaching an average of 103.84 million barrels per day. This large consumption base continues to support exploration and field-development activity.
Global proven crude-oil reserves reached 1,567 billion barrels at the end of 2024, including 1,241 billion barrels held by OPEC Member Countries. Developing these reserves requires accurate subsurface information, particularly in complex and mature fields. Geophones, digital receivers, and other seismic sensors help create detailed underground images, reduce drilling uncertainty, and support more efficient investment in wells and production facilities.
Key Market Segments
By Sensor Type
- Geophones
- Seismometers
- Accelerometers
- Data loggers
- Sensor arrays
- Others
By Technology
- Digital Sensors
- Analog Sensors
- MEMS Sensors
- Optical Sensors
By Application
- Earthquake Monitoring
- Volcanic Activity Monitoring
- Structural Health Monitoring
- Ambient Vibration Analysis
- Induced Seismicity Monitoring
- Others
By End Use
- Oil and Gas
- Mining and Construction
- Aerospace and Defense
- Government and Research Institutions
- Others
Geopolitical Impact Analysis
Geopolitical disruption is increasing supply-chain risk and procurement costs across the seismic sensors market. These systems depend on globally sourced electronic components, copper wiring, printed circuit boards, batteries, precision housings, and communication modules. Red Sea disruption has affected Asia–Europe shipping routes used for both components and finished instruments.
According to UN Trade and Development, rerouting vessels around the Cape of Good Hope adds about 12 days to Asia–Europe voyages and increases transit time by nearly 30%. Longer journeys also reduce effective global container-shipping capacity by around 9%. By mid-2024, Suez Canal transits were approximately 70% below their previous peak, while arrivals around the Cape of Good Hope increased by 89%.
For seismic-sensor manufacturers, these changes can delay electronic parts, cables, metal housings, and replacement equipment, while increasing inventory and working-capital requirements. Commodity and trade conditions are creating additional cost pressure. The World Bank projected average copper prices of USD 8,200 per metric ton in 2025, around 10% below the 2024 average.
Copper remains an important input for sensor coils, connectors, cables, and circuit boards. Brent crude oil was projected at USD 64 per barrel in 2025, down 21% year on year, which may reduce operating costs for field surveys and marine seismic vessels. However, ongoing conflicts and trade tensions could reverse these trends, creating uncertainty in equipment prices, delivery schedules, and project budgets.
Regional Analysis
In 2025, North America held a dominant position in the seismic sensors market, accounting for 41.5% of global demand and generating approximately USD 312.08 million in revenue. The region benefits from established earthquake-monitoring networks, strong use of digital sensing technology, large oil and gas survey activity, and continued investment in critical infrastructure protection.
The United States remains the major demand centre, where seismic sensors are widely used across cities, energy-producing areas, dams, bridges, rail corridors, pipelines, and power systems. According to the U.S. Geological Survey, nearly 75% of the United States could experience a damaging earthquake. The ShakeAlert system across California, Oregon, and Washington includes 1,553 seismic stations and around 1,100 geodetic stations, supporting continued demand for new sensors, upgrades, calibration, replacement, and maintenance.
Asia Pacific is expected to be the fastest-growing regional market due to high earthquake exposure, expanding urban infrastructure, and government investment in early-warning systems. China completed its National Earthquake Early Warning Project in 2024, creating 15,899 monitoring stations.
Japan also operates a large seismic network, including around 200 seismographs and 600 seismic-intensity meters, while receiving data from more than 3,600 additional instruments. Continued infrastructure development across China, Japan, India, Indonesia, and Southeast Asia is expected to increase demand for seismic monitoring equipment.
Key Regions and Countries
North America
- US
- Canada
Europe
- Germany
- France
- The UK
- Spain
- Italy
- Rest of Europe
Asia Pacific
- China
- Japan
- South Korea
- India
- Australia
- Rest of APAC
Latin America
- Brazil
- Mexico
- Rest of Latin America
Middle East & Africa
- GCC
- South Africa
- Rest of MEA
Market Dynamics
Drivers
| Driver | (~) % CAGR | Geographic Relevance | Impact Timeline |
|---|---|---|---|
| Public Early-Warning Expansion | +1.4% | North America, East Asia | Short term (2 years or less) |
| Oilfield Reservoir Imaging | +1.0% | North America, Middle East, Latin America | Short term (2 years or less) |
| Critical Asset Monitoring | +0.8% | Global urban corridors | Medium term (2 to 4 years) |
| Digital Network Modernization | +0.7% | North America, Europe, Asia Pacific | Medium term (2 to 4 years) |
| Induced-Seismicity Surveillance | +0.5% | United States, Canada, Europe | Medium term (2 to 4 years) |
Public Early-Warning Expansion
Public seismic-network spending remains an important demand driver because each new monitoring station requires sensors, digitizers, timing systems, telemetry equipment, installation, and maintenance. In 2025, the USGS provided more than USD 23 million for earthquake monitoring and applied research, while the fiscal 2025 request for the Earthquake Hazards Program reached USD 94.8 million with 241 full-time-equivalent staff.
By December 2024, ShakeAlert included 1,553 seismic stations and around 1,100 geodetic stations, with the network approximately 90% complete. Continued expansion and equipment replacement support recurring demand for digital sensors, communications upgrades, spare parts, calibration, and field services. This spending could contribute an estimated +1.4% incremental upside to the baseline 6.7% CAGR.
Restraints
| Restraint | (~) % CAGR | Geographic Relevance | Impact Timeline |
|---|---|---|---|
| Public Budget Dependence | -1.1% | North America, emerging economies | Short term (2 years or less) |
| Energy Exploration CapEx Cuts | -0.8% | Global offshore and onshore basins | Short term (2 years or less) |
| High Network Deployment Cost | -0.7% | Remote and lower-income regions | Medium term (2 to 4 years) |
| Lengthy Public Procurement | -0.5% | Government-led monitoring programs | Medium term (2 to 4 years) |
| Oil Price Uncertainty | -0.4% | Global energy markets | Short term (2 years or less) |
Public Budget Dependence
Government funding dependence remains a key near-term restraint because many earthquake-monitoring networks rely on annual public budgets. The USGS fiscal 2025 budget justification requested USD 94.8 million for the Earthquake Hazards Program, only USD 951,000 above the fiscal 2024 continuing-resolution level. The proposed Earthquake Early Warning and geodesy line also included a USD 1.5 million reduction.
Federal appropriations for U.S. earthquake early-warning capabilities totaled USD 161.8 million during fiscal 2006–2024. This shows that network expansion can be delayed by public funding cycles even when hazard-monitoring needs remain high. Postponed tenders can reduce factory utilization, slow distributor inventory turnover, and increase working-capital pressure on smaller suppliers, creating an estimated -1.1% drag on the baseline market growth path.
Challenges
| Challenge | (~) % CAGR | Geographic Relevance | Mitigation Horizon |
|---|---|---|---|
| Maritime Component Delays | -0.9% | Europe-Asia and Middle East routes | Short term (2 years or less) |
| Remote Site Servicing | -0.7% | Offshore, Arctic, mountain regions | Medium term (2 to 4 years) |
| Data Interoperability Gaps | -0.6% | Global multi-vendor networks | Medium term (2 to 4 years) |
| Specialist Skills Scarcity | -0.5% | Global technical labor markets | Long term (4 years or more) |
| Harsh-Environment Reliability | -0.4% | Offshore, desert, polar regions | Medium term (2 to 4 years) |
Maritime Component Delays
Maritime disruption remains a major operating challenge because seismic equipment depends on imported microelectronics, copper conductors, printed circuit boards, batteries, connectors, telemetry modules, and rugged housings.
By mid-2024, ship capacity through the Gulf of Aden had fallen 76%, Suez Canal tonnage declined 70%, and arrivals around the Cape of Good Hope increased 89%. Maritime transport also carries nearly 80% of global goods movement, exposing sensor supply chains to delivery delays.
Raw-material costs add further pressure. The World Bank projected average copper prices of about USD 9,700 per metric ton in 2025, compared with USD 9,142 per metric ton in 2024. This increases cost uncertainty for coils, cables, and connectors.
Manufacturers are responding through dual sourcing, larger inventories, alternate-component designs, and longer procurement cycles, creating an estimated -0.9% friction drag on maximum market growth potential.
Opportunities
| Opportunity | (~) % CAGR | Geographic Relevance | Execution Window |
|---|---|---|---|
| Induced-Seismicity Monitoring Platforms | +1.3% | North America, Europe, Australia | Medium term (2 to 4 years) |
| Managed Monitoring Services | +1.0% | Global industrial sites | Medium term (2 to 4 years) |
| Distributed Fibre Sensing | +0.9% | Energy, rail, pipeline corridors | Long term (4 years or more) |
| Offshore Wind Site Surveys | +0.7% | Europe, China, United States | Medium term (2 to 4 years) |
| Sensor Fleet Consolidation | +0.5% | Global specialist suppliers | Medium term (2 to 4 years) |
Induced-Seismicity Monitoring Platforms
Induced-seismicity monitoring remains a future growth opportunity rather than a major current driver, as many injection, geothermal, carbon-storage, and mining projects still rely on stand-alone surveys. USGS research in the Raton Basin analyzed 95,993 earthquakes during 2016–2024, including 90 events with local magnitude 2 or higher, and identified increased seismic activity after about 1 year of higher injection volumes within 15 km.
A shift toward subscription-based monitoring, automated alerts, and compliance reporting could create recurring revenue for sensor suppliers. These service models could improve gross margins by an estimated 10–20% compared with one-time hardware sales and reduce event-analysis costs per monitored site by around 15–25%. Wider adoption could provide up to +1.3% CAGR upside for the seismic sensors market.
Key Players Analysis
The seismic sensors market remains highly fragmented, with specialist companies holding strong positions in oil and gas exploration, earthquake monitoring, and structural vibration measurement. Tier-1 companies include Sercel, Geospace Technologies, Nanometrics, Kinemetrics, Güralp Systems, and PCB Piezotronics.
These companies benefit from established product portfolios, global customer networks, and participation in large monitoring and energy-survey projects. Geospace Technologies generated USD 110.8 million in fiscal 2025 revenue, including USD 50.7 million from its Energy Solutions business. This segment also included a USD 17.0 million ocean-bottom-node transaction, showing the high equipment value associated with offshore seismic projects.
Tier-2 companies include GeoSIG, IMV Corporation, Riverhawk, Lunitek, Gaiacode, Rogue Seismic, and other specialist suppliers of vibration monitoring, data recording, and field systems. These companies generally compete through application expertise, customized engineering, competitive pricing, and regional support. Digital technology is becoming an important competitive factor.
SiTime reported USD 326.7 million in fiscal 2025 revenue and USD 118.9 million in R&D spending, equal to around 36.4% of revenue. Azbil invested JPY 12.7 billion in R&D, representing 4.2% of revenue, while capital investment reached JPY 8.0 billion. Overall, large electronics groups provide digital and connectivity capabilities, while pure-play seismic companies maintain deeper expertise in specialized field equipment.
Top Key Players in the Market
- Riverhawk
- PCB Piezotronics Inc.
- Geospace Technologies Corporation
- SiTime Corp.
- Azbil Corporation
- GeoSIG Ltd
- IMV Corporation
- Nanometrics
- Güralp Systems
- Sercel
- Gaiacode
- Lunitek
- Kinemetrics, Inc.
- Rogue Seismic
Recent Developments
- In 2026, Geospace Technologies secured an approximately USD 2.0 million contract in August to supply a Canadian engineering firm with a 20-level OptoSeis Insight system. The fibre-optic, high-temperature downhole seismic system is scheduled for delivery early in the first quarter of fiscal 2027.
- In 2025, Nanometrics entered a strategic partnership with KUM on June 3 to provide turnkey passive seismic monitoring for offshore oil and gas and carbon capture and storage projects. The partnership immediately supported the Greensand Future project, which aims to store up to 8 million tonnes of CO₂ per year by 2030. KUM has participated in more than 400 offshore expeditions across 39 countries.
Report Scope
| Report Features | Description |
|---|---|
| Market Value (2025) | USD 752.0 million |
| Forecast Revenue (2035) | USD 1,438.4 million |
| CAGR (2026-2035) | 6.7% |
| Base Year for Estimation | 2025 |
| Historic Period | 2020-2024 |
| Forecast Period | 2026-2035 |
| Report Coverage | Revenue Forecast, Market Dynamics, Competitive Landscape, Recent Developments |
| Segments Covered | By Sensor Type (Geophones, Seismometers, Accelerometers, Data loggers, Sensor arrays, Others); By Technology (Digital Sensors, Analog Sensors, MEMS Sensors, Optical Sensors); By Application (Earthquake Monitoring, Volcanic Activity Monitoring, Structural Health Monitoring, Ambient Vibration Analysis, Induced Seismicity Monitoring, Others); By End Use (Oil and Gas, Mining and Construction, Aerospace and Defense, Government and Research Institutions, Others) |
| Regional Analysis | North America – US, Canada; Europe – Germany, France, The UK, Spain, Italy, Rest of Europe; Asia Pacific – China, Japan, South Korea, India, Australia, Singapore, Rest of APAC; Latin America – Brazil, Mexico, Rest of Latin America; Middle East & Africa – GCC, South Africa, Rest of MEA |
| Competitive Landscape | Riverhawk, PCB Piezotronics Inc., Geospace Technologies Corporation, SiTime Corp., Azbil Corporation, GeoSIG Ltd, IMV Corporation, Nanometrics, Güralp Systems, Sercel, Gaiacode, Lunitek, Kinemetrics Inc., Rogue Seismic |
| Customization Scope | Customization for segments and region/country-level will be provided. Moreover, additional customization can be done based on the requirements. |
| Purchase Options | We have three licenses to opt for: Single User License, Multi-User License (Up to 5 Users), Corporate Use License (Unlimited Users and Printable PDF) |





































