


Report Overview
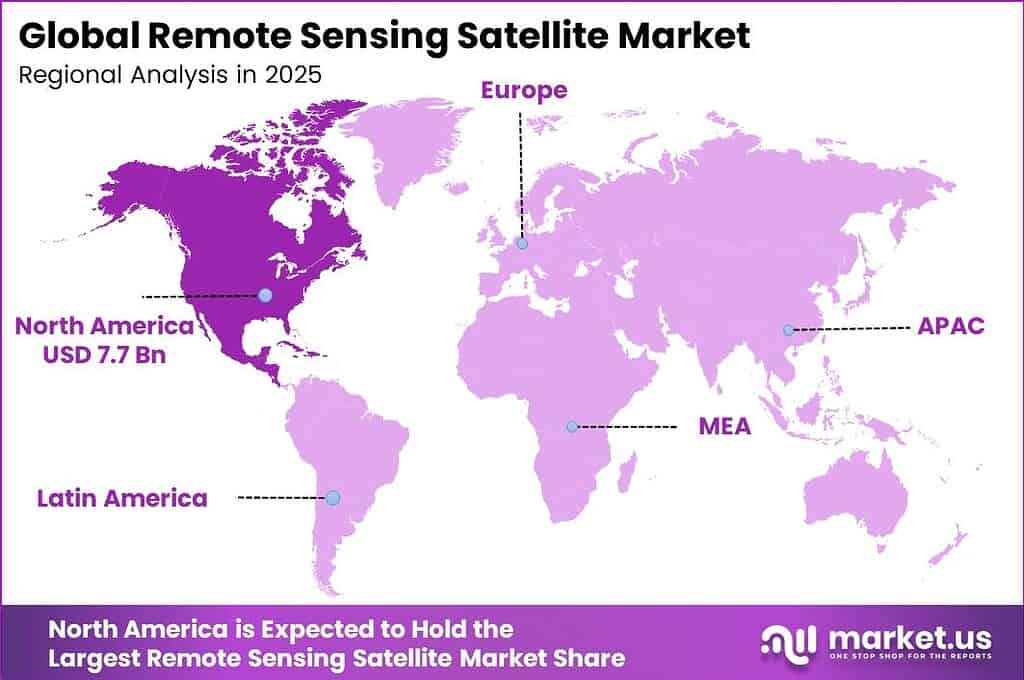
The Global Remote Sensing Satellite Market size is expected to be worth around US$ 20.5 billion by 2025, growing at a CAGR of 10% during the forecast period from 2026 to 2035, reaching US$ 53.2 billion by 2035. North America held a dominant market position, capturing more than a 37.7% share, holding US$ 7.72 billion in revenue.
Remote sensing satellites represent sophisticated space-based platforms carrying optical sensors, synthetic aperture radars, and hyperspectral systems capable of generating constant geospatial information regarding the earth’s surface, atmosphere, and oceanic areas. Remote sensing satellites are vital sources of data in the sectors of defense and intelligence, agriculture, climate monitoring, urban planning, emergencies, and marine industry applications — offering earth observation data of a quality not achievable by any ground or airborne sensing method. Satellite technology covers optical, SAR, hyperspectral, and multispectral categories operating within LEO, MEO, and GEO orbits weighing between less than 500 kg to more than 1,000 kg.
Key Takeaways
- The Global Remote Sensing Satellite Market is projected to have a market valuation of US$ 20.5 billion by 2025.
- The Global Remote Sensing Satellite Market will have a total market value of US$ 53.2 billion by 2035.
- It will experience a CAGR of 10% during the forecast period of 2026 and 2035.
- Optical Imaging Satellites led the satellite type category with a 45.9% market share in 2025.
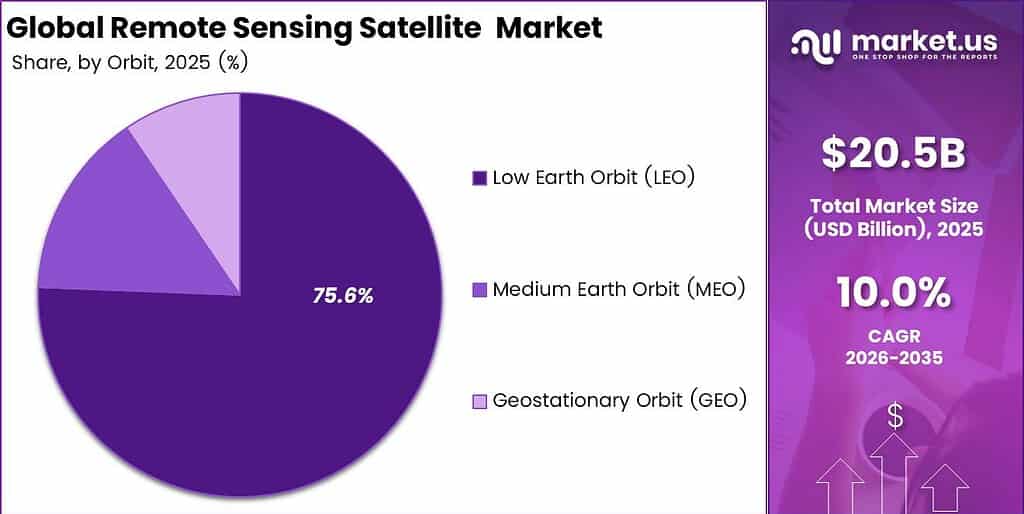
- Low Earth Orbit (LEO) dominated the orbit category with the market share of 75.6% due to increasing proliferation of small satellite constellations and reduction in launch prices on rideshare basis.
- Defense, Intelligence & Border Security dominates the largest application category share with 30.4% due to increased ISR procurement requirements and multi-year defense budgets by the sovereign.
- Governments & Defense Agencies dominated the largest market share of 55.3% in the end user category based on multi-year satellite procurement programs worldwide by sovereigns.
- The payload class under 500 kilograms contributes 55.2% towards overall market share on account of standardized production lines of CubeSats and economic rideshare launches costing below US$ 5,500/kg.
- The North American region has the biggest market share with 37.7% of the Remote Sensing Satellite Market. This is because of the high demand for imaging from US Department of Defense, NGA Commercial contracts, and presence of high commercial LEO constellations.
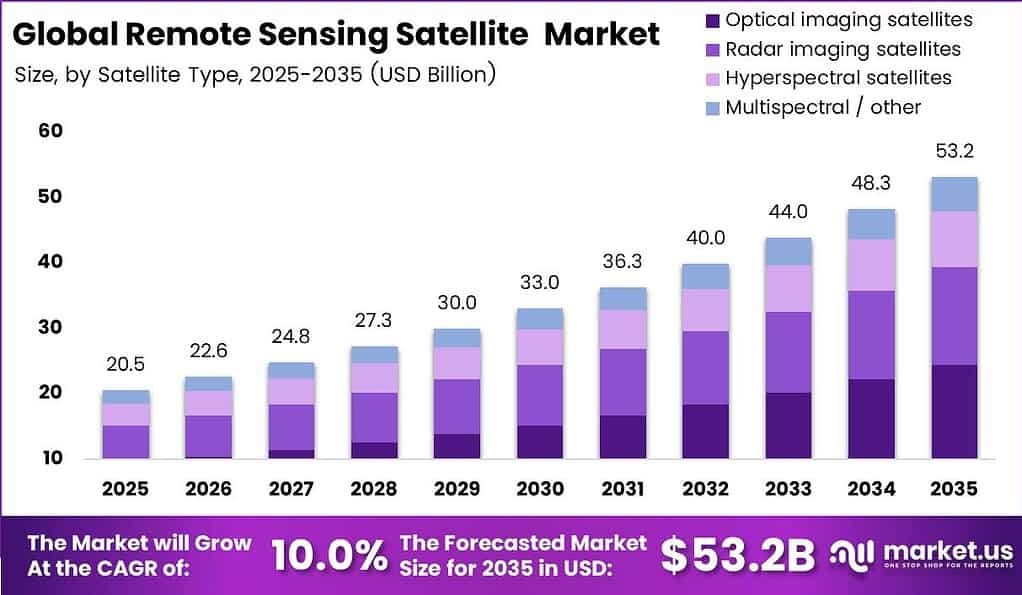
The development of the worldwide remote sensing satellites market is fueled by increasing demands from defense agencies as well as intelligence agencies that seek to establish persistent and high resolution earth observations, expansion of commercial and climate applications in agricultural sectors, and decreasing cost of launching small satellites that allow building of constellations.
- For instance, in March 2026, Maxar Technologies successfully commissioned WorldView Legion-3, its revolutionary high-resolution optical satellite with under 30 centimeters of imagery and revisit capabilities of less than 90 minutes for global imaging. This move has placed the firm in the leading role in supplying satellite imagery services to the National Geospatial Intelligence Agency and related defense agencies.
Satellite Type Analysis
Optical Imaging Satellites Dominate Market through High Resolution and Commercial Versatility
The Optical Imaging Satellites segment is the market leader in terms of satellite type with 45.9% of the total market revenue in 2025. According to the Satellite Industry Association’s 2025 State of the Satellite Industry Report, a record 2,695 satellites were launched globally in 2024, with remote sensing payloads including optical imaging systems representing one of the fastest-growing payload categories, serving a broad base of customers including defense intelligence agencies, urban planners, commodity traders, insurers, and environmental regulators. The sub-50 cm panchromatic resolution capability does not require any further processing and can be used by consumers immediately on applications like ArcGIS, Google Earth Engine, and other commercial analytic APIs, thus making Optical Data the first choice for purchase by the maximum number of consumers.
- The Planet Labs company’s 200+ Dove satellites provided global maps with a resolution of 3–5 meters on a daily basis in 2025, serving the USDA crop monitoring programs and European Space Agency’s Copernicus programs, thus indicating the commercial success in terms of subscription purchases needed for the dominance of optical satellites.
The radar imaging satellites (SARS) have 28.1% market share, backed by the growing demands for all-weather and all-day business surveillance applications from defense, maritime, and flood insurance industries. On the other hand, hyperspectral satellites capture 16.2% of the market revenue, catering to mineral exploration and agriculture software-as-a-service customers.
Orbit Analysis
LEO Orbit Dominates Market Due to Lower Costs and Faster Revisit Rates
Low Earth Orbit (LEO) dominates at 75.6% of the orbit segment in 2025. This orbit’s dominance stems from the global trend towards smallsat constellation systems driven by affordable rideshare launches and orbital altitudes below 600 km that can provide imagery resolution unattainable at the geosynchronous orbit altitude. The Planet Labs, BlackSky, Capella Space, and Satellogic LEO constellations have managed to shorten their average revisit rate to less than 3 hours for optical and to 1 hour for SAR, the timeframe necessary to satisfy defense ISR users, precision agriculture applications, and commodity traders.
- The global small satellite launch market hit the record of 2,877 satellites launched in 2024, with 94.3% in LEO and 31% having remote sensing payloads, which proves the underlying drivers of the dominance of LEO as a part of the orbit segment worth 75.6% in value.
Medium Earth Orbit (MEO) represents 14.9% of the orbit segment and serves mainly navigation augmentation, SIGINT, and wide-area imagery for mid-resolutions. GEO occupies 9.5% of the segment and provides persistent weather monitoring services as well as government surveillance procurements.
Application Analysis
Defense and Intelligence Applications Dominate Market through Sovereign Security Investments
Defense, Intelligence & Border Security boasts the highest application share of 30.4%. Government users of national security namely military commands, border forces, and intelligence agencies from the US, UK, France, India, South Korea, and the Middle East Gulf countries purchase optical, SAR, and hyperspectral imagery pursuant to multiyear classified and unclassified agreements, funded by government defense budgets completely decoupled from the ups and downs of civilian economies. The NGA EnhancedView Follow on program, the UK MOD Skynet family, and the NATO alliance wide imagery sharing initiatives ensure steady procurement levels making this application segment the backbone of the industry for the next decade.
- SpaceX’s Transporter-11 mission in August 2024 carried 116 payloads, including 36 Planet Labs SuperDove remote sensing satellites, to Sun-synchronous LEO at US$ 5,500/kg — demonstrating how affordable rideshare access has made LEO the default orbit for commercial remote sensing constellations and the key driver behind its 75.6% segment share.
Earth Observation (Civil) is the fastest-growing application, powered by urban planning experts and civil government officials. Environmental & Climate Monitoring, Agriculture & Forestry, Mapping & Navigation, and Disaster Management & Emergency Response are responsible for the rest 69.6% of the overall application revenue share.
Payload Analysis
Smallsat Payload Segment Dominates Market through Cost-Effective Constellation Scalability
Small payloads, weighing less than 500 kilograms, account for the largest share of the payload market at 55.2% of total market revenue in 2025. SpaceX Transporter rideshare prices below US$ 5,500/kg have made it economically possible to send out hundreds of satellite payloads that subscribe imagery services to commercial agricultural firms, commodities hedge funds, InsurTech services, and governments at commercially sound unit economics. Satellites weighing less than 500 kilograms provide sub-50 cm optical imagery, all-weather SAR imaging, and onboard AI inference intelligence solutions that were only available through billion-dollar government programs.
- SpaceX’s Transporter-11 mission, launched on August 16, 2024, carried 116 payloads including those for Planet Labs, Satellogic, and HawkEye 360, priced at US$ 5,500/kg — demonstrating how low rideshare launch costs have contributed to the 55.2% market revenue held by the small payload segment.
Satellites weighing between 500 kg and 1,000 kg make up roughly 26.9% of revenues. Such satellites are reserved for premium government reconnaissance programs and commercial users requiring premium quality images, such as Airbus Pleiades Neo enterprise customers. Large payloads, above 1,000 kilograms, make up 17.9%. These include NRO programs, French CSO reconnaissance satellites, and meteorological procurement organizations operating in geostationary orbit.
End User Analysis
Government and Defense Agencies Dominate Market through Long-Term Procurement Programs
Government & Defense Agencies represent the dominant end-user segment at 55.3% of market revenue, equivalent to US$ 11.35 billion in 2025. Their structural leadership reflects multi-year budget-backed procurement contracts from defense ministries, national space agencies (NASA, ESA, ISRO, JAXA), intelligence communities, and environmental regulators — the highest-value, most contract-stable consumer class in the market. Government buyers procure satellite data under 3–7 year service agreements, providing revenue visibility unmatched by commercial customers. Intergovernmental frameworks including EU Copernicus, US Civil Applications Committee, and bilateral imagery-sharing agreements further amplify aggregated institutional demand.
- India’s ISRO received a US$ 1.98 billion allocation in the FY2026 Union Budget announced in February 2025, with US$ 680 million ring-fenced for Earth observation satellite development, illustrating the sovereign procurement scale driving the 55.3% government end-user dominance.
Commercial Operators & Service Providers hold approximately 33.5% share and are the fastest-growing end-user category, as geospatial SaaS platforms, precision agriculture firms, logistics operators, and InsurTech companies integrate satellite data APIs into commercial workflows. Research & Academic Organizations account for the remaining 11.2%, primarily consuming free-tier Sentinel-2 and Landsat-9 open-data programs.
Key Market Segments
By Satellite Type
- Optical Imaging Satellites
- Radar Imaging Satellites (SAR and Other Radar)
- Hyperspectral Satellites
- Multispectral / Other Satellites
By Orbit
- Low Earth Orbit (LEO)
- Medium Earth Orbit (MEO)
- Geostationary Orbit (GEO)
By Application
- Defense, Intelligence, and Border Security
- Earth Observation
- Environmental and Climate Monitoring
- Agriculture and Forestry
- Mapping and Navigation
- Disaster Management and Emergency Response
By Payload
- Less than 500 kg
- 500 kg to 1,000 kg
- Above 1,000 kg
By End User
- Government and Defense Agencies
- Commercial Operators and Service Providers
- Research and Academic Organizations
Drivers
Rising Defense Spending and ISR Programs Drive Satellite Imagery Demand
Global spending on defense rose to a high of US$ 2.44 trillion in 2024, placing satellite-based ISR in the Tier-1 procurement category for NATO, Indo-Pacific, and GCC countries. Insights gained during the Russia-Ukraine war were the driving force behind 32 countries creating or expanding their own sovereign imagery programs by 2026. The NGA’s EnhancedView Follow-On (EVFO) program is worth more than US$ 3.5 billion between 2024 and 2029, providing an anchor of revenue through the forecast period. The new 2024 NATO collective space policy underscores the cooperation and allied imagery sharing, adding to the overall demand.
- In the 2026 US Space Force President’s Budget Request for FY2026, US$ 4.8 billion was allocated for space-based ISR and Earth Sensing Programs, reflecting a 19% rise over FY2025 figures. New NGA imagery contracts worth a total of US$ 2.1 billion were awarded to Maxar Technologies and Planet Labs in Q4 2025, representing a quantification of the sovereign imagery procurement pipeline through 2035.
Smallsat Constellations and Affordable Launch Services Expand Remote Sensing Market
Commoditization of satellite manufacturing using standard CubeSat platforms (3U, 6U, 12U) and smallsat production lines, where Planet Labs manufactures satellites in its Dove line at a price of less than US$ 2 million each compared to the US$ 250–500 million cost of large-format reconnaissance satellites, has resulted in major changes in market economics. SpaceX’s Falcon 9 Transporter series reduced commercial launch costs to less than US$ 5,500/kg to LEO by 2024, making constellation deployments commercially viable for operators that were previously unable to secure financing for space missions. These shifts in economic conditions attracted over US$ 8.4 billion in equity funding for commercial remote sensing enterprises globally between 2020 and 2025, reflecting sustained investor confidence in the smallsat earth observation sector as it transitions from early-stage ventures to scalable, subscription-driven data businesses.
- In January 2025, SpaceX’s Transporter-12 flight carried 138 spacecraft that included 23 remote sensing satellites using optical, SAR, and RF intelligence sensors at an industrialized launch pricing rate of US$5,500/kg, showing how the commercial launch capability makes the small satellites weighing sub-500 kg responsible for 55.2% payload share.
Restraints
Orbital Congestion, Regulatory Complexity, and Environmental Constraints Challenging the Remote Sensing Satellite Market
The growing problem of orbital congestion in low earth orbit, where the active number of satellites had reached 9,000 by 2025, has created an exponentially escalating requirement for collision avoidance maneuvers, which have been on the rise at a rate of 340% between 2020 and 2025, causing annual premium rates for spacecraft insurance to increase by 18-22%. The overhead cost rises are putting pressure on operator margins and creating deployment costs for the newcomers who wish to compete with the existing players in the already congested altitude ranges. Market entry issues arise due to coordination through the ITU in terms of launching satellites at least five years in advance, along with negotiation of landing rights with over 140 regulatory jurisdictions.
Continuous cloud cover in tropical areas, covering 60-70% of equatorial Africa, south Asia, southeast Asia, and the Amazon, makes optical satellite imagery structurally unavailable for use in agriculture, deforestation, and disaster relief applications in the world’s most rapidly developing markets, making changes to satellite constellation technology to accommodate SAR radar imaging necessary.
- For instance, in 2024, Planet Labs reported that cloud cover caused a decline in the availability of usable optical images for agricultural monitoring contracts in Southeast Asia by 58% in the month of monsoons, which forced the company to speed up the process of integrating SAR radar data partnerships in order to stay in line with their Service Level Agreement terms.
Opportunity
Growth in SAR, Hyperspectral, and New Space Programs Creating Major Remote Sensing Market Opportunities
The commercialization of SAR all-weather satellite constellations creates a major growth potential, owing to the natural transition from optical imagery-based processes to the use of SAR in applications like maritime domain awareness, Arctic sovereignty surveillance, and infrastructure monitoring. The development of hyperspectral satellite imaging, spearheaded by companies like Satellogic and HySpecIQ, generates new avenues of revenue through the provision of services like precision agriculture, pollution detection, and mining exploration.
Space programs by sovereign nations such as UAE, Saudi Arabia, Indonesia, Vietnam, and Nigeria provide new opportunities for procurement not only for established aerospace manufacturers but also for satellite firms. With the advent of intelligence through subscription-based services, satellite firms have been able to broaden their addressable markets, moving from strictly military or governmental clients to commercial clients involved in agriculture, insurance, and logistics.
- For instance, by December 2024, Planet Labs and ESA Copernicus together achieved more than 300,000 paid subscriptions to their respective satellite imagery data services, with agricultural monitoring, insurance risk assessment, and logistics route optimization emerging as the three fastest-growing user segments.
Trends
In-Orbit AI, Data Fusion, and Satellite Connectivity Reshaping the Remote Sensing Satellite Market
There are three critical trends driving changes in the remote sensing satellite industry out to 2035. First, onboard AI processing using edge computing for LEO satellites is allowing real-time object detection and data compression in orbit, resulting in an 80% reduction in downlink bandwidth usage and sub-30-minute tasking to delivery cycles, revolutionizing responsiveness in commercial earth observation systems for use by defense and emergency response agencies.
Additionally, SAR/optical data fusion services providing all-weather SAR data with optical image validation are earning premium prices between 2.5 and 4 times higher than normal single sensor data pricing. Third, direct to device connectivity with SpaceX Starlink DTC and AST SpaceMobile is facilitating agricultural monitoring and disaster alerts sent directly to developing countries with constrained bandwidth resources, representing an addressable market of about 3.2 billion customers by 2035.
- For instance, in May 2024, Capella Space deployed AI-powered automated processing across its SAR constellation, enabling faster change detection alerts for US defense intelligence customers and reducing reliance on traditional ground-processing workflows.
Geopolitical Impact Analysis
Geopolitical Tensions, Export Controls, and Space Militarization Reshape Satellite Supply Chains
The remote sensing satellite technology market finds itself at the juncture of geopolitics, security interests, and technology rivalry. As such, this market is likely more geopolitically charged than nearly any other technology market on Earth. The US-China strategic rivalry has created fragmentation within the global satellite manufacturing supply chain, forcing China to develop an entirely separate technology ecosystem for its Gaofen and Yaogang programs due to the ITAR/EAR restrictions placed on imaging sensors, focal plane assemblies, and radiation-hardened components at the same time limiting the ability of Western companies to take advantage of the low-cost satellite manufacturing capabilities of Chinese providers. The Ukraine-Russia conflict highlighted the value of commercially acquired satellite imagery on the battlefield, leading to adoption of satellite image acquisition capabilities by 32 NATO-aligned governments by 2026.
U.S. tariffs applied to satellite electronics in 2025 resulted in an increase in the hardware prices between 8-14% for constellation companies with multinational operations. This prompted the development of alternative supply chains from the Indian NewSpace industry, the South Korean Satellite Initiative, and European players like OHB and Thales Group. Programs under GCC Vision 2030 are also establishing satellite manufacturing capabilities in UAE and Saudi Arabia.
- For instance, in 2024, US tariffs on satellite components led Maxar Technologies to accelerate supplier diversification toward European and South Korean sources to offset rising hardware procurement costs.
Regional Analysis
North America as the Leading Market Due to Strong Defense and Commercial Satellite Ecosystem
North America accounts for the largest share of the global revenue pool with a contribution of 37.7%, earning the region US$ 7.72 billion in revenue in 2025 on the back of the U.S., which accounts for the largest combined government and commercial earth observation market in the world. The leadership of North America in the global remote sensing satellite market is attributed to the combined annual spending on satellite images by the DoD, NGA, and Intelligence Community in excess of US$ 6 billion per year, the presence of the largest number of LEO constellation providers globally, such as Planet Labs, Maxar, BlackSky, Capella Space, HawkEye 360, and Umbra, along with NASA’s NISAR project, NOAA’s Weather Satellites project, and the Agriculture crop management project by the USDA.
- For instance, in March 2026, the company Maxar Technologies successfully conducted an on-orbit commissioning of the WorldView Legion-3 satellite, which provides images at resolutions less than 30 cm with global revisit time of less than 90 minutes and activated the company’s advanced imagery acquisition agreement contract with the NGA right away for its priority access rights.
Asia Pacific is the fastest-growing region, at CAGR 11.4%, on account of China’s Gaofen and Yaogan Constellation mission series, India’s EOS and RISAT series expansions, Japan’s ALOS-4 initiative, and South Korea’s KOMPSAT series of satellites. Europe is home to 24.8% of market share based on the ESA Sentinel mission of the Copernicus program. The Middle East & Africa region records CAGR 10.1%, led by UAE and Saudi Vision 2030 sovereign earth observation projects, as well as the growth of national space agencies in Africa.
Key Regions and Countries Covered in this Report:
- North America
- U.S.
- Canada
- Europe
- Germany
- France
- U.K.
- Italy
- Spain
- Russia & CIS
- Rest of Europe
- Asia Pacific
- China
- Japan
- South Korea
- India
- ASEAN
- Rest of Asia Pacific
- Latin America
- Brazil
- Mexico
- Rest of Latin America
- Middle East & Africa
- GCC Countries
- South Africa
- Rest of Middle East & Africa
Moderate levels of market concentration characterize the Remote Sensing Satellite Market, with a combination of traditional defense aerospace primes, dedicated commercial imaging companies, and newer data analytics platforms taking the lead positions. The key market leaders such as Maxar Technologies, Airbus Defence and Space, Planet Labs, Lockheed Martin, Northrop Grumman, and Thales Alenia Space compete against each other through the means of satellite imagery quality (resolution), revisit rates, spectral diversity, AI-driven analytics solutions, and secure credentials. Competitive advantages that separate key companies from their peers include a high optical resolution (less than 30 cm), all-weather SAR imaging, image acquisition to delivery time (latency), and cloud-based data delivery via APIs. As the industry evolves from transactional to service-oriented, competitive advantages also include subscription-based intelligence solutions and high gross margins (60-70%) offered by analytics platforms.
Market Key Players:
- Airbus Defence and Space
- Maxar Technologies Inc.
- Planet Labs PBC
- Lockheed Martin Corporation
- Northrop Grumman Corporation
- The Boeing Company
- Thales Alenia Space (Thales Group)
- China Aerospace Science and Technology Corporation (CASC)
- Indian Space Research Organisation (ISRO)
- Japan Aerospace Exploration Agency (JAXA)
- SpaceX
- Blue Canyon Technologies (a Raytheon / RTX company)
- Dhruva Space Pvt. Ltd.
- EnduroSat
- OHB SE
- L3Harris Technologies, Inc.
- BlackSky Technology Inc.
- Others
Key Developments:
- In March 2026, Maxar Technologies Inc. successfully commissioned its WorldView Legion-3 satellite, delivering sub-30 cm optical imagery with under 90-minute global revisit capability across priority tasking zones. This milestone secured a US$ 580 million NGA contract renewal, reinforcing Maxar’s position as the premier commercial imagery supplier to the US defense intelligence community and allied nation geospatial agencies seeking high-revisit precision earth observation capability.
- In February 2026, Planet Labs PBC announced the Pelican-2 high-resolution constellation expansion program covering 36 additional satellites, increasing global daily imaging capacity by 40% for defense and agricultural monitoring customers. This capacity expansion directly addresses growing government and commercial customer demand for higher temporal resolution earth observation data across persistent surveillance, crop monitoring, and infrastructure inspection application workflows.
- In January 2026, Airbus Defence and Space launched its Pleiades Neo-5 optical satellite, expanding its 30 cm resolution constellation to five active operational units and signing a €220 million contract with European defense agencies for priority tasking rights. This launch strengthens Airbus’s competitive positioning against US commercial constellation operators in the European defense and intelligence imagery procurement market through 2030.
Report Scope
| Report Features | Description |
|---|---|
| Market Value (2025) | US$ 20.5 Billion |
| Forecast Revenue (2035) | US$ 53.2 Billion |
| CAGR (2026-2035) | 10% |
| Base Year for Estimation | 2025 |
| Historic Period | 2020-2024 |
| Forecast Period | 2026-2035 |
| Report Coverage | Revenue Forecast, Market Dynamics, Competitive Landscape, Recent Developments |
| Segments Covered | By Satellite Type (Optical Imaging Satellites, Radar Imaging Satellites, Hyperspectral Satellites, Multispectral/Other), By Orbit (Low Earth Orbit, Medium Earth Orbit, Geostationary Orbit), By Application (Defense, Intelligence & Border Security, Earth Observation, Environmental & Climate Monitoring, Agriculture & Forestry, Mapping & Navigation, Disaster Management & Emergency Response), By Payload (Less than 500 kg, 500 kg to 1,000 kg, Above 1,000 kg), By End User (Government & Defense Agencies, Commercial Operators & Service Providers, Research & Academic Organizations) |
| Regional Analysis | North America – The US & Canada; Europe – Germany, France, The UK, Spain, Italy, Russia & CIS, Rest of Europe; APAC – China, Japan, South Korea, India, ASEAN & Rest of APAC; Latin America – Brazil, Mexico & Rest of Latin America; Middle East & Africa – GCC, South Africa & Rest of MEA |
| Competitive Landscape | Airbus Defence & Space, Maxar Technologies, Planet Labs, Lockheed Martin, Northrop Grumman, Boeing, Thales Alenia Space, CASC, ISRO, JAXA, SpaceX, Blue Canyon Technologies, Dhruva Space, EnduroSat, OHB SE, L3Harris, BlackSky Technology, Others |
| Customization Scope | Customization for segments, region/country-level will be provided. Moreover, additional customization can be done based on the requirements. |
| Purchase Options | We have three licenses to opt for: Single User License, Multi-User License (Up to 5 Users), Corporate Use License (Unlimited Users and Printable PDF) |





























