


Report Overview
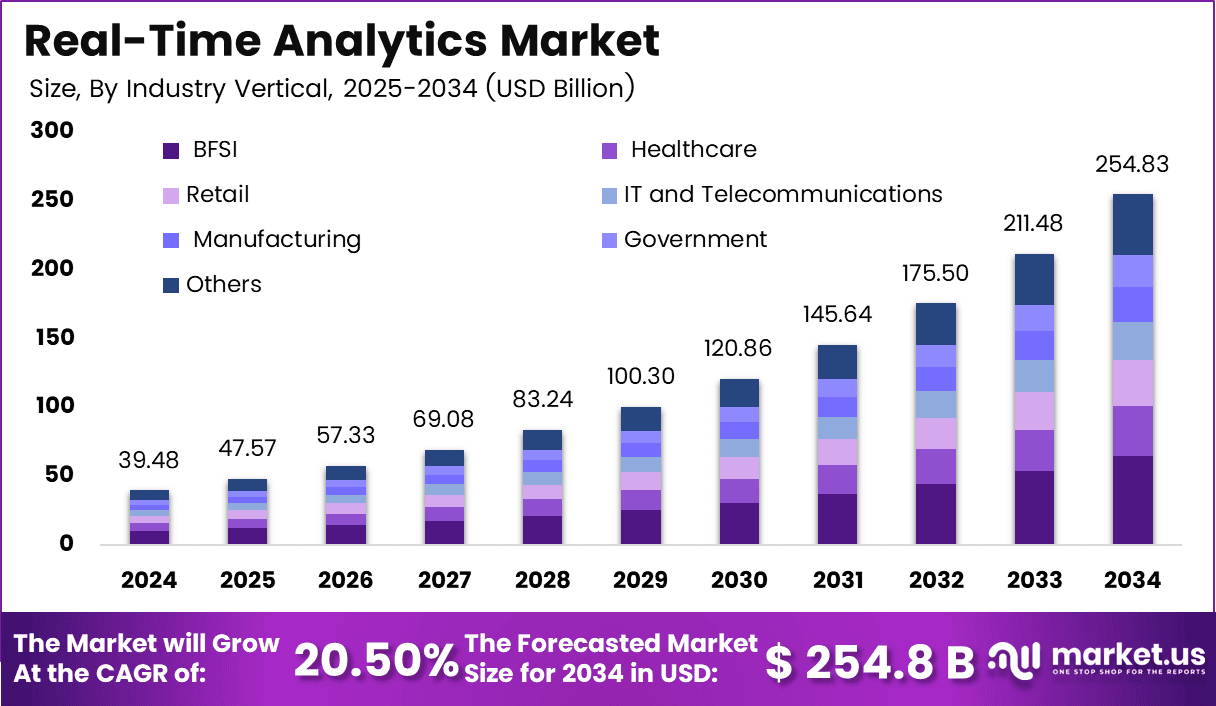
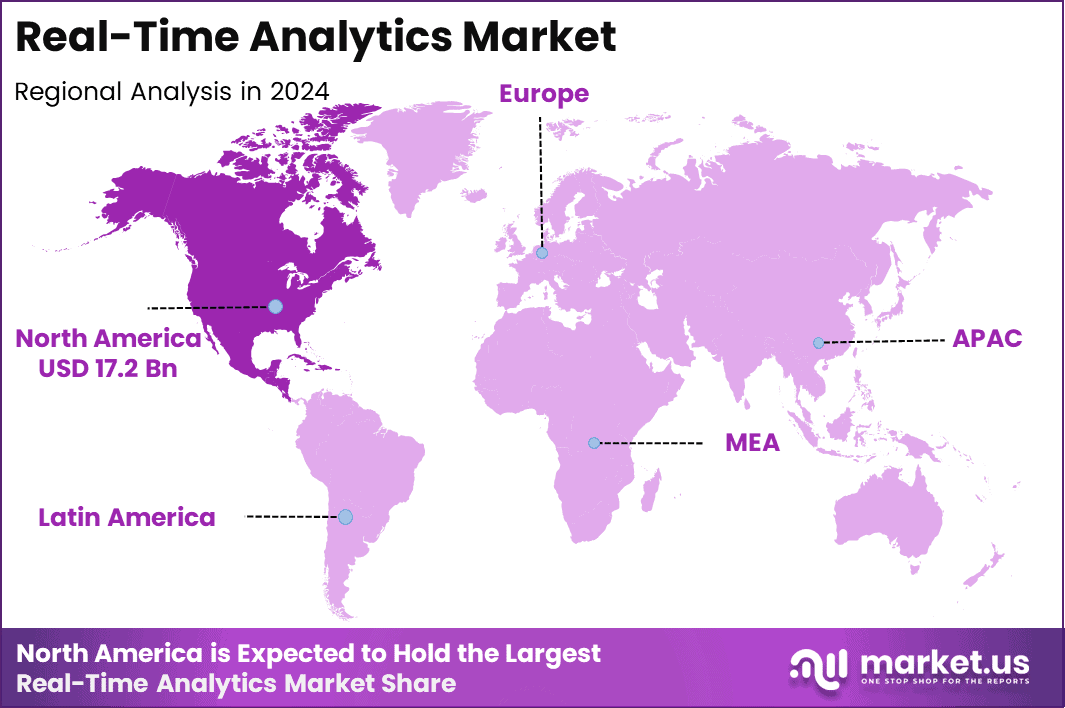
The Global Real-Time Analytics Market stands at USD 39.4 billion in 2024 and will reach USD 254.8 billion by 2034, growing at a CAGR of 20.5% during the forecast period 2025 to 2034. Digital activity creates the raw material for this market. North America leads with a 43.6% share and USD 17.2 billion in 2024 revenue.
According to the ITU, about 6 billion people used the internet in 2025, up from a revised 5.8 billion in 2024, while 2.2 billion people remain offline and represent future demand. Every new user adds payment events, clickstreams, and device signals that firms must score in milliseconds.
The compute needed to process those streams is growing just as fast. The IEA reports that electricity use by data centres will roughly double from 485 TWh in 2025 to about 950 TWh in 2030, near 3% of world demand. Banks, retailers, and telecom carriers buy streaming platforms to turn that capacity into instant decisions on fraud, pricing, and network faults.
North American region hosts the platform owners who set the technical standard for streaming data. Their own filings show the scale of commitment. The four largest US cloud operators are guided to as much as USD 630 billion of capital spending in 2026, about 62% above the record USD 388 billion they spent in 2025. That spending lands mostly in US and Canadian campuses, so American enterprises get first access to new streaming engines, vector search, and event-driven services.
Key Takeaways
- The Real-Time Analytics Market holds a value of USD 39.4 billion in 2024 and will reach USD 254.8 billion by 2034. Revenue will expand at a CAGR of 20.5% between 2025 and 2034.
- Solutions and platforms lead the component segment with a 70.4% share.
- Cloud leads the deployment mode segment with a 75.2% share.
- Large enterprises lead the organization size segment with a 65.8% share.
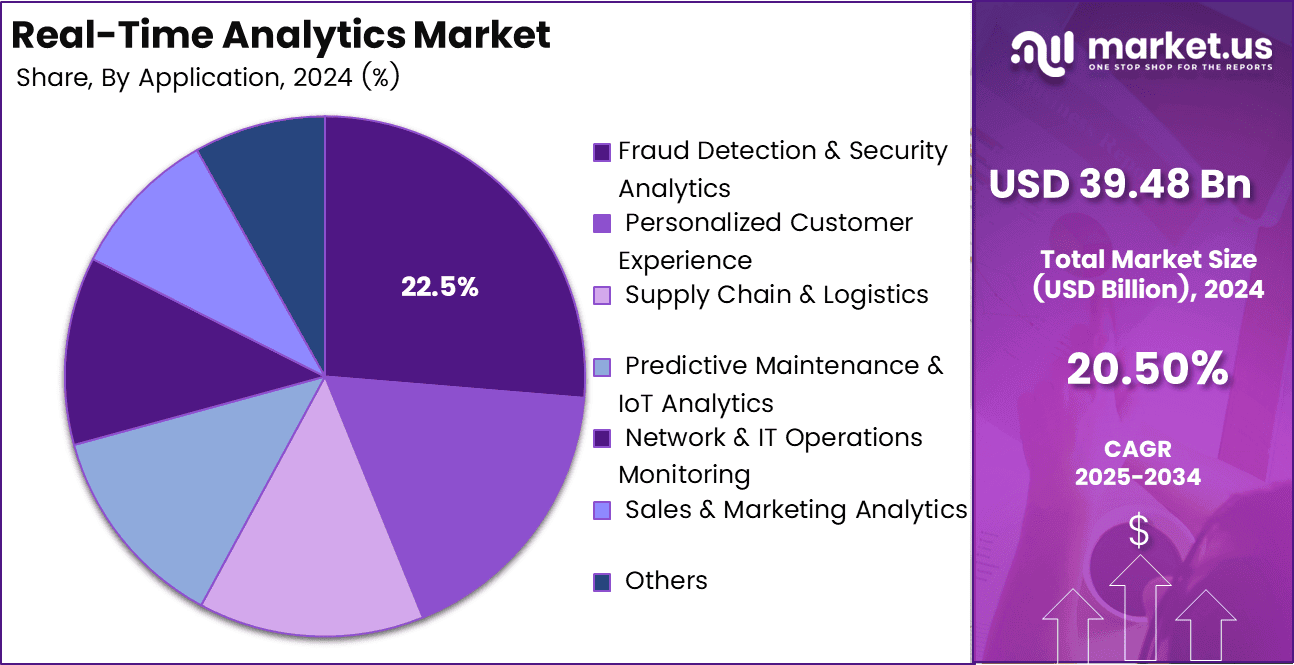
- Fraud detection and security analytics leads the application segment with a 22.5% share.
- BFSI leads the industry vertical segment with a 25.3% share.
- North America dominates with a 43.6% share and USD 17.2 billion in revenue.
By Component
Solutions/Platforms dominate with 70.4% due to centralized live data processing and decisions.
Solutions and platforms lead because buyers need one core system that collects event streams, applies rules or models, and sends alerts within seconds. A platform also gives teams shared controls for data access, quality, dashboards, and links to business software.
Cisco reported that security product revenue rose 59% in fiscal 2025, while observability product revenue grew 26%, showing strong demand for packaged tools that detect threats and explain system behavior. Services, especially managed services, should grow fastest as firms struggle to connect old databases, cloud apps, sensors, and new AI tools.
Accenture recorded $5.9 billion in generative AI bookings and $2.7 billion in related revenue during fiscal 2025. Those figures show that clients increasingly pay outside experts to turn advanced platforms into working business processes. Consulting and integration gain at the start of projects, while managed services gain later through monitoring, model updates, security work, and round-the-clock support.
By Deployment Mode
Cloud dominates with 75.2% due to elastic capacity and faster global access.
Cloud leads because real-time workloads rise and fall quickly, and providers can add computing power without long hardware buying cycles. Companies also connect branches, mobile apps, partner systems, and online channels more easily through shared cloud services.
Eurostat found that 52.7% of EU enterprises bought cloud computing services in 2025, an increase of 7.4 percentage points from 2023. Firms used these services for email, file storage, databases, security, and application development, which creates a ready base for live analytics. Cloud should also post the fastest growth because AI models, streaming tools, and data warehouses increasingly work together in the same hosted environment.
The OECD reported average cloud use of 49% among firms with at least ten workers, but average big-data analytics use reached only 14%. That gap leaves ample room for companies to add analytics on top of cloud systems they already use. On-premises deployment will remain important for sensitive records, fixed industrial sites, and strict control needs, yet long setup times and limited capacity will slow expansion compared with cloud services.
By Organization Size
Large enterprises dominate with 65.8% due to high data volumes and complex operations.
Large enterprises lead because they handle millions of customer actions, machine signals, payments, and network events across many business units. They can fund data engineers, control teams, secure infrastructure, and continuous support, so they deploy real-time analytics across more use cases.
Eurostat reported that 98% of large EU businesses reached at least a basic level of digital intensity in 2024, compared with 73% of small and medium enterprises. That wide technology base helps large firms scale live dashboards, fraud checks, supply planning, and system monitoring.
The World Bank says SMEs represent about 90% of businesses and more than half of global employment, giving vendors a very large pool of new users. Ready-made links, low-code tools, and managed support further reduce skill needs. As payment systems, online stores, and connected operations produce more live data, SMEs can adopt focused services first, prove returns quickly, and then expand without building a large internal data department.
By Application
Fraud Detection and Security Analytics dominates with 22.5% due to rising digital fraud and instant threats.
Fraud detection and security analytics lead because banks, merchants, insurers, telecom operators, and public agencies must judge risky activity as it happens. The Federal Trade Commission said consumers reported more than $12.5 billion in fraud losses during 2024, up 25% from the prior year.
It also received 2.6 million fraud reports, which shows why organizations need continuous screening across large transaction flows. Predictive maintenance and IoT analytics should grow fastest as factories, utilities, fleets, and buildings add connected equipment.
These systems analyze heat, vibration, pressure, location, and power data before a failure stops work or harms quality. The International Federation of Robotics counted 4.664 million industrial robots operating worldwide in 2024, a 9% annual increase.
By Industry Vertical
BFSI dominates with 25.3% due to constant transactions and strict risk controls.
BFSI leads because banks, insurers, payment firms, and investment companies process large transaction flows that require instant checks and clear records. The World Bank reported that 79% of adults worldwide held a financial account in the latest Global Findex data, while 86% owned a mobile phone.
This broad digital reach creates constant payment and account activity, so financial firms need quick decisions at large scale. The US Centers for Medicare & Medicaid Services reported that national health spending rose 7.2% to $5.3 trillion in 2024, or $15,474 per person.
Key Market Segments
By Component
- Solutions/Platforms
- Services
- Consulting and Integration
- Managed Services
By Deployment Mode
- On-Premises
- Cloud
By Organization Size
- Small and Medium Enterprises
- Large Enterprises
By Application
- Fraud Detection and Security Analytics
- Personalized Customer Experience
- Supply Chain and Logistics
- Predictive Maintenance and IoT Analytics
- Network and IT Operations Monitoring
- Sales and Marketing Analytics
- Others
By Industry Vertical
- BFSI
- Healthcare
- Retail
- IT and Telecommunications
- Manufacturing
- Government
- Others
Geopolitical Impact Analysis
Trade policy now sits directly on the cost of streaming analytics hardware. The United States issued Proclamation 11002, applying a 25% ad valorem duty on advanced computing chips and derivative products that cross defined processing and DRAM bandwidth thresholds. A second US action set a 15% duty on polysilicon and listed derivatives, with a 10% rate for the United Kingdom.
The US Congressional Budget Office puts the current effective tariff rate at 10%, so importers of servers and networking gear carry a broad cost layer on top of chip-specific duties. The WTO expects world merchandise trade volume growth to slow to 0.5% in 2026 from 2.4% in 2025 and 2.8% in 2024, a lagged effect of higher tariffs. Thin trade growth raises the risk that buyers delay hardware refresh cycles and shift toward cloud subscriptions.
Logistics adds a second cost layer. Carriers still route Asia-to-Europe services around the Cape of Good Hope, which adds roughly 3,500 nautical miles and 10 to 14 days per voyage and has absorbed nearly 9% of global container fleet capacity. On the Far East to North Europe lane, spot rates sat at USD 2,586 per FEU in late December 2025, about 143% above October 2023 levels, with schedule reliability near 27.5%.
Longer, less reliable transits push data centre operators to hold buffer stock of racks and optics, which raises working capital. Power exposure matters too. The IEA notes data centres used about 415 TWh in 2024, near 1.5% of global electricity, after growing 12% each year for five years, so energy price swings feed straight into hosting prices for streaming workloads.
Regional Analysis
North America dominates the Real-Time Analytics Market, holding a 43.6% share and generating USD 17.2 billion in revenue. Three forces explain this position. First, grid and compute expansion sits in the region. The IEA expects US electricity use to add more than 420 TWh over the next five years, and data centres will drive about 50% of demand growth to 2030.
Asia Pacific ranks as the fastest-growing region in the Real-Time Analytics Market. India draws the heaviest new investment, with US hyperscalers committing nearly USD 57 billion to expand local data centre capacity, while Blackstone plans USD 30 billion through AirTrunk to build more than 5 GW over five years.
Europe holds the second-largest position, and public policy drives much of its growth. The European Commission opened a call for tenders in July 2026 to build up to seven AI Gigafactories, backed by as much as EUR 10 billion in EU and national funding and designed to unlock at least EUR 20 billion in private investment.
US Market Size
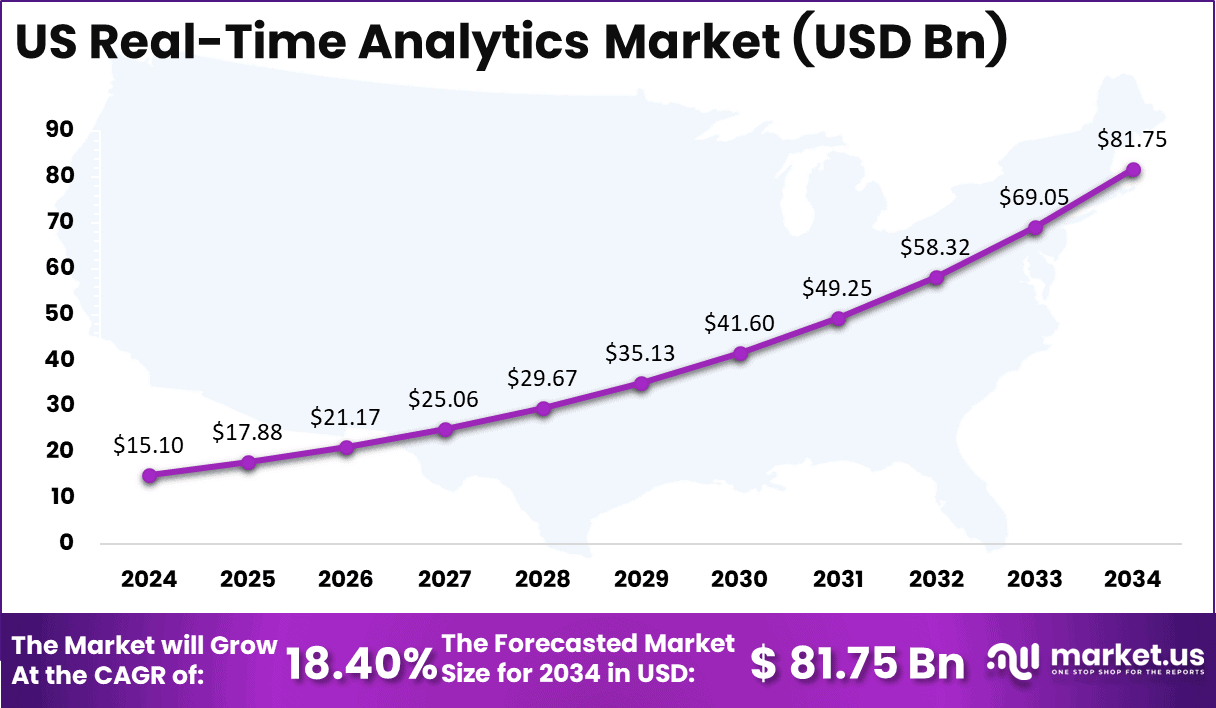
The US real-time analytics market is experiencing robust expansion, valued at USD 15.1 billion in 2024 and projected to reach USD 81.75 billion by 2034, growing at a CAGR of 18.4%. This strong upward trajectory is driven by the rising need for instant data processing, AI-powered insights, and IoT integration across industries.
Businesses are prioritizing real-time intelligence to gain competitive advantages in dynamic environments, particularly in sectors like BFSI, healthcare, IT, and manufacturing. The surge in cloud-based deployments and edge computing solutions is further accelerating adoption, as organizations seek scalable, cost-effective, and low-latency analytics capabilities.
Key Regions and Countries
North America
- US
- Canada
Europe
- Germany
- France
- The UK
- Spain
- Italy
- Rest of Europe
Asia Pacific
- China
- Japan
- South Korea
- India
- Australia
- Rest of APAC
Latin America
- Brazil
- Mexico
- Rest of Latin America
Middle East and Africa
- GCC
- South Africa
- Rest of MEA
Market Dynamics
Drivers
| Driver | (~) % Impact on CAGR Forecast | Geographic Relevance | Impact Timeline |
|---|---|---|---|
| Operational AI decision automation | +3.2% | Global; strongest in North America, Europe, East Asia | Short term (2 years or less) |
| Streaming cloud modernization | +2.6% | Global enterprise markets | Short term (2 years or less) |
| Industrial IoT telemetry growth | +2.3% | Asia-Pacific, North America, Europe | Medium term (2 to 4 years) |
| Fraud response acceleration | +1.9% | North America, Europe, Gulf markets, India | Short term (2 years or less) |
| Edge inference deployment | +1.7% | Manufacturing, logistics, telecom-intensive economies | Medium term (2 to 4 years) |
| Customer journey personalization | +1.4% | Retail-led economies worldwide | Short term (2 years or less) |
Operational AI decision automation
The decisive active demand catalyst is the migration from retrospective dashboards toward event-triggered operational decisions, because enterprises increasingly require analytics platforms to score transactions, recommend actions, and activate workflows while a customer interaction, payment, machine event, or network incident is still occurring.
Financial-crime programs under the Financial Action Task Force framework and operational-resilience obligations under the European Supervisory Authorities’ Digital Operational Resilience Act implementation further favor continuously monitored decision systems, supporting an estimated +3.2% incremental contribution to the stated 20.4% baseline CAGR rather than a one-off software refresh.
Restraints
| Restraint | (~) % Impact on CAGR Forecast | Geographic Relevance | Impact Timeline |
|---|---|---|---|
| Privacy compliance procurement blocks | -2.8% | Europe, North America, regulated Asian markets | Short term (2 years or less) |
| Constrained technology budgets | -2.1% | Global; acute among mid-market buyers | Short term (2 years or less) |
| Fragmented cross-border data rules | -1.8% | Europe, Asia-Pacific, Middle East, Latin America | Medium term (2 to 4 years) |
| Legacy contract lock-ins | -1.5% | North America, Europe, Japan | Medium term (2 to 4 years) |
| Cybersecurity approval delays | -1.3% | Global regulated sectors | Short term (2 years or less) |
| Public-sector procurement constraints | -1.1% | Europe, India, North America, emerging markets | Medium term (2 to 4 years) |
Privacy compliance procurement blocks
Privacy and data-use compliance can halt or materially defer a real-time analytics purchase when the intended use case requires combining live identity, location, behavioral, financial, health, or industrial data before consent architecture, retention controls, transfer mechanisms, and processor contracts are approved.
The immediate effect is deferred consumption revenue, higher pre-sales compliance cost, and pressure on gross-margin realization for cross-border deployments, warranting an estimated -2.8% deduction from the baseline CAGR in the most exposed regulated segments.
Challenges
| Challenge | (~) % CAGR Friction Drag | Geographic Relevance | Mitigation Horizon |
|---|---|---|---|
| Real-Time Data Quality | -2.5% | Global; highest in multi-cloud enterprises | Medium term (2 to 4 years) |
| Specialist Talent Scarcity | -2.0% | Global; acute in emerging digital hubs | Medium term (2 to 4 years) |
| Inference Cost Volatility | -1.8% | Global cloud-dependent deployments | Short term (2 years or less) |
| Distributed Systems Complexity | -1.6% | North America, Europe, East Asia | Medium term (2 to 4 years) |
| Edge Fleet Manageability | -1.4% | Industrial and logistics economies | Long term (4 years or more) |
| Model Drift Monitoring | -1.2% | Global AI-enabled operations | Medium term (2 to 4 years) |
Real-Time Data Quality
Real-time data quality remains a major restraint on market expansion because data from applications, sensors, payment systems, operational technology, and third-party feeds must be validated for accuracy, completeness, duplication, sequencing, identity matching, and late arrival.
These additional controls increase implementation costs, extend deployment timelines, and limit the adoption of fully automated decision-making. Organizations must establish reliable data ownership and governance before real-time analytics can be used at scale. Persistent data-quality challenges are estimated to create a -2.5% drag on the market’s attainable growth ceiling despite continued demand for real-time analytics solutions.
Opportunities
| Opportunity | (~) % Potential CAGR Upside | Geographic Relevance | Execution Window |
|---|---|---|---|
| Connected-product data marketplaces | +3.0% | Europe, North America, East Asia | Medium term (2 to 4 years) |
| Outcome-based industrial analytics | +2.5% | Industrial economies worldwide | Medium term (2 to 4 years) |
| Autonomous supply-chain control towers | +2.2% | Asia-Pacific, Europe, North America | Medium term (2 to 4 years) |
| Privacy-preserving analytics services | +1.9% | Europe, North America, healthcare-intensive markets | Long term (4 years or more) |
| SME embedded analytics channels | +1.7% | India, Southeast Asia, Latin America, Africa | Medium term (2 to 4 years) |
| Energy flexibility optimization | +1.5% | Europe, North America, Asia-Pacific | Long term (4 years or more) |
Connected-product data marketplaces
Here is the shortened version in 2 concise paragraphs:
Connected-product data marketplaces remain an untapped opportunity, as most manufacturers still use equipment telemetry mainly for maintenance and internal service operations. The EU Data Act, applicable since 12 September 2025, gives users rights to access connected-product data, including real-time data where technically feasible.
Standardized vertical solutions could reduce customer onboarding effort by around 20% to 35% and improve blended gross margins by approximately 5 to 10 percentage points at scale. Early development of cross-ecosystem data marketplaces could therefore provide an estimated +3.0% upside to the baseline CAGR.
Key Players Analysis
Tier 1 leaders own the infrastructure layer. AWS reported USD 128.7 billion in full-year 2025 revenue, up 19%, and lifted second quarter 2026 segment sales 37% to USD 42.2 billion with operating income of USD 16.6 billion.
Microsoft posted Microsoft Cloud revenue of USD 168.9 billion in fiscal 2025, up 23%, with Azure passing USD 75 billion and R&D spending of USD 32.5 billion, or 12% of revenue. Google Cloud runs near a USD 50 billion annual pace. Oracle spent USD 55.7 billion on capital in fiscal 2026 against a USD 50 billion target and guided to about USD 70 billion of net capital spending in fiscal 2027.
Enterprise software leaders convert that infrastructure into analytics demand. IBM earned USD 67.5 billion in 2025 revenue, with software revenue of USD 29.96 billion, up 10.6%, and invested more than USD 8.3 billion in R&D.
SAP recorded cloud revenue of EUR 21.02 billion in 2025, up 23%, on total revenue of EUR 36.8 billion and R&D expense of EUR 6.63 billion. Tier 2 challengers compete on specialized engines and services. Infosys agreed to buy two US firms for up to USD 560 million in March 2026. Amdocs, Impetus Technologies, ADA, and Stream Charts hold niche positions in telecom, data engineering, and streaming visualization.
Top Key Players in the Market
- Amazon Web Services (AWS)
- Microsoft Azure
- Google Cloud Platform (GCP)
- SAP
- Oracle
- IBM
- Informatica
- Amdocs
- Infosys
- Impetus Technologies
- MongoDB
- ADA
- Databricks
- Stream Charts
Recent Developments
- In February 2025, MongoDB acquired Voyage AI in a cash and stock deal valued at USD 220 million to add embedding and reranking models to MongoDB Atlas.
- In May 2025, Databricks agreed to acquire serverless Postgres company Neon for about USD 1 billion to support AI agent systems on its data and AI platform.
- In November 2025, Salesforce completed its acquisition of Informatica after agreeing to pay approximately USD 8 billion in equity value, or USD 25 per share in cash.
- In February 2026, Amazon raised planned 2026 capital expenditure by about 50% to USD 200 billion, up from USD 131 billion in 2025, with most of the spend directed at AWS data centre capacity.
- In April 2026, Google broke ground on its Visakhapatnam AI hub in Andhra Pradesh, the first gigawatt-scale site under a USD 15 billion India program running from 2026 to 2030 across three data centre campuses.
Report Scope
| Report Features | Description |
|---|---|
| Market Value (2024) | USD 39.4 Billion |
| Forecast Revenue (2034) | USD 254.8 Billion |
| CAGR (2025-2034) | 20.5% |
| Base Year for Estimation | 2025 |
| Historic Period | 2020-2023 |
| Forecast Period | 2025-2034 |
| Report Coverage | Revenue Forecast, Market Dynamics, Competitive Landscape, Recent Developments |
| Segments Covered | By Component (Solutions/Platforms, Services, Consulting and Integration, Managed Services); By Deployment Mode (On-Premises, Cloud); By Organization Size (Small and Medium Enterprises, Large Enterprises); By Application (Fraud Detection and Security Analytics, Personalized Customer Experience, Supply Chain and Logistics, Predictive Maintenance and IoT Analytics, Network and IT Operations Monitoring, Sales and Marketing Analytics, Others); By Industry Vertical (BFSI, Healthcare, Retail, IT and Telecommunications, Manufacturing, Government, Others) |
| Regional Analysis | North America – US, Canada; Europe – Germany, France, The UK, Spain, Italy, Rest of Europe; Asia Pacific – China, Japan, South Korea, India, Australia, Singapore, Rest of APAC; Latin America – Brazil, Mexico, Rest of Latin America; Middle East & Africa – GCC, South Africa, Rest of MEA |
| Competitive Landscape | Amazon Web Services (AWS), Microsoft Azure, Google Cloud Platform (GCP), SAP, Oracle, IBM, Informatica, Amdocs, Infosys, Impetus Technologies, MongoDB, ADA, Databricks, Stream Charts |
| Customization Scope | Customization for segments, region/country-level will be provided. Moreover, additional customization can be done based on the requirements. |
| Purchase Options | We have three licenses to opt for: Single User License, Multi-User License (Up to 5 Users), Corporate Use License (Unlimited Users and Printable PDF) |





























