


Report Overview
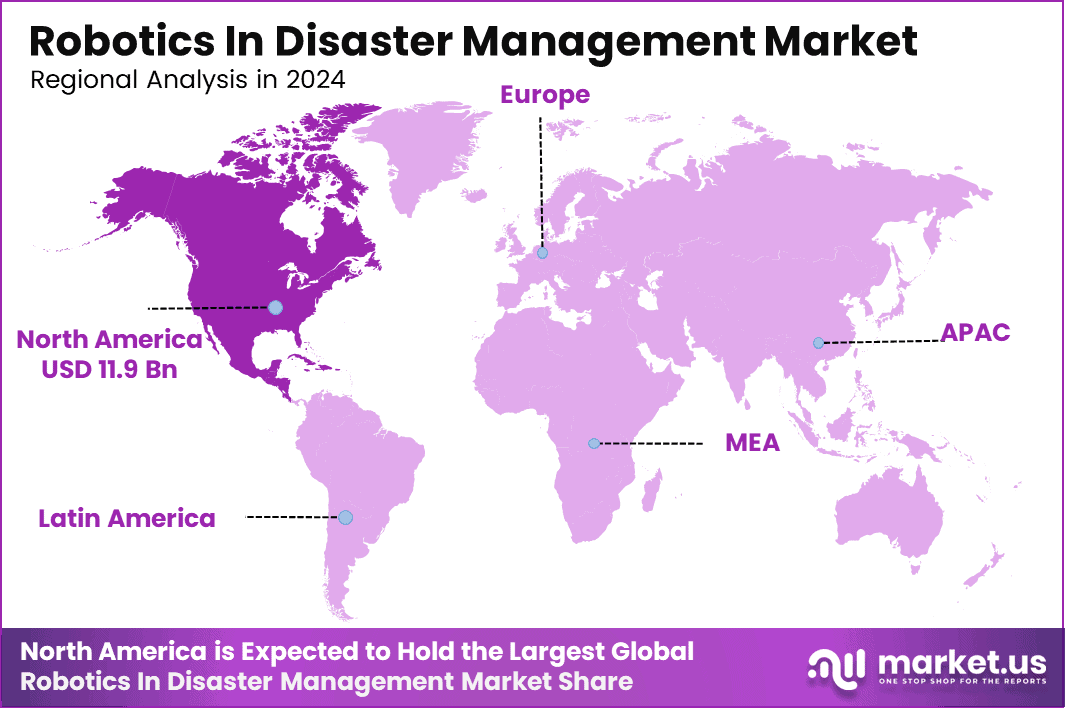
The Global Robotics In Disaster Management Market reached USD 28.4 billion in 2024 and will reach USD 126.3 billion by 2034, based on the supplied market estimate. This represents a 16.1% CAGR from 2025 to 2034. North America led the market with a 42% share and USD 11.9 billion in 2025 revenue.
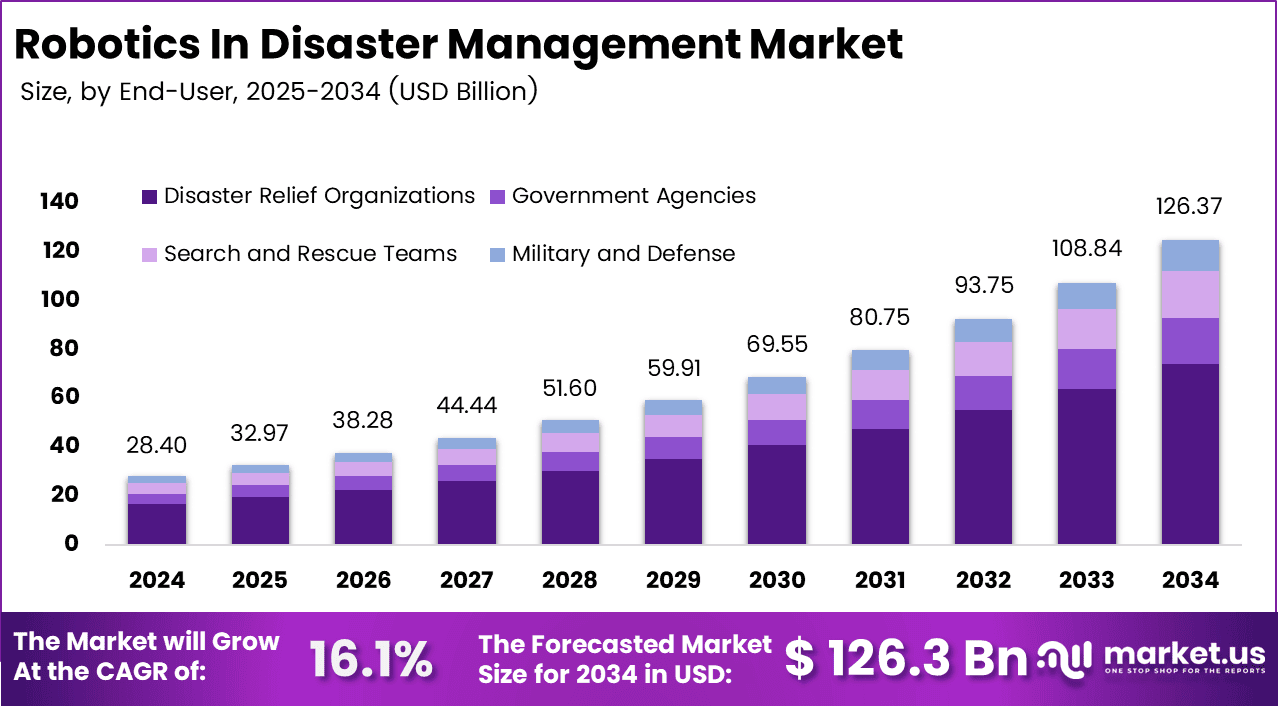
Higher disaster losses, growing emergency budgets, and safer remote operations will support demand. The UN Office for Disaster Risk Reduction estimates that direct disaster costs average USD 70 billion to USD 80 billion a year, while wider economic and ecosystem effects raise the annual burden substantially. Governments now need robots that can enter collapsed buildings, map flood zones, inspect damaged assets, carry supplies, and locate survivors without exposing responders.
FEMA made USD 1.008 billion available through its fiscal 2025 Homeland Security Grant Program, including USD 553.5 million for high-risk urban areas. These funds strengthen deployable emergency capabilities, geospatial systems, and interoperable communications that support robotic missions. High disaster exposure creates a clear need for aerial, ground, and underwater systems.
UNDRR recorded USD 69.57 billion in direct disaster losses across North America in 2023, the highest regional exposure that year. The region also combines large public safety budgets with advanced robotics developers, defense contractors, research centers, and emergency response agencies. Canada adds a structured federal recovery system and planned CAD 744.6 million for emergency management in fiscal 2025 to 2026.
Its Disaster Financial Assistance Arrangements accounted for CAD 616 million of that planned spending. These programs support response, infrastructure restoration, recovery, and high-risk mitigation. This mix of financial capacity, frequent disasters, established procurement systems, and local technical skills allows agencies to test robots quickly and move successful systems into field operations.
Key Takeaways
- The market stood at USD 28.4 billion in 2024 and will reach USD 126.3 billion by 2034. The market will grow at a 16.1% CAGR during 2025 to 2034.
- Ground-based Robots led the type segment with a 62.7% share.
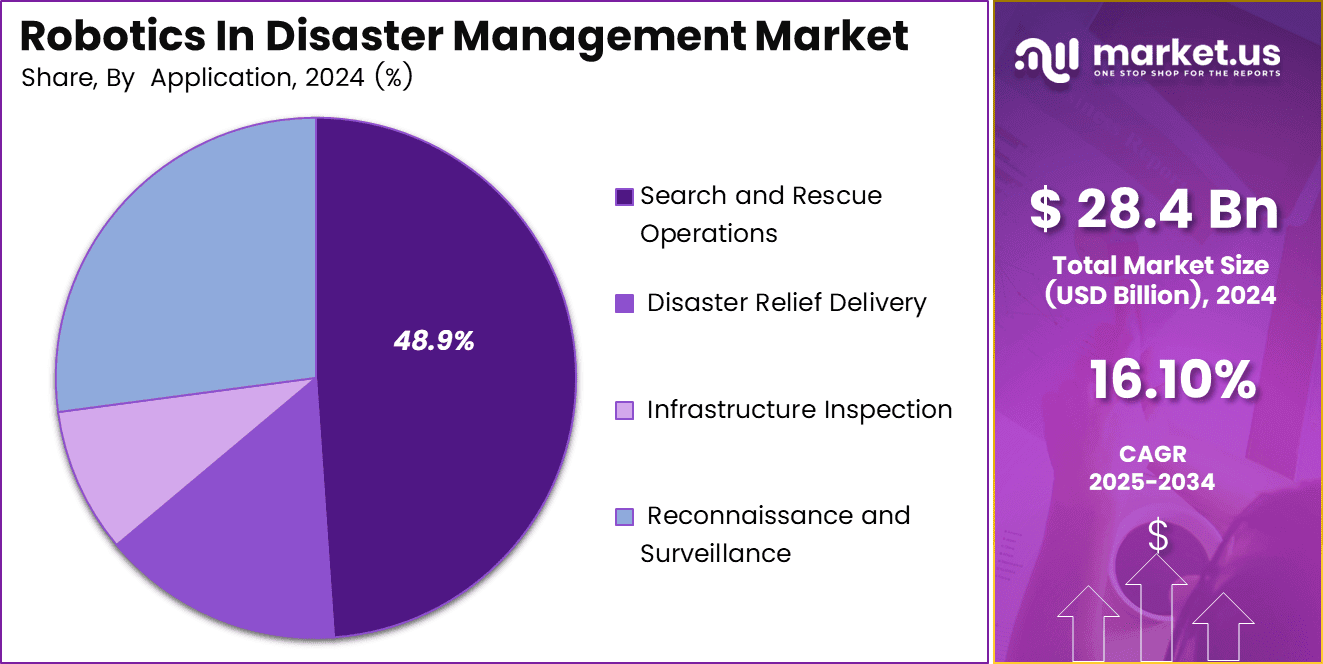
- Search and Rescue Operations led the application segment with a 48.9% share.
- Disaster Relief Organizations led the end-user segment with a 42.8% share.
- North America led with a 42% share and USD 11.9 billion in revenue.
By Type
Ground-based Robots dominate with 62.7% due to strong mobility across unstable debris fields.
Ground-based robots lead the type segment because they can operate inside rubble, tunnels, damaged industrial sites, and unsafe buildings while keeping rescue personnel at a safer distance. These systems support heavier sensors, robotic arms, gas detectors, and longer operating times.
NIST has developed 30 ground-robot test methods covering mobility, sensing, endurance, communications, durability, reliability, and safety. Aerial robots are expected to grow fastest because they can quickly scan large disaster zones, reach isolated areas, and provide live mapping without relying on road access.
NIST has validated 20 standard drone tests, while federal guidance covers small unmanned aircraft weighing below 55 pounds. Improvements in thermal imaging, automated flight paths, and simpler controls are supporting wider use in fire mapping, flood surveys, missing-person searches, and infrastructure damage assessment.
By Application
Search and Rescue Operations dominate with 48.9% due to the urgent need to locate trapped survivors.
Search and rescue operations lead the application segment because disaster response begins with locating survivors, assessing unstable areas, and identifying safe access routes. Robots can provide video, thermal imaging, sound, and location data in hazardous environments.
FEMA coordinates 28 Urban Search and Rescue task forces, supporting demand for rugged robotic systems that can operate continuously while reducing responder exposure to debris, fire, floodwater, and other risks. Infrastructure inspection is expected to grow fastest as governments seek faster damage assessment across roads, bridges, dams, power networks, ports, and buildings.
UNDRR estimates direct disaster losses at around USD 202 billion annually, while total costs exceed USD 2.3 trillion when wider economic and environmental impacts are included. Robotic inspection using high-resolution imaging, thermal scanning, and 3-dimensional mapping can support faster recovery, reduce worker risk, and improve preventive maintenance.
By End-User
Disaster Relief Organizations dominate with 42.8% due to broad control of frontline relief missions.
Disaster relief organizations lead the end-user segment because they coordinate large-scale humanitarian operations across areas affected by floods, earthquakes, fires, and conflicts. OCHA reported that more than 1,500 humanitarian partners participated in the 2025 global response plan, which aimed to assist 190 million people.
Humanitarian agencies also reached nearly 116 million people during 2024, supporting demand for portable robotic systems used for mapping, search, logistics, and situational awareness. Government agencies are expected to grow fastest because they control emergency services, public infrastructure, response budgets, and technology deployment.
UNDRR received USD 57.2 million in financial contributions during 2024, while 11 government donors provided full or partial core funding. Rising disaster-response costs and worker-safety requirements are expected to support wider investment in drones, ground robots, and robotic data systems connected with national command centers.
Key Market Segments
By Type
- Ground-based Robots
- Aerial Robots
- Underwater Robots
By Application
- Search and Rescue Operations
- Disaster Relief Delivery
- Infrastructure Inspection
- Reconnaissance and Surveillance
By End-User
- Disaster Relief Organizations
- Government Agencies
- Military and Defense
- Search and Rescue Teams
Geopolitical Impact Analysis
Trade tensions increase the cost of disaster-response robots because manufacturers depend on imported processors, cameras, communication modules, batteries, electric motors, aluminum frames, and steel parts. The WTO reported that United States tariffs on steel and aluminum rose to 25% in 2025. It also recorded a 25 percentage point increase on motor vehicles and related parts.
The WTO initially expected world merchandise trade volume to fall 0.2% in 2025, nearly 3 percentage points below its earlier path. Lower trade volume can reduce component availability and encourage robotics companies to hold more inventory, qualify second suppliers, and move final assembly closer to buyers.
Conflict around the Red Sea also changes distribution routes between Asian component factories and customers in Europe or North America. UNCTAD found that rerouting around Africa added about 12 days to Asia-to-Europe journeys and increased transit time by roughly 30%. It estimated that longer routes cut effective global container capacity by about 9%. Shanghai container spot rates rose 122% from early December, while Shanghai-to-Europe rates increased 256%.
Such changes raise shipping and insurance costs for bulky ground robots, underwater vehicles, replacement batteries, sensor masts, and field control stations. Commodity swings add another pricing risk. The World Bank reported that metal prices fell 7% in April 2025 as tariffs weakened demand for materials used in vehicles and electronics. Manufacturers may gain from lower spot metal prices, but tariffs, freight charges, and supply uncertainty can offset those savings.
Regional Analysis
North America dominates the Robotics In Disaster Management Market, holding a 42% share and generating USD 11.9 billion in revenue. The United States drives regional demand through federal emergency agencies, defense programs, local fire departments, urban search and rescue teams, utilities, and industrial operators.
NOAA counted 27 United States weather and climate disasters with losses above USD 1 billion each during 2024. Those events caused USD 182.7 billion in total damage and included 17 severe storms, five tropical cyclones, two winter storms, one flood, one drought and heat event, and one wildfire.
The region also has a large automation base. The International Federation of Robotics recorded 50,100 industrial robot installations across the Americas in 2024. The United States accounted for 68% of regional installations, while Canada installed 3,800 units. This supplier base gives disaster-robot developers access to motors, controllers, machine vision, engineering skills, integration partners, and repair networks.
Asia Pacific combines high disaster exposure with the world’s largest robotics manufacturing base. The supplied data does not identify it as the fastest-growing region, so no verified fastest-growth claim can be made. However, China accounted for 54% of global robot installations in 2024, with about 295,000 units. The Asian Development Bank warns that climate effects could reduce developing Asia Pacific GDP by 17% by 2070 under a high-emissions path.
Key Regions and Countries
North America
- US
- Canada
Europe
- Germany
- France
- The UK
- Spain
- Italy
- Rest of Europe
Asia Pacific
- China
- Japan
- South Korea
- India
- Australia
- Rest of APAC
Latin America
- Brazil
- Mexico
- Rest of Latin America
Middle East and Africa
- GCC
- South Africa
- Rest of MEA
Market Dynamics
Drivers
| Driver | (~) % Impact on CAGR Forecast | Geographic Relevance | Impact Timeline |
|---|---|---|---|
| Government preparedness procurement | +1.4% | North America, Europe, East Asia | Short term (2 years or less) |
| Rising climate-disaster intensity | +1.2% | Global, coastal and wildfire-prone regions | Short term (2 years or less) |
| Responder safety prioritization | +0.9% | Global urban search-and-rescue agencies | Short term (2 years or less) |
| Edge-AI capability maturation | +0.7% | North America, Europe, East Asia | Medium term (2 to 4 years) |
| Commercial-component cost spillovers | +0.6% | Global manufacturing hubs | Medium term (2 to 4 years) |
| Performance-testing institutionalization | +0.4% | North America, Europe, advanced Asia | Medium term (2 to 4 years) |
Government preparedness procurement
Recurring public preparedness funding is supporting the shift of disaster robots from pilot projects to permanent response fleets. FEMA maintained US$1.008 billion in Homeland Security Grant Program funding in both fiscal 2024 and 2025, while the European Commission expanded support for autonomous disaster-response systems in 2025. WMO also reported that 2024 was around 1.55°C above the pre-industrial average and recorded the highest disaster-related displacement level in 16 years.
These developments are estimated to contribute approximately +1.4% to market CAGR by encouraging multiyear contracts for software, training, maintenance, and mission support instead of one-time hardware purchases. Recurring service models could increase supplier revenue per installed platform by approximately 15% to 25%, while reducing dependence on irregular post-disaster procurement.
Restraints
| Restraint | (~) % Impact on CAGR Forecast | Geographic Relevance | Impact Timeline |
|---|---|---|---|
| Fragmented flight authorizations | -1.2% | North America, Europe, regulated airspaces | Short term (2 years or less) |
| High fleet ownership costs | -1.0% | Emerging economies, municipal agencies | Short term (2 years or less) |
| Trusted-supplier procurement restrictions | -0.8% | North America, Europe, strategic allies | Short term (2 years or less) |
| Liability allocation uncertainty | -0.7% | Global public-safety deployments | Medium term (2 to 4 years) |
| Spectrum access limitations | -0.6% | Dense urban and cross-border operations | Medium term (2 to 4 years) |
| Site-entry compliance barriers | -0.5% | Critical infrastructure and hazardous sites | Short term (2 years or less) |
Fragmented flight authorizations
Disaster-response drones often require beyond-visual-line-of-sight operations, flights over people, or access to controlled airspace, which can increase regulatory complexity. In 2026, the FAA noted that emergency visual-line-of-sight permissions may be granted within minutes, while BVLOS approvals can take longer.
EASA guidance from 2025 stated that BVLOS missions below 500 feet generally require operational authorization and risk assessment, while ICAO’s 2024 framework introduced 3 core requirements for international remotely piloted operations.
These regulatory requirements are estimated to reduce market CAGR by approximately -1.2% because mission-specific approvals can increase deployment preparation costs by around 10% to 30% and delay project execution. Compliance, documentation, testing, and certification expenses can also reduce supplier gross margins by an estimated 2 to 4 percentage points, particularly where operational approvals must be secured separately for different locations or missions.
Challenges
| Challenge | (~) % CAGR Friction Drag | Geographic Relevance | Mitigation Horizon |
|---|---|---|---|
| Degraded-network mission continuity | -0.9% | Global disaster zones and remote regions | Medium term (2 to 4 years) |
| Battery endurance constraints | -0.7% | Global aerial and mobile platforms | Medium term (2 to 4 years) |
| Harsh-terrain reliability gaps | -0.6% | Earthquake, flood, and wildfire regions | Long term (4 years or more) |
| Rare-event autonomy validation | -0.6% | Global high-consequence deployments | Long term (4 years or more) |
| Specialist operator shortages | -0.5% | Emerging economies and rural agencies | Medium term (2 to 4 years) |
| Multi-agency workflow fragmentation | -0.4% | Cross-border and federalized jurisdictions | Long term (4 years or more) |
Degraded-network mission continuity
Robotic disaster-response platforms rely on stable command links, mapping feeds, and telemetry, even when terrestrial networks are damaged or congested. ITU estimated that 2.6 billion people remained offline in 2024, while emergency satellite equipment may require around 24 to 48 hours for deployment. Its Disaster Connectivity Map has already been activated more than 50 times across over 30 countries, highlighting the scale of connectivity challenges during major emergencies.
Connectivity failures can reduce productive robot operating time by an estimated 20% to 35%, while redundant radios, local computing, and portable satellite backhaul may increase system costs by around 8% to 15%. These limitations could create approximately a -0.9% drag on market growth, encouraging manufacturers to invest in autonomous return functions, mesh networks, offline mapping, and communication-independent control systems.
Opportunities
| Opportunity | (~) % Potential CAGR Upside | Geographic Relevance | Execution Window |
|---|---|---|---|
| Routine BVLOS fleet operations | +0.8% | North America, followed by Europe | Medium term (2 to 4 years) |
| Robotics-as-a-service subscriptions | +0.6% | Municipal and regional agencies globally | Medium term (2 to 4 years) |
| Emerging-market pooled fleets | +0.5% | South Asia, Africa, Latin America | Medium term (2 to 4 years) |
| Coordinated multimodal robot teams | +0.4% | Advanced emergency-response systems | Long term (4 years or more) |
| Automated insurance assessment | +0.3% | Insured urban and industrial markets | Medium term (2 to 4 years) |
| Emergency medical logistics | +0.2% | Remote, island and disrupted regions | Long term (4 years or more) |
Routine BVLOS fleet operations
This opportunity remains future white space because standardized BVLOS rules are not yet fully implemented across major markets. The FAA’s 2025 proposal aimed to reduce case-by-case waivers, while EASA continues to require authorization for many BVLOS missions. Europe already has more than 1.6 million registered drone operators, creating a large potential base for long-range emergency-response operations as regulations mature.
Greater regulatory harmonization could allow one operator to supervise multiple autonomous drones, increasing sorties per labor hour by approximately 2 to 3 times and reducing mission labor costs by around 25% to 40%. Service gross margins could improve by 3 to 6 percentage points, supporting an estimated +0.8% CAGR upside.
Key Players Analysis
Tier 1 market leaders include Honda, Boston Dynamics, and Foster-Miller through QinetiQ. Honda reported fiscal 2025 consolidated revenue of JPY 21,688.7 billion. Its Power Products and Other Businesses segment generated JPY 385.1 billion. Honda spent JPY 1,210.6 billion, or 5.6% of revenue, on research and development and recorded JPY 902.7 billion in capital spending excluding operating-lease equipment.
Boston Dynamics gains scale from Hyundai Motor Group. Hyundai Motor reported 2025 revenue of KRW 186.3 trillion and planned KRW 17.8 trillion in 2026 investment, including KRW 7.4 trillion for research and development. Hyundai also announced a four-year USD 26 billion United States investment and a robotics facility with capacity for 30,000 units a year.
QinetiQ, which includes Foster-Miller operations, recorded fiscal 2025 revenue of GBP 1,931.6 million, order intake of GBP 1,954.8 million, and a funded backlog of GBP 2,845.1 million. Tier 2 challengers include ANYbotics, Sarcos Robotics, SuperDroid Robots, Husarion, VECNA Technologies, OC Robotics, Rovenso, Tmsuk, BlackDog, and ROBOTSYSTEM. ANYbotics has disclosed more than USD 150 million in total funding and a workforce of about 200 experts, giving it measurable capacity to expand autonomous inspection robots.
Top Key Players in the Market
- Honda
- SuperDroid Robots
- BlackDog
- Husarion
- Tmsuk
- VECNA Technologies
- Sarcos Robotics
- Boston Dynamics
- OC Robotics
- Foster-Miller
- Rovenso
- ANYbotics
- ROBOTSYSTEM
Recent Developments
- In September 2025, ANYbotics added Climate Investment to its investor group, taking disclosed total funding above USD 150 million to support autonomous inspection robots for hazardous industrial sites.
- In September 2025, the United States Coast Guard announced a USD 350 million robotics and autonomous-systems program, including USD 4.8 million for 16 VideoRay Defender underwater robots, USD 2 million for 18 QinetiQ ground robots, and USD 4.3 million for 125 Skydio X10D drones.
- In January 2026, Hyundai Motor Group announced a USD 26 billion United States investment plan that includes a new robotics factory with annual capacity for 30,000 units by 2028.
- In March 2026, Ondas acquired INDO Earth Moving after INDO secured a USD 140 million tender covering dozens of heavy engineering platforms, two years of deliveries, and at least four years of operational support for infrastructure and disaster-response applications.
- In June 2026, Boston Dynamics announced a USD 100 million expansion into a 323,000-square-foot robotics and AI center, supported by USD 25 million in Massachusetts tax credits and planned capacity for 1,250 new jobs.
Report Scope
| Report Features | Description |
|---|---|
| Market Value (2024) | USD 28.4 billion |
| Forecast Revenue (2034) | USD 126.3 billion |
| CAGR (2025-2034) | 16.1% |
| Base Year for Estimation | 2024 |
| Historic Period | 2020-2023 |
| Forecast Period | 2025-2034 |
| Report Coverage | Revenue Forecast, Market Dynamics, Competitive Landscape, Recent Developments |
| Segments Covered | By Type (Ground-based Robots, Aerial Robots, Underwater Robots); By Application (Search and Rescue Operations, Disaster Relief Delivery, Infrastructure Inspection, Reconnaissance and Surveillance); By End-User (Disaster Relief Organizations, Government Agencies, Military and Defense, Search and Rescue Teams) |
| Regional Analysis | North America – US, Canada; Europe – Germany, France, The UK, Spain, Italy, Rest of Europe; Asia Pacific – China, Japan, South Korea, India, Australia, Singapore, Rest of APAC; Latin America – Brazil, Mexico, Rest of Latin America; Middle East & Africa – GCC, South Africa, Rest of MEA |
| Competitive Landscape | Honda, SuperDroid Robots, BlackDog, Husarion, Tmsuk, VECNA Technologies, Sarcos Robotics, Boston Dynamics, OC Robotics, Foster-Miller, Rovenso, ANYbotics, ROBOTSYSTEM |
| Customization Scope | Customization for segments and region/country-level will be provided. Moreover, additional customization can be done based on the requirements. |
| Purchase Options | We have three licenses to opt for: Single User License, Multi-User License (Up to 5 Users), Corporate Use License (Unlimited Users and Printable PDF) |





























