


Report Overview
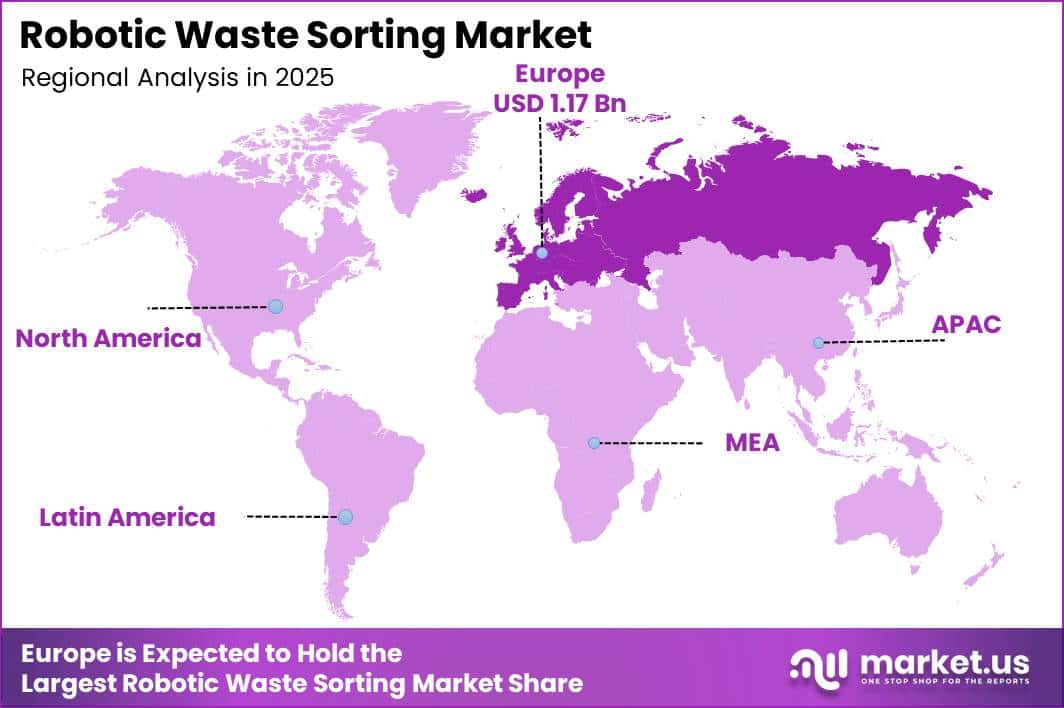
In 2025, the Global Robotic Waste Sorting Market was valued at USD 3.6 billion. The market is projected to grow at a CAGR of 15.4% during 2026–2035, reaching approximately USD 15.1 billion by 2035. Europe dominated the global market in 2025, accounting for more than 32.5% of the total market share and generating approximately USD 1.17 billion in revenue.
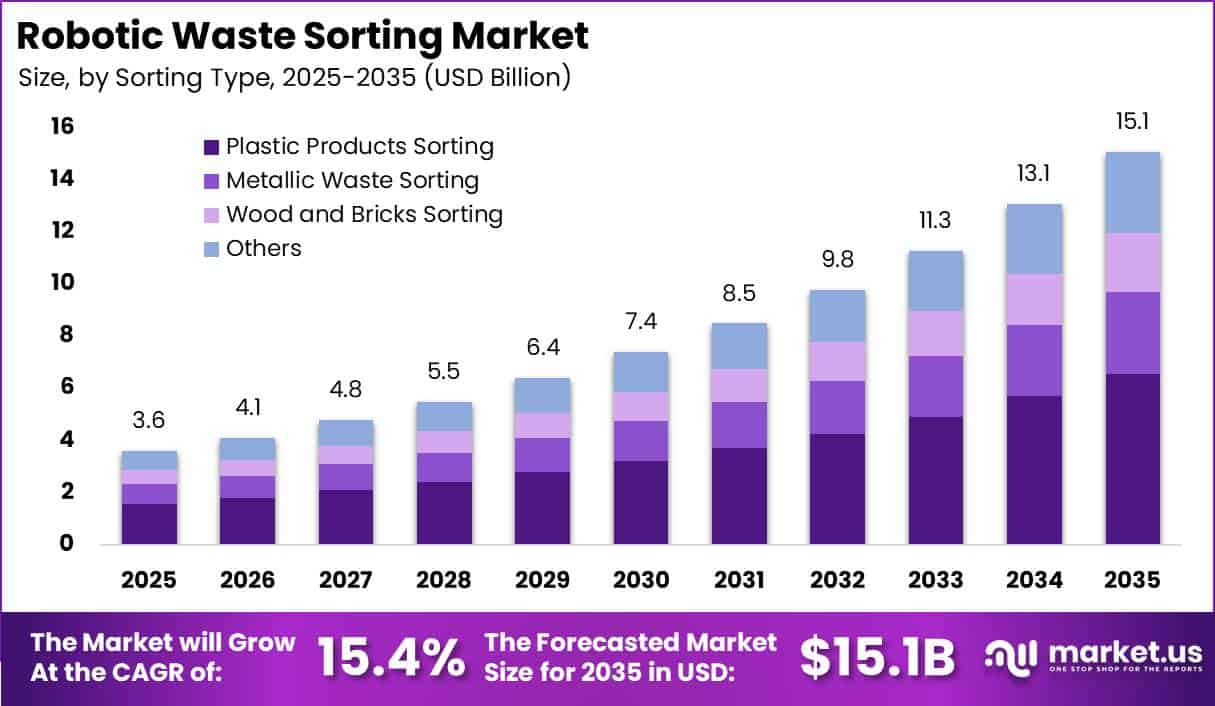
This growth is closely linked to increasing waste generation and stricter recycling targets. According to the World Bank, global municipal solid waste could increase from 2.01 billion tonnes in 2016 to 3.4 billion tonnes by 2050 as urban populations and household incomes grow. This expansion will create larger volumes of mixed plastics, metals, paper, packaging, and electronic waste.
Meanwhile, the EU Waste Framework Directive requires member states to recycle 65% of municipal waste by 2035. These conditions are encouraging recycling facilities to adopt robotic systems capable of identifying and sorting thousands of items per hour with greater speed, consistency, and accuracy than manual operations.
Europe accounted for a significant share of the global market, representing a substantial market value. The region’s leadership is supported by strong waste collection systems, established recycling infrastructure, and strict landfill reduction policies. High-income regions, including Europe, generate around 34% of global waste, according to the World Bank.
Average municipal recycling in the European Union has also increased from nearly 25% in the mid-1990s to more than 47%, while leading countries recycle approximately 55% to 60%. Rising recycling requirements and tighter material-quality standards are expected to increase automated sorting lines and robotic installations across Europe during 2026–2035.
Key Takeaway
- The Robotic Waste Sorting Market was valued at USD 3.6 billion in 2025 and is projected to reach USD 15.1 billion by 2035, growing at a CAGR of 15.4%.
- Plastic products sorting was the leading sorting-type segment, capturing 43.5% of the market.
- Waste recovery was the leading application segment, accounting for a 53.6% share.
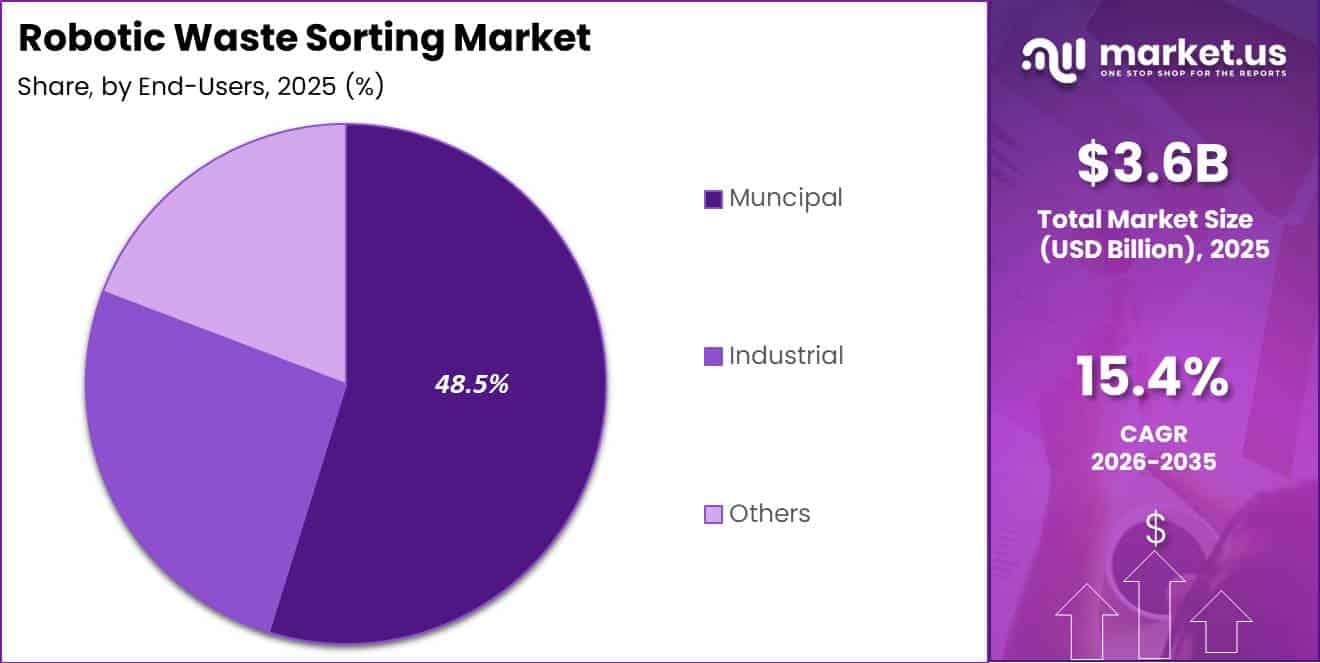
- Municipal end users held the leading position among end-user segments, accounting for a 48.5% share.
- Europe led the global market in 2025 with more than 32.5% share, worth approximately USD 1.17 billion.
By Sorting Type
Plastic Products Sorting accounted for the largest share of the Robotic Waste Sorting Market, capturing 43.5%. This leadership is mainly supported by the high volume of plastic entering municipal waste streams and the growing pressure to improve recycling rates. According to the OECD, global plastic waste reached approximately 353 million tonnes in 2019, while only 9% was recycled and nearly 50% was landfilled or incinerated.
The United Nations Environment Programme also reports that more than 400 million tonnes of plastic are produced each year, with a large share used in short-life packaging. This creates a continuous flow of PET bottles, HDPE containers, plastic films, and multilayer packaging that requires fast and accurate separation. Regulations are also encouraging investment in automated systems.
The European Union requires at least 50% of plastic packaging to be recycled by 2025, increasing to 55% by 2030. Robotic sorting systems use cameras, artificial intelligence, and spectroscopy to identify different polymer types and remove contamination.
By Application
Waste recovery held the leading position in robotic waste sorting applications, accounting for a 53.6% share. Its dominance is supported by the growing focus of governments and recycling operators on recovering more usable materials from each tonne of waste. In the European Union, municipal waste recycled or composted increased from 37 million tonnes in 1995 to 111 million tonnes in 2023, equal to approximately 246 kg per person and an average annual growth rate of more than 4%.
Recycling now accounts for nearly half of municipal waste generated across the EU. Regulatory targets require 55% of municipal waste to be prepared for reuse or recycling by 2025, rising to 60–65% between 2030 and 2035. These targets are increasing the need for accurate separation of plastics, metals, paper, and organic materials.
Robotic systems support waste recovery by identifying and picking thousands of items per hour while reducing sorting errors and contamination. Higher recovery levels also lower disposal costs, improve revenue from secondary materials, and help municipalities and producers comply with circular-economy regulations, making waste recovery the main application for robotic sorting investments.
By End-Users
Municipal end users held the leading position in the Robotic Waste Sorting Market, accounting for a 48.5% share. This dominance is supported by the large volume and highly regulated nature of municipal waste. According to Eurostat, EU residents generated approximately 517 kg of municipal waste per person in 2024. Municipal waste recycling and composting also increased from 37 million tonnes in 1995 to 111 million tonnes in 2023.
EU regulations require member states to prepare at least 55% of municipal waste for reuse or recycling by 2025, with the target rising to 60% and 65% during the following decade. Municipal waste contains a complex mix of plastics, paper, glass, metals, textiles, and organic materials, making manual separation time-consuming, expensive, and less accurate.
This improves recovery rates, reduces contamination, and helps local authorities control operating costs. As municipalities remain directly responsible for waste collection, regulatory compliance, and recycling performance, they have strong economic and legal reasons to invest in robotic sorting systems at material recovery facilities.
Key Market Segments
By Sorting Type
- Plastic Products Sorting
- Metallic Waste Sorting
- Wood and Bricks Sorting
- Others
By Application
- Waste Recovery
- Waste Recycling
By End-Users
- Municipal
- Industrial
- Others
Geopolitical Impact Analysis
Geopolitical tensions are increasing costs and disrupting delivery schedules across the Robotic Waste Sorting Market. These systems rely on imported steel structures, actuators, sensors, electronics, machine-vision cameras, programmable logic controllers, and high-performance computing units. According to UNCTAD, Red Sea attacks reduced Suez Canal trade volumes by 42% and weekly container transits by 67%.
Rerouting vessels around the Cape of Good Hope added approximately 12 sailing days and lowered effective global container capacity by nearly 9%. Spot container freight rates from Shanghai to Europe increased by 256%, while rates to the US West Coast rose by 162% between early December and early 2024.
Energy costs are creating another challenge for recycling facilities. The IEA reported that European wholesale electricity prices in 2022 were more than twice their 2021 level. EU electricity consumption consequently declined by 3.5% as industrial users reduced operations.
Higher power prices increase operating expenses for automated sorting facilities, particularly those running 24/7, and may cause buyers to delay or divide installations into several phases. WTO and IMF tariff trackers also indicate that trade disputes since 2018 have increased import duties on machinery and electrical equipment, pushing weighted tariffs on manufactured goods toward approximately 4–6% in some markets.
Regional Analysis
Europe held the dominant position in the Robotic Waste Sorting Market, accounting for approximately 32.5% of global revenue, equivalent to nearly USD 1.17 billion. The region’s leadership is supported by well-developed waste collection systems, ambitious landfill-diversion targets, and strong public investment in circular economy infrastructure.
Under the EU’s 2021–2027 Cohesion Policy, around EUR 8.6 billion has been allocated to circular economy and waste management projects, within a total investment of approximately EUR 12.5 billion. This includes nearly EUR 1.5 billion for expanding separate waste collection facilities, which are expected to add more than 7 million tonnes per year of collection capacity.
North America is emerging as the fastest-growing regional market, supported by high labor costs and stronger state-level waste-diversion policies. However, Europe’s combination of public funding, binding recycling requirements, established infrastructure, and technology readiness is expected to maintain its 32.5% share and USD 1.17 billion market value.
Key Regions and Countries
North America
- US
- Canada
Europe
- Germany
- France
- The UK
- Spain
- Italy
- Rest of Europe
Asia Pacific
- China
- Japan
- South Korea
- India
- Australia
- Rest of APAC
Latin America
- Brazil
- Mexico
- Rest of Latin America
Middle East & Africa
- GCC
- South Africa
- Rest of MEA
Market Dynamics
Drivers
| Driver | (~) % CAGR | Geographic Relevance | Impact Timeline |
|---|---|---|---|
| Labor scarcity in waste facilities | +3.0% | North America, Europe | Short term (≤ 2 years) |
| Growth of municipal waste volumes | +2.6% | Global, urban regions | Long term (≥ 4 years) |
| Premium pricing of high-purity recyclables | +2.2% | OECD economies | Medium term (2–4 years) |
| Automation-led Opex reduction programs | +1.8% | North America, Europe, Asia | Short term (≤ 2 years) |
| AI vision accuracy improvements | +1.4% | Global early adopters | Medium term (2–4 years) |
| Investor focus on circular assets | +1.2% | Global institutional capital | Medium term (2–4 years) |
Labor scarcity in waste facilities
Persistent labor shortages in waste sorting facilities are a major market driver and could add around 3.0% to the baseline CAGR of 15.4%. Waste collection and recycling jobs record injury rates of more than 3–4 cases per 100 workers, increasing overtime, recruitment, and insurance expenses.
In parts of Europe, waste-sector employment has also grown more slowly than processing demand, while municipal waste generation remains above 500 kg per person annually. These pressures are encouraging operators to replace repetitive manual picking with robotic and AI-based sorting systems.
Robotic installations can reduce manual staffing requirements by approximately 30–50% and improve picking rates by low double-digit percentages. More stable throughput, lower labor dependence, and safer working conditions may improve EBITDA margins by around 2–4 percentage points, directly supporting the market’s current growth rate.
Restraints
| Restraint | (~) % CAGR | Geographic Relevance | Impact Timeline |
|---|---|---|---|
| High upfront system CapEx | -3.2% | Global, smaller municipalities | Medium term (2–4 years) |
| Elevated interest rates | -2.4% | North America, Europe | Short term (≤ 2 years) |
| Limited access to concessional finance | -1.8% | Emerging markets | Long term (≥ 4 years) |
| Grid power price volatility | -1.5% | Europe, Asia | Short term (≤ 2 years) |
| Procurement fragmentation in public sector | -1.3% | Global municipal buyers | Medium term (2–4 years) |
| Competing spend on basic waste infrastructure | -1.1% | Low- & middle-income countries | Long term (≥ 4 years) |
High upfront system CapEx
High upfront system costs remain the most significant market restraint and may reduce the potential growth rate by around 3.2%. Complete multi-robot sorting lines can require equipment and integration investments of several million dollars, often equal to multiple years of operating savings for a mid-sized municipal facility.
Municipal borrowing costs in many emerging economies remain above 6–8%, while policy rates in major developed markets have increased by approximately 200–300 basis points since 2021. These financing pressures can extend project payback periods to 5–7 years, compared with around 3–4 years for simpler mechanical upgrades.
Vendors are introducing leasing and performance-based contracts to reduce initial spending, but equipment sales still account for most robotics revenue. As a result, smaller facilities often delay automation projects, keeping market growth close to the baseline CAGR of 15.4% rather than reaching its higher potential.
Challenges
| Challenge | (~) % CAGR | Geographic Relevance | Mitigation Horizon |
|---|---|---|---|
| Mixed-stream technical complexity | -2.8% | Global, urban MRFs | Long term (≥ 4 years) |
| Shortage of robotics maintenance talent | -2.3% | Global | Medium term (2–4 years) |
| Integration with legacy plants | -2.0% | Europe, North America | Medium term (2–4 years) |
| Data governance & cybersecurity in AI systems | -1.7% | OECD economies | Long term (≥ 4 years) |
| Sensor hardware supply variability | -1.5% | Global | Short term (≤ 2 years) |
| Inconsistent waste classification standards | -1.3% | Cross-border deployments | Long term (≥ 4 years) |
Mixed-stream technical complexity
Mixed-stream complexity remains the main technical challenge and may reduce the market’s maximum attainable CAGR by around 2.8%. In many municipalities, source-segregation rates remain below 50%, meaning plastics, metals, paper, organics, and textiles often enter facilities in a single mixed stream.
Contamination levels can exceed 15–25%, while plastic films, bags, and tangled materials reduce sorting speed and accuracy. These conditions can lower effective picking rates by mid-single-digit percentages and increase per-tonne processing costs.
Robotics companies are investing tens to hundreds of millions of dollars in better AI recognition systems, sensors, and gripper designs. However, product development cycles may take 3–5 years, particularly for systems handling hidden, flexible, or irregular materials. This challenge does not stop new installations, but it limits uptime, recovery rates, and profit margins.
Opportunities
| Opportunity | (~) % CAGR | Geographic Relevance | Execution Window |
|---|---|---|---|
| Robotics-as-a-service financing models | +2.4% | Global | Medium term (2–4 years) |
| AI analytics monetization on waste data | +2.1% | OECD municipalities & brands | Medium term (2–4 years) |
| Expansion into industrial & e-waste streams | +1.9% | Global manufacturing hubs | Long term (≥ 4 years) |
| Standardized platform partnerships with packaging producers | +1.7% | Global FMCG & retail | Medium term (2–4 years) |
| Automation support in climate-finance programs | +1.5% | Emerging markets | Long term (≥ 4 years) |
| Real-time performance benchmarking networks | +1.3% | Global multi-site operators | Short term (≤ 2 years) |
Robotics-as-a-service financing models
Robotics-as-a-service offers a major growth opportunity and could add nearly 2.4% to the market’s baseline CAGR of 15.4%. The model replaces large upfront equipment purchases with predictable operating subscriptions, making robotic systems more accessible to municipalities and recycling facilities with limited capital.
Similar industrial leasing models have reduced initial cash requirements by more than 50%, while service fees equal to around 5–10% of existing operating expenses could be supported through lower labor costs and better material recovery.
Vendors could move approximately 20–30% of new installations to service-based contracts over the next 2–4 years. Under this structure, providers may achieve returns above 12–15%, while customers could improve EBITDA margins by 2–3 percentage points. However, wider adoption will depend on clear asset ownership, performance guarantees, maintenance terms, and balanced risk-sharing agreements.
Key Players Analysis
Tier-1 competition in the Robotic Waste Sorting Market is led by ABB and TOMRA, supported by their global operations, large installed bases, and strong investment capacity. ABB reported approximately USD 33.2 billion in total revenue in its 2025 Integrated Report, with Robotics & Discrete Automation operating as 1 of its 4 main business areas.
TOMRA generated record revenue of NOK 14.8 billion, approximately USD 1.4 billion, in 2023, while its Recycling division contributed nearly NOK 3.1 billion. With more than 110,000 installations across over 100 markets, TOMRA is estimated to hold a low-teens share. Together, ABB and TOMRA may control around 20–30% of the addressable market.
Tier-2 participants include AMP Robotics, Machinex, General Kinematics, Greyparrot, Waste Robotics, Clean Robotics, Bollegraaf, and ZenRobotics, now owned by TOMRA. AMP Robotics generated an estimated USD 90–250 million in annual sales between 2021 and 2024 and raised approximately USD 175 million in equity financing.
Machinex is estimated to earn USD 62–250 million annually, while General Kinematics generates around USD 112 million. Collectively, Tier-2 companies may represent 25–35% of market revenue. TOMRA also invested more than NOK 800–1,000 million in taxonomy-aligned collection and recycling activities in 2023, strengthening sensor technology, artificial intelligence, and closed-loop sorting capabilities.
Top Key Players in the Market
- General Kinematics Corporation
- AMP Robotics Corp.
- ABB Ltd.
- Clean Robotics
- Bollegraaf Recycling Machinery
- Greyparrot
- Zen Robotics Oy
- Tomra
- Machinex Industries Inc.
- Waste Robotics Inc.
- Others
Recent Developments
- In 2026, CP Group acquired a majority stake in Recycleye in April to strengthen its AI-powered waste sorting portfolio. The transaction expanded a partnership that began in 2023 between Recycleye and MSS, CP Group’s optical sorting division. Recycleye’s 45-person team remained in place, contributing expertise in computer vision, deep learning, and robotic sorting.
- In 2025, AMP Robotics signed a 20-year waste-processing agreement with the Southeastern Public Service Authority of Virginia in November. The project will serve 8 communities and approximately 1.2 million residents across southeastern Virginia. AMP will install automated sorting and organics-processing systems capable of handling around 540,000 tonnes annually.
- The project is designed to divert nearly 50% of processable waste, create approximately 100 jobs, and avoid or remove more than 378,000 tonnes of carbon dioxide equivalent each year.
- In 2025, TOMRA Recycling launched its next-generation X-TRACT system for waste-wood sorting in May. The sensor-based unit can process up to 30 metric tonnes per hour and reduce compressed-air consumption by as much as 25%.
- It delivers sorting accuracy exceeding 98% for metals and inert materials and approximately 97% for heavy plastics. TOMRA also introduced a 16,000-hour warranty for critical X-ray and sensor components, supporting longer equipment life and lower operating interruptions.
Report Scope
| Report Features | Description |
|---|---|
| Market Value (2025) | USD 3.6 Billion |
| Forecast Revenue (2035) | USD 15.1 Billion |
| CAGR (2026-2035) | 15.4% |
| Base Year for Estimation | 2025 |
| Historic Period | 2020-2024 |
| Forecast Period | 2026-2035 |
| Report Coverage | Revenue Forecast, Market Dynamics, Competitive Landscape, Recent Developments |
| Segments Covered | By Sorting Type (Plastic Products Sorting, Metallic Waste Sorting, Wood and Bricks Sorting, Others); By Application (Waste Recovery, Waste Recycling); By End-Users (Municipal, Industrial, Others) |
| Regional Analysis | North America – US, Canada; Europe – Germany, France, The UK, Spain, Italy, Rest of Europe; Asia Pacific – China, Japan, South Korea, India, Australia, Singapore, Rest of APAC; Latin America – Brazil, Mexico, Rest of Latin America; Middle East & Africa – GCC, South Africa, Rest of MEA |
| Competitive Landscape | General Kinematics Corporation, AMP Robotics Corp., ABB Ltd., Clean Robotics, Bollegraaf Recycling Machinery, Greyparrot, Zen Robotics Oy, Tomra, Machinex Industries Inc., Waste Robotics Inc., Others |
| Customization Scope | Customization for segments, region/country-level will be provided. Moreover, additional customization can be done based on the requirements. |
| Purchase Options | We have three licenses to opt for: Single User License, Multi-User License (Up to 5 Users), Corporate Use License (Unlimited Users and Printable PDF) |





























