


Report Overview
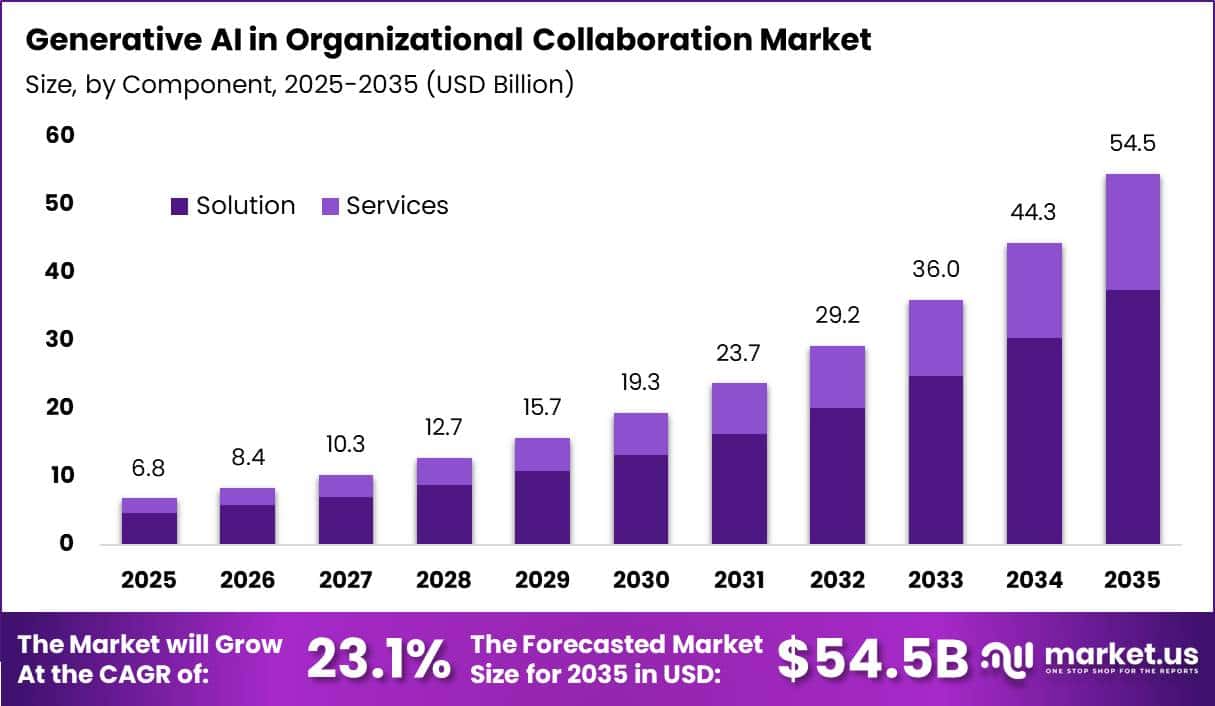
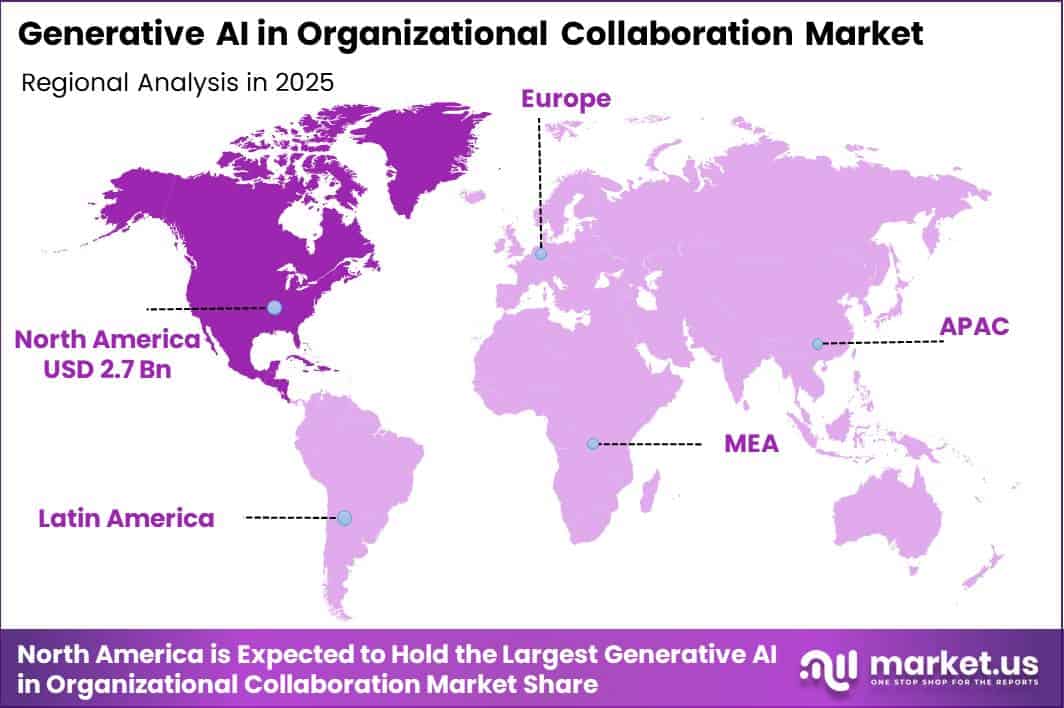
In 2025, the Global Generative AI in Organizational Collaboration Market was valued at USD 6.8 billion. The market is projected to grow at a CAGR of 23.1% during 2026–2035, reaching approximately USD 54.5 billion by 2035. North America dominated the global market in 2025, accounting for more than 39.7% of the total market share and generating approximately USD 2.7 billion in revenue.
Market growth is supported by the increasing use of artificial intelligence in everyday business activities. According to the U.S. Census Bureau’s Business Trends and Outlook Survey, AI usage among U.S. companies remained between 17% and 20% from December 2025 to May 2026. In addition, between 20% and 23% of businesses reported plans to adopt AI within the following 6 months.
Federal Reserve data further showed that company-level AI adoption increased strongly during 2025. On an employment-weighted basis, up to 78% of the workforce was employed by companies using some form of AI. This indicates that businesses are moving beyond standalone AI applications and embedding generative AI directly into organizational collaboration processes.
Global digital connectivity also supports market expansion. The ITU reported that approximately 6 billion people, representing 74% of the global population, were online in 2025, compared with 5.8 billion in the previous year. This expanding digital workforce creates a wider user base for cloud-based generative AI collaboration tools across North America and other global regions.
Key Takeaway
- The Generative AI in Organizational Collaboration Market was valued at USD 6.8 billion in 2025 and is projected to reach USD 54.5 billion by 2035, growing at a CAGR of 23.1%.
- By Component, the Solution segment dominated with a 68.7% share in 2025.
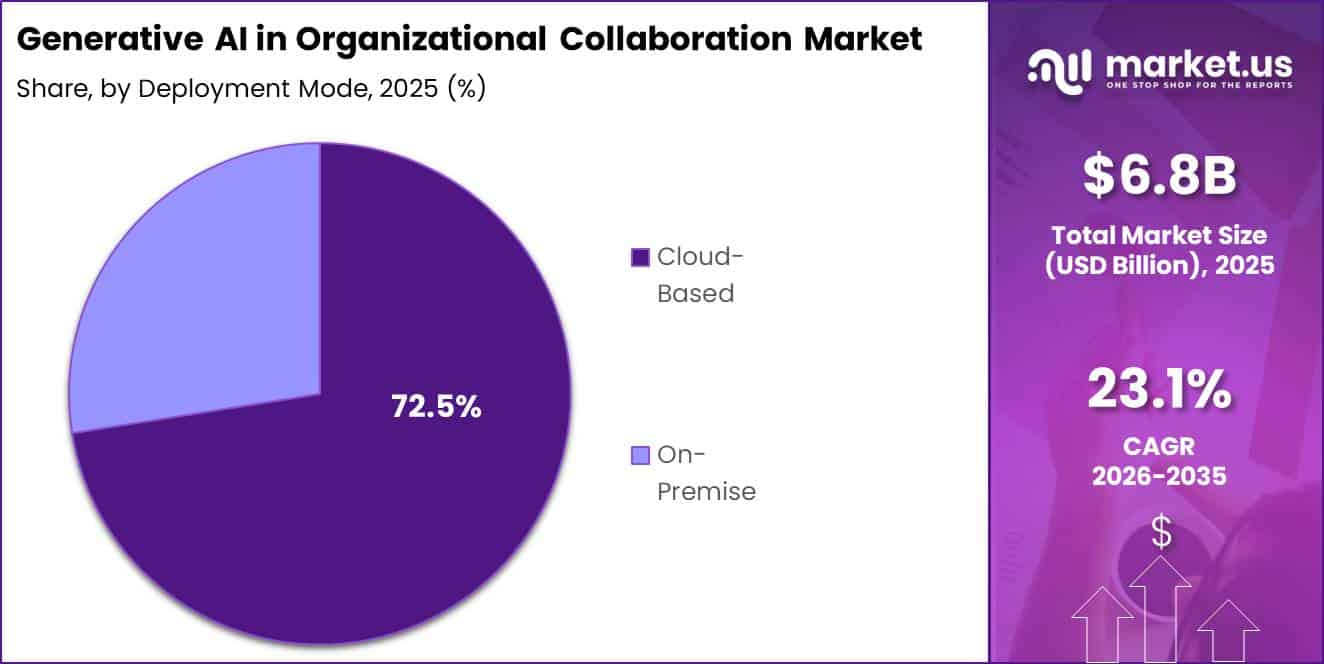
- By Deployment Mode, the Cloud-Based segment led with a 72.5% share in 2025.
- By Organization Size, Large Enterprises accounted for a 64.1% share in 2025.
- By Industry Vertical, IT and Telecommunications was the largest contributor with a 47.3% share in 2025.
- North America led the global market in 2025 with a 39.7% share, generating approximately USD 2.7 billion in revenue.
By Component
In 2025, the Solution segment held a dominant position in the Generative AI in Organizational Collaboration Market, accounting for a 68.7% share. This leadership was supported by the rapid adoption of paid cloud-based software across enterprises. According to Eurostat, 52.7% of EU enterprises used paid cloud computing services in 2025, representing an increase of 7.4 percentage points compared with 2023.
Cloud adoption was especially strong for business software applications. Around 71.6% of cloud-using enterprises purchased office software, while 65.4% used cloud-based security applications. Among large enterprises, paid cloud service usage reached 84.6%, showing a strong preference for scalable and centrally managed software platforms.
Generative AI collaboration tools are mainly delivered as licensed software solutions integrated into messaging platforms, shared documents, virtual meetings, and project management systems. As enterprises move from basic cloud services to more advanced software packages, demand for AI-enabled collaboration solutions continues to increase.
By Deployment Mode
In 2025, the Cloud-Based segment held a dominant position in the Generative AI in Organizational Collaboration Market, accounting for a 72.5% share. This leadership was supported by the continued expansion of remote and hybrid working models.
According to the U.S. Bureau of Labor Statistics, 22.6% of workers teleworked in March 2026, increasing the need for collaboration tools that can be accessed outside traditional office networks. Eurostat also reported that 60.2% of EU enterprises with 10 or more employees provided remote access to email, documents, and business software in 2024. Among large enterprises, this proportion reached 91.9%.
Cloud-based deployment allows employees to use generative AI collaboration tools from different locations and devices through centrally managed servers. It also supports real-time communication, document sharing, workflow automation, and secure access without relying on office-based infrastructure.
By Organization Size
In 2025, the Large Enterprises segment held a dominant position in the Generative AI in Organizational Collaboration Market, accounting for a 64.1% share. Large organisations lead adoption because they have stronger financial resources, advanced digital infrastructure, and larger datasets needed to deploy AI tools at scale.
According to the OECD, AI adoption among large enterprises reached approximately 52% in 2025, compared with only 17.4% among small firms across OECD countries. This wide gap reflects the high initial cost of AI implementation, the need for well-managed business data, and the availability of skilled technology and management teams within larger companies.
By Industry Vertical
In 2025, the IT and Telecommunications segment held a dominant position in the Generative AI in Organizational Collaboration Market, accounting for a 47.3% share. This leadership is supported by the sector’s central role in software development, network management, and digital service delivery.
According to the ITU, around 6 billion people were online in 2025, representing 74% of the global population, compared with 60% in 2020. This means approximately 1.3 billion additional users gained internet access within five years. The resulting rise in data traffic and digital service demand is increasing operational pressure on IT and telecommunications companies.
These businesses manage large engineering teams, global customer support operations, and 24/7 network control centres across multiple locations and time zones. Generative AI collaboration tools help employees summarise support tickets, create code snippets, automate incident reports, organise technical information, and improve communication between teams.
Key Market Segments
By Component
- Solution
- Services
By Deployment Mode
- Cloud-Based
- On-Premise
By Organization Size
- Small and Medium-Sized Enterprises
- Large Enterprises
By Industry Vertical
- IT and Telecommunications
- BFSI
- Healthcare
- Manufacturing
- Retail
- Education
- Government and Public Sector
- Other
Geopolitical Impact Analysis
Geopolitical tensions are increasing the cost and delivery risks of the computing hardware, networking systems, and data-centre infrastructure required for generative AI collaboration platforms. According to UNCTAD’s 2024 rapid assessment, disruptions in the Red Sea, Black Sea, and Panama Canal reduced traffic through both canals by more than 40%. Container tonnage passing through the Suez Canal declined by 82% by mid-February 2024, while more than 600 container ships were redirected around the Cape of Good Hope.
These diversions added up to 7,600 km to routes such as Ras Tanura–Rotterdam and extended round-trip delivery times by approximately 10–15 days. Longer shipping routes increase fuel use, insurance costs, vessel charter rates, and overall freight expenses. This raises the delivered cost of GPUs, semiconductors, servers, power systems, networking equipment, and prefabricated data-centre modules used to operate generative AI platforms.
WTO monitoring also indicates that trade affected by new import restrictions across G20 economies increased roughly fourfold from late 2024. Governments have introduced higher tariffs and stricter export controls on semiconductors and other sensitive technology products. A tariff change of 10–25% on servers or semiconductor components can significantly raise the total cost of ownership for generative AI collaboration systems.
Platform providers face higher equipment costs, longer delivery periods, and greater supply-chain uncertainty. Vendors may need to absorb lower profit margins or transfer additional costs to enterprise customers. These pressures are also encouraging suppliers to regionalise manufacturing, expand local inventories, and diversify sourcing, directly affecting platform pricing, service-level agreements, and deployment schedules.
Regional Analysis
North America held a dominant position in the Generative AI in Organizational Collaboration Market, accounting for 39.7% of global revenue and generating approximately USD 2.7 billion. This leadership is supported by high enterprise digital maturity, strong cloud adoption, and the early use of AI-enabled collaboration platforms across large companies and technology-driven industries.
Businesses in the United States and Canada are increasingly integrating AI into email, workplace messaging, shared documents, virtual meetings, and project management systems. This creates steady demand for advanced capabilities such as automated summarisation, enterprise knowledge search, meeting transcription, task routing, and workflow automation.
Asia Pacific is expected to be the fastest-growing region, supported by rapid enterprise digitalisation, improved high-speed connectivity, and expanding cloud adoption across China, India, Japan, and Southeast Asia. Companies in the region are managing larger distributed teams and increasingly adopting remote and hybrid work models. This is encouraging investment in AI-powered platforms that improve communication, automate repetitive tasks, and increase employee productivity.
Key Regions and Countries
- North America
- US
- Canada
- Europe
- Germany
- France
- The UK
- Spain
- Italy
- Rest of Europe
- Asia Pacific
- China
- Japan
- South Korea
- India
- Australia
- Rest of APAC
- Latin America
- Brazil
- Mexico
- Rest of Latin America
- Middle East & Africa
- GCC
- South Africa
- Rest of MEA
Market Dynamics
Drivers
| Driver | (~) % CAGR | Geographic Relevance | Impact Timeline |
|---|---|---|---|
| Enterprise AI productivity suites | +3.0% | North America, Europe, Asia Pacific | Short term (≤ 2 years) |
| Hybrid work normalization | +2.0% | Global urban economies | Medium term (2–4 years) |
| Cloud collaboration penetration | +1.8% | Europe, Asia Pacific | Short term (≤ 2 years) |
| Language automation in BPO | +1.2% | Asia Pacific, Latin America | Medium term (2–4 years) |
| Public sector digitalization | +0.9% | OECD, GCC, East Asia | Long term (≥ 4 years) |
Enterprise AI productivity suites
Enterprise AI productivity suites could add around 3.0% to the baseline CAGR by increasing software pricing and changing daily workflows within large organizations. AI-enabled productivity and collaboration plans are often priced 20–30% above standard packages, while major cloud providers continue to report low double-digit growth across these business segments.
OECD and national productivity data also show that knowledge-intensive industries have recorded annual output-per-hour gains of around 1–2% since 2020, supported by AI-assisted drafting, meeting summaries, and workflow automation.
Software and cloud services now account for more than 30% of total ICT spending in advanced economies. AI copilots represent approximately 5–10% of collaboration-suite expenditure, with this share expected to double within 2 years. Combined with renewal rates above 90% and broader company-wide deployment, higher per-user pricing and expanding seat volumes could significantly strengthen recurring revenue growth for generative AI collaboration platforms.
Restraints
| Restraint | (~) % CAGR | Geographic Relevance | Impact Timeline |
|---|---|---|---|
| AI data protection regulations | -2.2% | EU, UK, selected Asia | Short term (≤ 2 years) |
| High AI infrastructure costs | -1.8% | Global | Medium term (2–4 years) |
| Enterprise procurement cycles | -1.3% | North America, Europe | Short term (≤ 2 years) |
| On-premises security mandates | -1.0% | Financial services, government | Long term (≥ 4 years) |
| Macro interest rate pressure | -0.8% | Global | Short term (≤ 2 years) |
AI data protection regulations
AI-focused data protection regulations subtract approximately -2.2% from the baseline CAGR by delaying deployments and adding compliance overhead to generative AI collaboration rollouts. According to official EU communications and supervisory reports, general data protection rules and emerging AI-specific statutes have increased the share of enterprises reporting data-compliance-related ICT investment by more than 10 percentage points since 2020, while national data protection authorities in Europe and the UK have issued fines in the tens to hundreds of millions of euros for improper handling of personal data in digital services.
Central bank credit surveys indicate that, in this environment, roughly 20–25% of large firms in regulated sectors have postponed or scaled back certain AI projects due to legal uncertainty and audit risks, with average procurement cycles stretching by an additional 3–6 months.
Supervisory technology assessments from financial regulators and telecom authorities further note that firms are diverting 5–10% of planned AI budgets into consent management, data localization, model governance tooling, and legal review, compressing near-term discretionary spend on new generative collaboration features and lowering effective adoption velocity relative to the unconstrained baseline.
Challenges
| Challenge | (~) % CAGR | Geographic Relevance | Mitigation Horizon |
|---|---|---|---|
| Specialized AI talent gap | -2.0% | Global | Medium term (2–4 years) |
| Integration with legacy stacks | -1.7% | North America, Europe | Long term (≥ 4 years) |
| Model hallucination risk | -1.4% | Global | Medium term (2–4 years) |
| Change management fatigue | -1.1% | Global | Short term (≤ 2 years) |
| Vendor lock-in concerns | -0.9% | Global enterprises | Long term (≥ 4 years) |
Specialized AI talent gap
The shortage of specialized AI and MLOps talent generates an estimated friction drag of -2.0% on the market’s maximum growth trajectory by constraining how quickly enterprises can design, deploy, and operate generative collaboration systems.
According to labour market data from the OECD and national statistics offices, vacancies in advanced ICT roles have risen by more than 50% since 2019, while technology councils and professional bodies report that only around 20–25% of firms have in-house expertise to manage large-scale AI deployments end-to-end.
Central bank and finance ministry wage statistics indicate that salaries for machine learning engineers and AI architects have grown 15–20% faster than average ICT wages over the past 3–4 years, elevating opex for both vendors and enterprise buyers. Public universities and vocational systems, per education ministry data, are only gradually expanding AI-related program capacity, with projected graduation numbers covering at best 60–70% of anticipated demand by the late 2020s.
Opportunities
| Opportunity | (~) % CAGR | Geographic Relevance | Execution Window |
|---|---|---|---|
| Verticalized AI collaboration suites | +2.5% | Global | Medium term (2–4 years) |
| SMB-focused AI offerings | +2.0% | Global | Short term (≤ 2 years) |
| Emerging market localization | +1.7% | Asia, Africa, Latin America | Long term (≥ 4 years) |
| Compliance-ready AI archives | +1.3% | Regulated sectors | Medium term (2–4 years) |
| Partner-led implementation ecosystems | +1.0% | Global | Short term (≤ 2 years) |
Verticalized AI collaboration suites
Verticalized AI collaboration suites could add around 2.5% to the baseline CAGR by creating new revenue streams in industries where general-purpose tools are less effective. Productivity gaps between digital leaders and laggards in healthcare, manufacturing, and legal services can reach 20–30% per worker.
By adding industry-specific terminology, templates, compliance processes, and regulated workflows, vendors can charge price premiums of 15–25% per user while increasing demand for analytics, security, and compliance modules.
Vertical SaaS platforms can also achieve renewal rates above 95% and net revenue retention exceeding 110%, supporting stronger customer lifetime value. Accessing even a small portion of under-digitalized knowledge and frontline workers could improve platform operating margins by 2–3 percentage points. Therefore, specialized product development and targeted sales strategies implemented over the next 2–4 years could provide meaningful upside to the current market growth forecast.
Key Players Analysis
Tier-1 companies in the Generative AI in Organizational Collaboration Market include Microsoft, Google (Alphabet), Salesforce, and Adobe. Their leadership is supported by large cloud networks, strong financial resources, and deep integration of generative AI into workplace software.
Microsoft generated total revenue of USD 281.7 billion in FY2025. Its Productivity and Business Processes segment, which includes Microsoft 365 and Teams, recorded USD 120.8 billion and grew 13% year over year, while Intelligent Cloud generated USD 106.3 billion. Microsoft has integrated Copilot across Microsoft 365 and operates more than 400 data centres across 70 regions.
It also added over 2 gigawatts of AI-capable capacity within a single year. Alphabet generated USD 402.8 billion in revenue in 2025, increasing 15% year over year. Google Cloud, which includes Workspace and Gemini-enabled collaboration features, expanded 36% to USD 58.7 billion.
Tier-2 competitors include Salesforce, Cisco, Atlassian, Zoom, Asana, and Notion. Salesforce has historically invested around 14%–18% of its revenue in research and development, supporting the integration of Einstein generative AI into Slack and CRM workflows. Adobe reported record FY2025 revenue of USD 23.7 billion, with over one-third of its annual recurring revenue classified as AI-influenced ARR.
Top Key Players in the Market
- Microsoft Corporation
- Google LLC
- Salesforce, Inc.
- Adobe Inc.
- Cisco Systems, Inc.
- Atlassian Corporation
- Zoom Video Communications, Inc.
- Asana, Inc.
- Notion Labs, Inc.
Recent Developments
- In 2026, Microsoft began construction of a new data-centre cluster in Bergheim, Germany, strengthening its cloud and artificial intelligence infrastructure across Europe. The project is part of the company’s previously announced EUR 3.2 billion investment programme, which aims to more than double its German cloud and AI capacity.
- In 2026, Alphabet reported capital expenditure of USD 91.4 billion for 2025, reflecting its large-scale investment in artificial intelligence and cloud infrastructure. Approximately 60% of this spending was directed towards servers, while the remaining 40% supported data centres and networking equipment. Alphabet also sold more than 8 million Gemini Enterprise seats within four months, indicating strong early business adoption.
Report Scope
| Report Features | Description |
|---|---|
| Market Value (2025) | USD 6.8 Billion |
| Forecast Revenue (2035) | USD 54.5 Billion |
| CAGR (2026-2035) | 23.1% |
| Base Year for Estimation | 2025 |
| Historic Period | 2020-2024 |
| Forecast Period | 2026-2035 |
| Report Coverage | Revenue Forecast, Market Dynamics, Competitive Landscape, Recent Developments |
| Segments Covered | By Component (Solution, Services); By Deployment Mode (Cloud-Based, On-Premise); By Organization Size (Small and Medium-Sized Enterprises, Large Enterprises); By Industry Vertical (IT and Telecommunications, BFSI, Healthcare, Manufacturing, Retail, Education, Government and Public Sector, Other) |
| Regional Analysis | North America – US, Canada; Europe – Germany, France, The UK, Spain, Italy, Rest of Europe; Asia Pacific – China, Japan, South Korea, India, Australia, Singapore, Rest of APAC; Latin America – Brazil, Mexico, Rest of Latin America; Middle East & Africa – GCC, South Africa, Rest of MEA |
| Competitive Landscape | Microsoft Corporation, Google LLC, Salesforce, Inc., Adobe Inc., Cisco Systems, Inc., Atlassian Corporation, Zoom Video Communications, Inc., Asana, Inc., Notion Labs, Inc. |
| Customization Scope | Customization for segments, region/country-level will be provided. Moreover, additional customization can be done based on the requirements. |
| Purchase Options | We have three licenses to opt for: Single User License, Multi-User License (Up to 5 Users), Corporate Use License (Unlimited Users and Printable PDF) |





























