


Report Overview
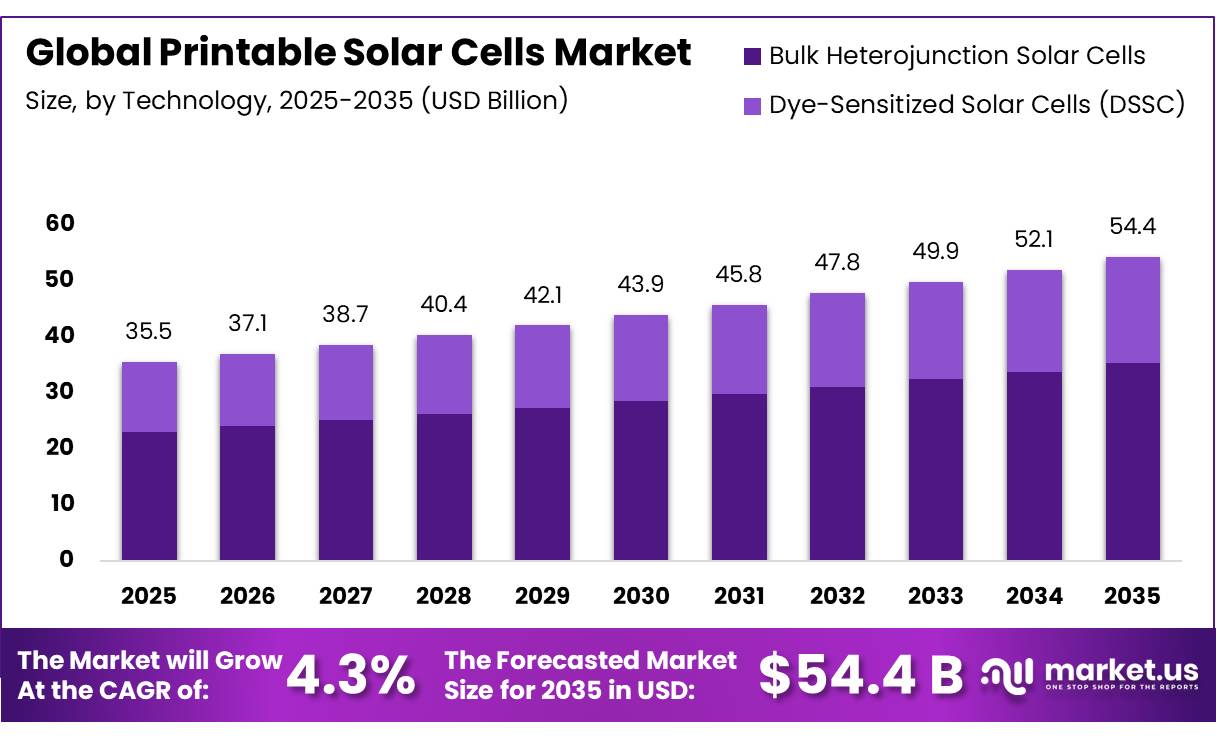
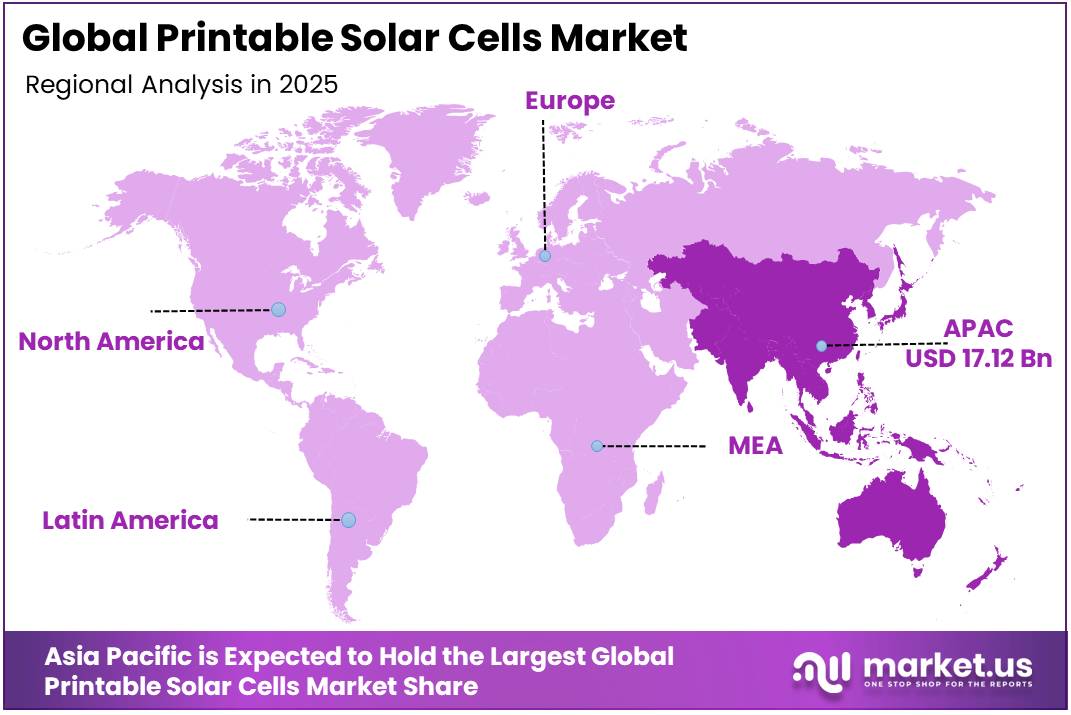
In 2025, the Global Printable solar cells Market was valued at USD 35.5 billion, and between 2026 and 2035, this market is estimated to register a CAGR of 4.3%, reaching about USD 54.4 billion by 2035. Asia Pacific held a dominant market position, capturing more than a 48.2% share, holding USD 17.12 billion in revenue.
Printable solar cells are emerging as a flexible photovoltaic platform built through solution processing and scalable coating methods. Their lightweight structure supports roofs, façades, portable equipment, and electronics that cannot easily carry rigid modules.
- In 2025, global renewable capacity additions increased by 16% and reached 800 gigawatts, strengthening commercial interest in adaptable solar formats for unconventional surfaces, distributed applications, and locally produced clean electricity within rapidly evolving energy systems.
Key Takeaways
- The global printable solar cells market was valued at 35.5 billion in 2025.
- The global market is projected to grow at a CAGR of 4.3% and is estimated to reach 54.4 billion by 2035.
- On the basis of technology, bulk heterojunction solar cells dominated the market, constituting 65.0% of the total market share.
- Based on installation, roof-mounted systems dominated the printable solar cells market, with a substantial market share of around 42.0%.
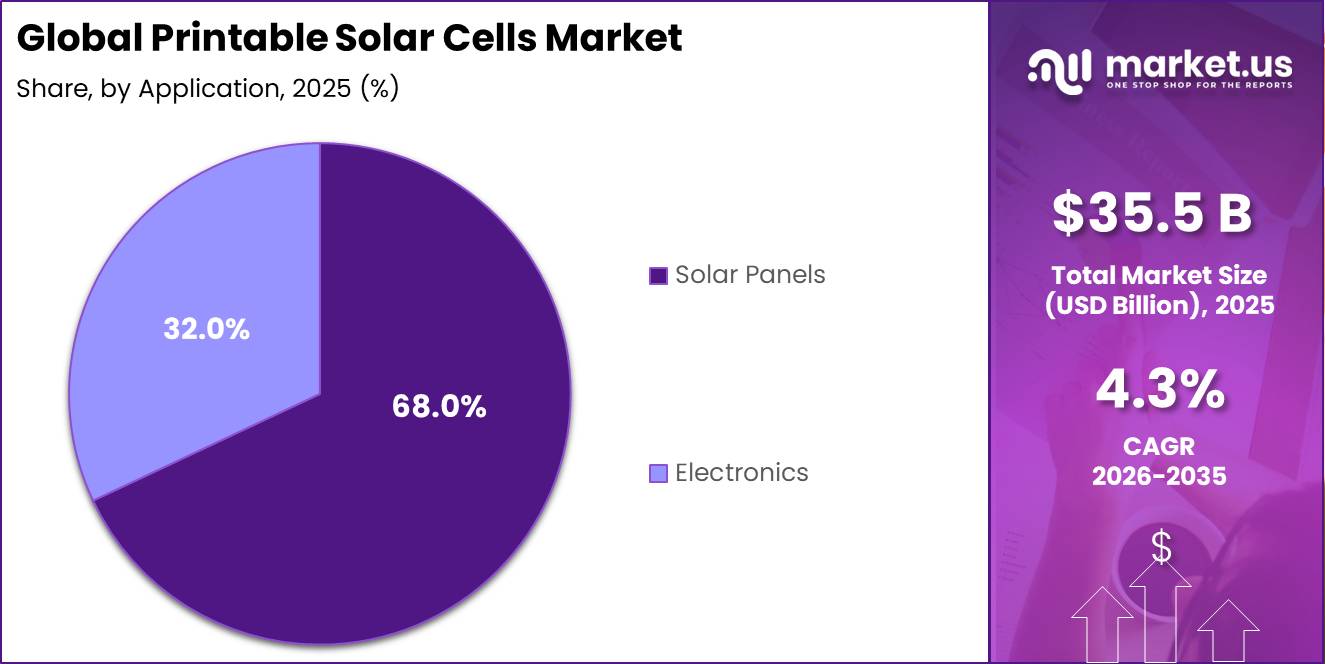
- Based on application, solar panels led the market, comprising 68.0% of the total market.
- Among end users, the residential segment held a major share in the printable solar cells market, accounting for 34.0% of the market share.
- In 2025, Asia Pacific was the most dominant region in the printable solar cells market, accounting for 48.2% of the total market.
The industrial scenario is moving from laboratory research toward pilot manufacturing, durability validation, and specialized deployment. Solar photovoltaic additions exceeded 600 gigawatts worldwide, cumulative capacity approached 2,800 gigawatts, and 30 countries installed more than one gigawatt during the year. This scale supports investment in conductive inks, flexible substrates, transparent electrodes, encapsulation films, precision printing, and roll-to-roll equipment, while encouraging partnerships among chemical suppliers, electronics producers, building-material companies, and photovoltaic manufacturers across increasingly diversified end-use environments.
Government-backed research is reducing technical and commercialization risk. The United States Department of Energy allocated $44 million to thin-film photovoltaic projects, including tandem systems using perovskite materials. One selected project targets module efficiency of 27%, while another received a $7 million award to advance durable perovskite-silicon tandem modules toward production. These programs address manufacturability, process control, heat exposure, light stability, testing, and repeatability, which remain essential for bankable printable solar products before wider commercial adoption.
Growth opportunities are strongest in low-load rooftops, curved structures, building-integrated photovoltaics, indoor sensors, portable charging, vehicles, and lightweight off-grid systems. Japan’s next-generation solar strategy targets about 20 gigawatts of perovskite deployment by 2040 and seeks early gigawatt-scale production during the present decade. The European Union also maintains a 40% manufacturing benchmark for annual net-zero technology deployment needs, supporting regional investment in advanced cells, materials, equipment, testing capacity, and supply-chain development across emerging clean-energy value chains.
Technology Analysis
Bulk Heterojunction Solar Cells dominate with 65.00% through scalable, flexible production
In 2025, Bulk Heterojunction Solar Cells held a dominant market position, capturing more than a 65.00% share. Their leadership was supported by solution-based processing, lightweight construction, mechanical flexibility, and compatibility with scalable printing methods. The blended donor and acceptor structure supports effective charge separation within a thin active layer, making the technology suitable for flexible modules, building surfaces, portable products, and compact electronics. Manufacturers also benefit from lower material use and the possibility of continuous roll-to-roll production.
- In July 2026, according to the Fraunhofer Institute for Solar Energy Systems, organic solar cells developed under the ENLIGHTENED project achieved up to 25% efficiency under warm-white light-emitting diode illumination at 500 lux and remained stable at 85°C. The project targets 30% efficiency for small cells and 25% for modules.
Dye-Sensitized Solar Cells are the growing segment, supported by reliable performance under diffuse sunlight and indoor lighting. Their semi-transparent appearance, adaptable colors, and ability to operate in low-light environments encourage adoption in windows, sensors, smart devices, portable electronics, and decorative building applications. Ongoing improvements in electrolytes, sealing, and durability support broader commercial use.
Installation Analysis
Roof-Mounted leads with 42.00% as lightweight cells support building integration
In 2025, Roof-Mounted held a dominant market position, capturing more than a 42.00% share. Its leadership was supported by access to unused building space, lower land requirements, and suitability for homes, offices, factories, warehouses, and public facilities. Printable solar cells strengthen this installation format because their lightweight and flexible construction can support surfaces that may not accommodate heavier conventional modules. Their adaptable appearance also encourages integration into roofs, façades, and building materials.
- In May 2026, according to the United Kingdom Department for Energy Security and Net Zero, 269,000 solar installations were completed during 2025, including around 255,000 rooftop systems. The country also surpassed 2 million total solar installations in March 2026.
Ground-Mounted is the growing segment, supported by demand for larger generation sites and easier system expansion. These projects can use open land, optimized panel positioning, and centralized maintenance to serve commercial, industrial, community, and utility-scale electricity needs. Printable technologies may widen this opportunity by enabling lighter module structures, simplified transportation, and scalable manufacturing. Growth will depend on durability, weather resistance, land availability, grid connections, permitting, and competitive project economics.
Application Analysis
Solar Panels dominate with 68.00% as flexible formats widen energy applications
In 2025, Solar Panels held a dominant market position, capturing more than a 68.00% share. Their leadership was supported by use across rooftops, façades, portable systems, and power projects. Printable designs can reduce weight, adapt to curved surfaces, and support manufacturing on flexible substrates. These advantages make solar panels suitable where rigid glass modules face structural, handling, or design limits. Manufacturers are improving active materials, electrodes, and protective layers to strengthen output and operating life.
- In July 2025, according to the Fraunhofer Institute for Solar Energy Systems, indoor photovoltaic cells achieved more than 40% conversion efficiency under artificial lighting of only 100 The result demonstrated electricity generation under very low illumination for autonomous connected devices.
Electronics is the growing segment, driven by demand for self-powered sensors, smart labels, wearable devices, remote controls, and Internet of Things equipment. Printable solar cells can be integrated into compact products without bulky power systems. Their low-light performance may reduce battery replacement requirements and support longer device operation. Future adoption will depend on durability, efficient energy management, scalable printing, and integration with electronic components.
End User Analysis
Residential leads with 34.00% as printable designs support flexible home installations
In 2025, Residential held a dominant market position, capturing more than a 34.00% share. Its leadership was supported by growing household interest in onsite electricity generation, lower dependence on grid power, and better use of rooftops, façades, balconies, and other limited surfaces. Printable solar cells suit residential settings because their lightweight, flexible, and visually adaptable form can support building-integrated designs without requiring heavy mounting structures. Their potential for low-temperature production may also support wider product customization.
- In July 2026, according to the U.S. Energy Information Administration, estimated small-scale solar photovoltaic capacity during 2025 reached 40,474.8 megawatts in the residential sector, 16,031.4 megawatts in the commercial sector, and 2,999.3 megawatts in the industrial sector.
Commercial and Industrial is the growing segment, supported by demand for onsite renewable power across offices, factories, warehouses, retail buildings, and logistics facilities. Printable formats can be integrated into roofs, façades, windows, and lightweight structures, helping businesses use larger surface areas for electricity generation. Adoption is likely to improve as durability, efficiency, installation methods, and cost competitiveness advance, while supporting sustainability targets and distributed energy strategies worldwide.
Key Market Segments
By Technology
- Bulk Heterojunction Solar Cells
- Dye-Sensitized Solar Cells (DSSC)
By Installation
- Roof-Mounted
- Ground-Mounted
- Portable
- Others
By Application
- Solar Panels
- Electronics
By End User
- Residential
- Commercial and Industrial
- Utilities
- Others
Driver Analysis
Perovskite & OPV efficiency/stability breakthroughs in printable architectures
Efficiency and stability improvements in perovskite and organic photovoltaic (OPV) cells are a primary structural driver for printable solar, materially altering both cost per watt and viable application space between 2026 and 2030. Laboratory single‑junction perovskite efficiencies have surpassed 26.7% and tandem perovskite‑silicon cells have crossed 34% by 2025–2026, while commercial module efficiencies in mainstream PV now regularly reach 22–25%.
For printable formats, these advances translate into practical module efficiencies in the 15–20% range for flexible and semi‑transparent films over the forecast window, compared with low‑teens levels earlier in the decade; this cuts the levelized cost of energy (LCOE) by an estimated 15–25% for rooftop and BIPV use cases and improves the watt‑per‑square‑meter metric critical for constrained urban surfaces. On the stability side, incremental gains in operational lifetimes from sub‑5‑year equivalent performance to 10‑ to 15‑year targets under accelerated aging change business models from short‑lived niche deployments to assets that can be financed on 8‑ to 12‑year power purchase agreement (PPA) tenors.
For technology vendors, this shift supports a transition from selling low‑margin hardware into bundled energy‑as‑a‑service or subscription monitoring models, where recurring O&M and remote performance analytics can represent 15–30% of lifetime revenue. These improvements also unlock bankability with institutional financiers, since modules that maintain >80% of initial output beyond year 10 can be structured into green bonds and sustainability‑linked loans, tightening weighted average cost of capital by 100–200 basis points relative to early‑stage experimental projects.
Drivers Impact Analysis
| Driver | (~) % Impact on CAGR | Geographic Relevance | Impact Timeline |
|---|---|---|---|
| Perovskite & OPV efficiency/stability breakthroughs in printable architectures | +2.2% | APAC core, EU, North America corridors | Medium term (2–4 years) |
| Roll-to-roll manufacturing scale-up and BOM cost compression in flexible PV | +1.9% | APAC core, EU, North America, South America spill-over | Medium term (2–4 years) |
| Building-Integrated PV (BIPV) and architectural glass integration of printable modules | +1.6% | EU core, North America, selected APAC metros | Long term (≥ 4 years) |
| IoT and indoor energy harvesting using printable solar for self-powered devices | +1.4% | North America, EU, APAC corridors | Medium term (2–4 years) |
| Domestic-content and localization mandates in key solar markets | +1.1% | India core, wider APAC, selective Middle East | Short–medium term (≤ 4 years) |
| Corporate decarbonization targets and ESG-linked financing favouring lightweight PV | +0.8% | Global, with North America/EU lead | Long term (≥ 4 years) |
Restraint Analysis
Environmental stability and lifetime shortfall
The most fundamental restraint is the environmental stability gap between printable solar technologies—primarily perovskite and organic photovoltaic (OPV) architectures—and incumbent crystalline silicon, with multiple studies highlighting rapid degradation under heat, moisture and UV that keeps commercial lifetimes in the single‑digit‑year range versus 25‑ to 30‑year warranties for conventional modules. Perovskite layers can start degrading near temperatures of 85 °C even in inert atmospheres, while photo‑oxidation in the presence of oxygen can lead to substantial decomposition within hours under illumination, and OPV devices show strong sensitivity to humidity unless highly optimized inverted structures and encapsulation are used.
In practical outdoor conditions especially in hot, humid APAC and Middle East markets—this translates into expected power output loss well above 1% per year, potentially reaching cumulative degradation of 20–30% over 10 years, compared with typical guarantees for silicon modules that retain ≥80–85% of initial power after 25 years. For investors and asset owners, such shortfall undermines levelized cost of electricity (LCOE) modeling: if a project designed around printable solar must be depreciated over 8–12 years instead of 20–25, annualized capex recovery rises by 50–70%, pushing LCOE into ranges that are 20–40% higher than competing rooftop PV, which directly erodes competitiveness in core residential and commercial segments.
This reality forces printable technologies into niche, low‑power or indoor applications and discourages utility‑scale or mainstream rooftop deployments, shrinking the addressable market by an order of magnitude. Strategically, the stability gap delays large‑area module commercialization, forces manufacturers to over‑invest in encapsulation and deters bank financing that depends on long‑term performance data, collectively subtracting an estimated 2.3 percentage points from potential CAGR by deferring high‑volume segments beyond the 2026–2034 window.
Restraint Impact Analysis
| Restraint | (~) % Impact on CAGR Forecast | Geographic Relevance | Impact Timeline |
|---|---|---|---|
| Environmental stability and lifetime shortfall | -2.3% | Global (EU, North America, APAC core) | Long term (≥ 4 years) |
| Cost competitiveness vs mainstream PV modules | -1.8% | Global, especially price-sensitive APAC corridors | Medium term (2–4 years) |
| Supply chain concentration and input volatility | -1.5% | APAC core, EU, North America | Medium term (2–4 years) |
| Regulatory and building-code uncertainty for BIPV | -1.2% | EU, North America, selected APAC metros | Long term (≥ 4 years) |
| Bankability and financing constraints | -1.1% | Global, with EMDEs most exposed | Medium–long term (≥ 3 years) |
| Materials sustainability and end-of-life concerns | -0.9% | Global, stronger in EU and North America | Long term (≥ 4 years) |
Opportunity Analysis
Smart surfaces for mobility and infrastructure
Globally, road fleets exceed 1 billion vehicles, aviation and drone fleets number in the tens of millions, and built infrastructure offers billions of square meters of surface area; even assuming that only 1–2% of these assets adopt printable solar coatings at modest power densities of 50–100 W/m², the incremental technical addressable market could reach several hundred gigawatts of equivalent capacity, translating to tens of billions of dollars in module and integration revenue over a decade.
Unit economics are attractive where fuel and maintenance savings are material: for long‑haul trucks, coating 20–30 m² of trailer roof and sides could deliver 1–3 kWh/day in typical conditions, enough to power telematics, refrigeration pre‑cooling or auxiliary loads and save hundreds of litres of diesel annually; at fuel prices of USD 1/litre, this equates to USD 100–300 per truck per year and several percentage points of margin uplift in tight logistics businesses.
Crucially, this is an opportunity rather than a current driver because most OEMs and infrastructure owners have yet to standardize PV‑ready designs, and there are few scaled product platforms or service offerings that bundle surface design, printing, installation and lifecycle monitoring; go‑to‑market models would need to target B2B contracts with fleet operators and public‑private partnerships for infrastructure, with payback periods of 3–7 years and contract sizes in the USD 0.5–5 million range for pilot networks.
Opportunity Impact Analysis
| Opportunity | (~) % Potential CAGR Upside | Geographic Relevance | Execution Window |
|---|---|---|---|
| Smart surfaces for mobility and infrastructure | +2.4% | APAC emerging, EU, North America core | Medium term (2–4 years) |
| Wearables and consumer IoT energy skins | +2.0% | North America, EU, APAC metros | Medium term (2–4 years) |
| Printable PV-as-a-service and design platforms | +1.7% | Global, with APAC/EU lead | Short–medium term (≤ 4 years) |
| Agrivoltaics and lightweight off-grid micro-assets | +1.5% | APAC emerging, Africa, Latin America | Medium–long term (≥ 3 years) |
| Cross-technology perovskite/printed module licensing | +1.3% | Global, especially technology hubs | Long term (≥ 4 years) |
| M&A roll-ups of flexible PV and specialty materials | +1.1% | Global, with strong EU/APAC activity | Medium term (2–4 years) |
Challenges Analysis
Complex global PV supply chains
Solar supply chains span polysilicon, wafers/ingots, cells, modules, specialty materials and logistics, with multiple analyses noting that upstream stages, especially polysilicon and wafers, remain heavily concentrated in a single country or region, while downstream manufacturing is globally distributed. Over 2021–2024, high commodity prices and bottlenecks pushed average panel prices up by around 20% and created delays in deliveries across continents, with transit times on key APAC–EU and APAC–US routes stretching by 2–4 weeks compared to pre‑disruption baselines.
Printable solar manufacturers depend additionally on specialized inks, substrates and barrier films, which are often sourced from a narrow set of chemical and materials suppliers; when freight capacity tightens or geopolitical tensions trigger trade barriers, batch‑level delays of 10–30 days and cost surges of 10–25% on critical inputs are common, forcing rescheduling of production runs and re‑pricing of EPC contracts. These dynamics do not freeze sales but erode unit economics—adding several cents per watt in unexpected cost and inflating working capital requirements as inventory buffers increase from, for example, 30 days to 60–90 days of stock.
To navigate this, firms must invest in multi‑sourcing strategies, regional warehousing, and real‑time supply chain visibility tools, while accepting that truly diversified supply chains outside current concentration hubs can cost 13–70% more on a manufacturing basis and roughly 30% more on average in the absence of subsidies. Strategically, this pushes companies to balance cost efficiency and resilience, building flexibility into supplier portfolios and logistics, which takes 2–4 years to stabilize and imposes an estimated 1.6 percentage‑point friction drag on printable solar CAGR relative to a perfectly smooth supply chain environment.
Challenges Impact Analysis
| Challenge | (~) % CAGR Friction | Geographic Relevance | Mitigation Horizon |
|---|---|---|---|
| Challenge | (~) % CAGR Friction Drag | Geographic Relevance | Mitigation Horizon |
| Complex global PV supply chains | -1.6% | APAC logistics corridors, EU, North America | Medium term (2–4 years) |
| Manufacturing scale-up and yield variability | -1.4% | APAC core, EU industrial hubs | Long term (≥ 4 years) |
| Specialized talent and skills gap | -1.2% | India core, wider APAC, EU | Medium term (2–4 years) |
| Performance variability and quality assurance | -1.1% | Global early-adopter markets | Long term (≥ 4 years) |
| Regulatory alignment for novel form factors | -1.0% | EU regulatory hubs, North America, APAC metros | Long term (≥ 4 years) |
| Capital allocation under diversified supply chains | -0.9% | EU, North America, emerging local manufacturing hubs | Medium term (2–4 years) |
Geopolitical Impact Analysis
Trade Barriers and Supply-Chain Realignment Reshaping Printable Solar Cell Manufacturing
Geopolitical tensions are reshaping the printable solar cells market through tariff escalation, trade remedies, and localization policies across photovoltaic supply chains. A 2025 European Union assessment found that 79% of the region’s solar photovoltaic system supply depended on one third country. This dependence increases concern over access to production equipment, specialty films, conductive materials, and other inputs needed for emerging printable technologies.
United States policy is changing the cost structure of imported solar inputs. From January 1, 2025, tariffs on Chinese solar wafers and polysilicon increased to 50%. Although printable cells use different material systems, photovoltaic trade barriers can alter investment priorities, supplier selection, project economics, and funding decisions across the solar industry.
Trade enforcement has also widened beyond China. In April 2025, the United States Department of Commerce finalized dumping margins of 125.37% for Cambodia, 111.45% for Thailand’s rate, and 271.28% for the Vietnam-wide entity on crystalline photovoltaic cells. These measures may redirect procurement and encourage buyers to assess alternative technologies and regional supply options.
Europe is responding through resilience-based procurement. From January 2026, non-price criteria apply to 30% of renewable auction volumes, or at least 6 gigawatts per member country. This policy may support regional printable-cell pilot lines, material partnerships, and traceable manufacturing. However, origin rules, compliance costs, and supplier qualification requirements could delay commercialization and increase expenses.
Regional Analysis
Asia Pacific dominates with 48.20% and USD 17.12 billion, while Europe records the fastest growth
In 2025, Asia Pacific held a dominant position in the Printable Solar Cells Market, capturing more than a 48.20% share and generating USD 17.12 billion. Its lead reflects strong solar deployment, extensive electronics manufacturing, supportive clean-energy policies, and expanding demand for lightweight power solutions. In April 2026, the International Renewable Energy Agency reported that Asia added 513.3 gigawatts of renewable capacity during 2025, representing 74.2% of global additions, while total regional capacity reached 2,891 gigawatts.
Europe is the fastest-growing region, supported by building-integrated photovoltaics, indoor electronics, flexible modules, and policies encouraging domestic clean-technology production. In July 2026, the European Commission reported that European Union solar generation reached 275 terawatt-hours in 2025, increasing by 18%, while 56 gigawatts of new solar capacity were installed. This expanding installation base, combined with research strength in organic and perovskite cells, creates favorable conditions for printable solar commercialization across residential, commercial, industrial, and portable applications.
Key Regions and Countries Covered
- North America
- The US
- Canada
- Europe
- Germany
- France
- The UK
- Spain
- Italy
- Russia & CIS
- Rest of Europe
- APAC
- China
- Japan
- South Korea
- India
- ASEAN
- Rest of APAC
- Latin America
- Brazil
- Mexico
- Rest of Latin America
- Middle East & Africa
- GCC
- South Africa
- Rest of MEA
Key Players Analysis
Printable solar cell companies are prioritizing efficiency, flexible formats, intellectual property, and scalable printing in 2026. Oxford PV is extending commercialization through a U.S. patent licensing agreement with First Solar, while Dracula Technologies is advancing indoor organic photovoltaics through LAYER V2.0, which delivers a 30% performance increase. Heliatek emphasizes lightweight façade modules, while Epishine focuses on indoor light harvesting for connected electronics.
Competitive advantage depends on manufacturing repeatability, durability, design, and partnerships across construction, mobility, and electronics. Oxford PV’s portfolio of more than 400 granted patents supports technology protection, while Dracula Technologies’ automated factory can produce up to 150 million square centimeters of organic photovoltaic devices annually. Companies are also expanding beyond conventional panels into façades, electric vehicles, sensors, smart labels, and battery-free Internet of Things devices. This strategy helps suppliers differentiate through power density, low-light performance, integration, and lower maintenance rather than price alone.
Market Key Players
- Heliatek GmbH
- Oxford PV
- Saule Technologies
- Epishine AB
- ASCA (ARMOR Group)
- infinityPV ApS
- Greatcell Solar Limited
- Solaronix SA
- Dracula Technologies
- Ascent Solar Technologies, Inc.
- MiaSolé Hi-Tech Corp.
- NanoFlex Power Corporation
- DuPont de Nemours, Inc.
- Toshiba Corporation
- SolarWindow Technologies, Inc.
Key Development
- In June 2026, Ascent Solar Technologies reported zero power loss in its flexible thin-film solar products after atomic oxygen exposure equivalent to six months in orbit at the International Space Station’s 400-kilometre altitude. The products used a 1-mil fluorinated ethylene propylene film as the primary barrier and encapsulant.
- In June 2026, Oxford PV and the Fraunhofer Institute for Solar Energy Systems introduced perovskite-silicon modules using Matrix Shingle interconnection technology. The companies developed a 491-watt rooftop module and a 546-watt bifacial module, with both systems achieving 6% efficiency across the complete module area.
- In June 2026, Dracula Technologies and Paragon ID expanded their partnership to move the XgenTag-L battery-free Bluetooth smart tag from pilot production to large-scale industrial deployment. The agreement included a multi-year order covering several hundred thousand LAYER organic photovoltaic modules annually.
Report Scope
| Report Features | Description |
|---|---|
| Market Value (2025) | USD 35.5 Bn |
| Forecast Revenue (2035) | USD 54.4 Bn |
| CAGR (2026-2035) | 4.3% |
| Base Year for Estimation | 2025 |
| Historic Period | 2020-2024 |
| Forecast Period | 2026-2035 |
| Report Coverage | Revenue Forecast, Market Dynamics, Competitive Landscape, Recent Developments |
| Segments Covered | By Technology (Bulk Heterojunction Solar Cells and Dye-Sensitized Solar Cells (DSSC)), By Installation (Roof-Mounted, Ground-Mounted, Portable, and Others), By Application (Solar Panels and Electronics), By End User (Residential, Commercial and Industrial, Utilities, and Others), |
| Regional Analysis | North America – The US & Canada; Europe – Germany, France, The UK, Spain, Italy, Russia & CIS, Rest of Europe; APAC– China, Japan, South Korea, India, ASEAN & Rest of APAC; Latin America– Brazil, Mexico & Rest of Latin America; Middle East & Africa– GCC, South Africa, & Rest of MEA |
| Competitive Landscape | Heliatek GmbH, Oxford PV, Saule Technologies, Epishine AB, ASCA (ARMOR Group), infinityPV ApS, Greatcell Solar Limited, Solaronix SA, Dracula Technologies, Ascent Solar Technologies, Inc., MiaSolé Hi-Tech Corp., NanoFlex Power Corporation, DuPont de Nemours, Inc., Toshiba Corporation, and SolarWindow Technologies, Inc. |
| Customization Scope | Customization for segments, region/country-level will be provided. Moreover, additional customization can be done based on the requirements. |
| Purchase Options | We have three licenses to opt for: Single User License, Multi-User License (Up to 5 Users), Corporate Use License (Unlimited Users and Printable PDF) |





































