


Report Overview
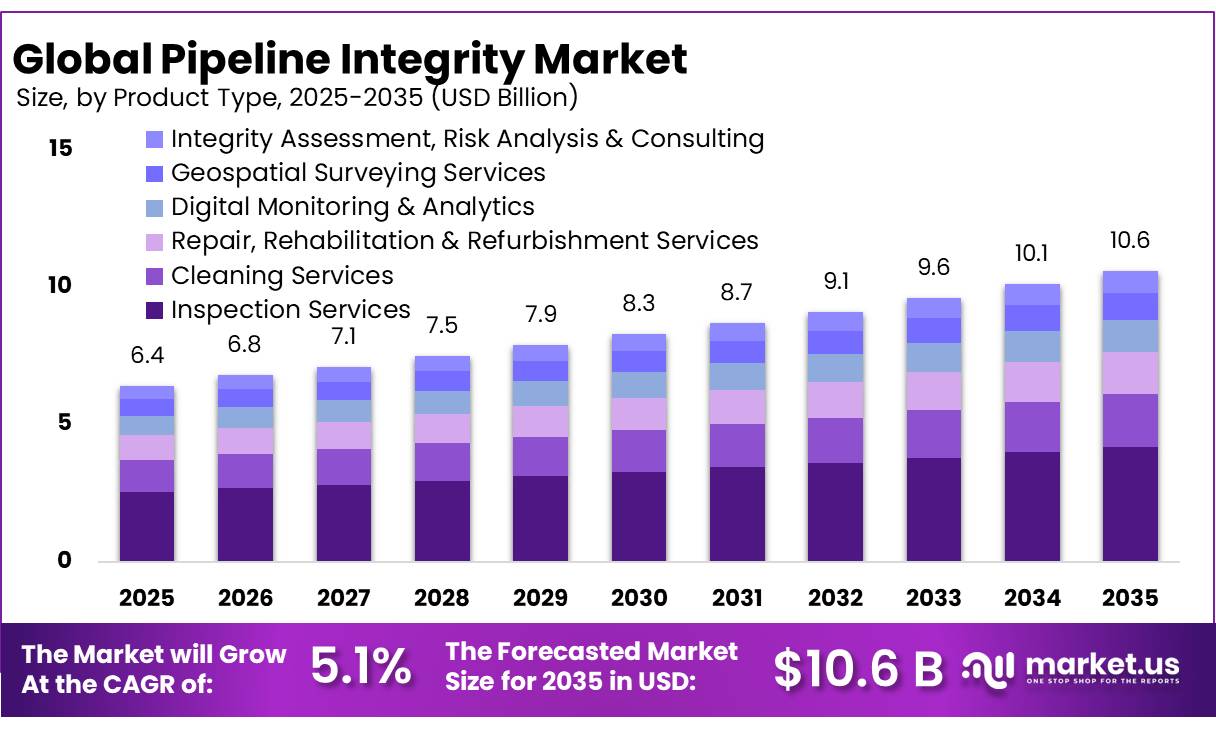
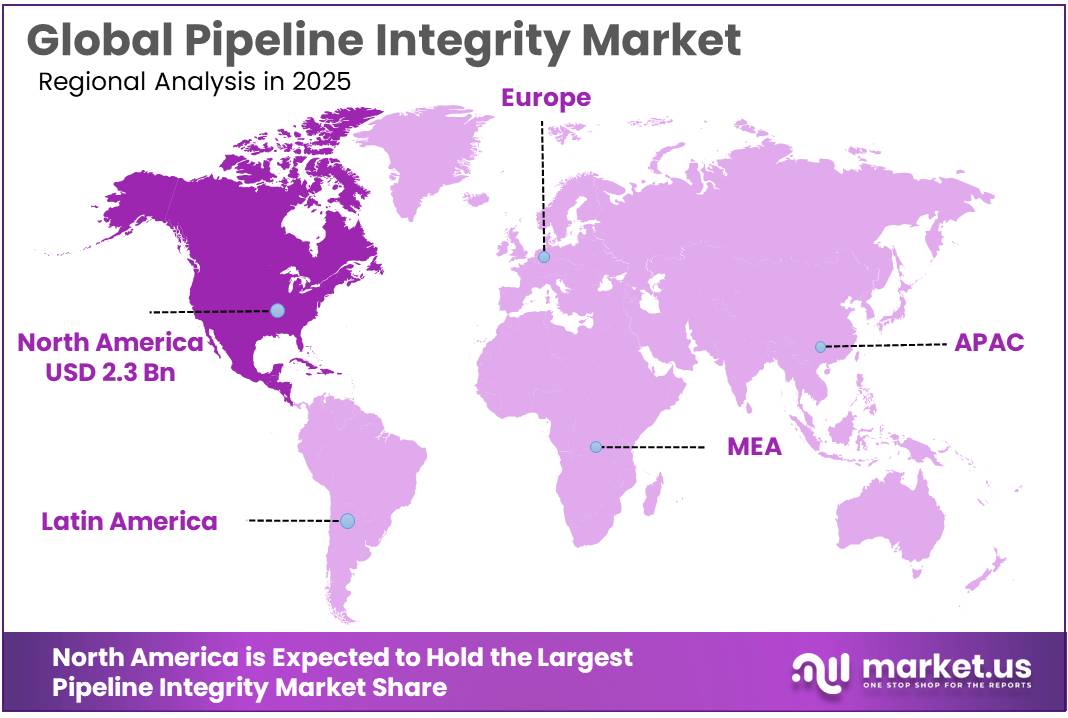
The Global Pipeline Integrity Market size is expected to be worth around USD 10.6 Billion by 2035, from USD 6.4 Billion in 2025, growing at a CAGR of 5.1% during the forecast period from 2026 to 2035. In 2025, North America held a dominant market position, capturing more than a 37.00% share, holding USD 2.3 Billion revenue.
Pipeline integrity is an essential part of the oil and gas, chemical, petrochemical, and energy transportation industries. It focuses on maintaining pipelines in safe operating condition throughout their service life by identifying corrosion, cracks, metal loss, weld defects, pressure-related damage, and leakage risks. Pipeline integrity management combines inspection, risk assessment, preventive maintenance, defect repair, and continuous monitoring to reduce failures and protect people, property, and the environment.
- According to the U.S. Department of Transportation’s Pipeline and Hazardous Materials Safety Administration (PHMSA), approximately 3.3 million miles of pipelines were overseen by 207 federal inspection and enforcement staff and 456 state inspectors, covering nearly 3,000 operating companies, based on data reported in February 2026. This extensive infrastructure creates a continuing need for inspections, repairs, corrosion prevention, and condition monitoring.
Corrosion prevention, ageing infrastructure, environmental protection, and regulatory compliance are major factors driving demand for pipeline integrity solutions. The PHMSA identifies corrosion, excavation damage, material defects, natural forces, and operating errors as important pipeline threats. Its historical data show that corrosion accounted for approximately 18% of pipeline incidents on average between 1998 and 2017, highlighting the importance of protective coatings, cathodic protection, corrosion monitoring, and regular condition assessments.
- Government initiatives are also encouraging stronger pipeline safety practices. In March 2025, PHMSA issued an advisory bulletin promoting pipeline safety management systems among regulated pipeline operators. In January 2025, the agency announced updated gas pipeline leak-detection and repair requirements, estimating potential annual public benefits of USD 1.5 billion and methane-emission reductions of up to 500,000 metric tons across the covered infrastructure. These initiatives strengthen the focus on systematic risk assessment, leak prevention, maintenance planning, and improved monitoring.
Government initiatives are also encouraging stronger pipeline safety practices. In March 2025, PHMSA issued an advisory bulletin promoting pipeline safety management systems among regulated pipeline operators. In January 2025, the agency announced updated gas pipeline leak-detection and repair requirements, estimating potential annual public benefits of USD 1.5 billion and methane-emission reductions of up to 500,000 metric tons across the covered infrastructure.
Key Takeaways
- Pipeline Integrity Market size is expected to be worth around USD 10.6 Billion by 2035, from USD 6.4 Billion in 2025, growing at a CAGR of 5.1%.
- Inspection Services held a dominant market position, capturing more than a 39.50% share.
- Natural Gas held a dominant market position, capturing more than a 46.30% share.
- Transmission Pipelines held a dominant market position, capturing more than a 39.00% share.
- Services held a dominant market position, capturing more than a 54.00% share.
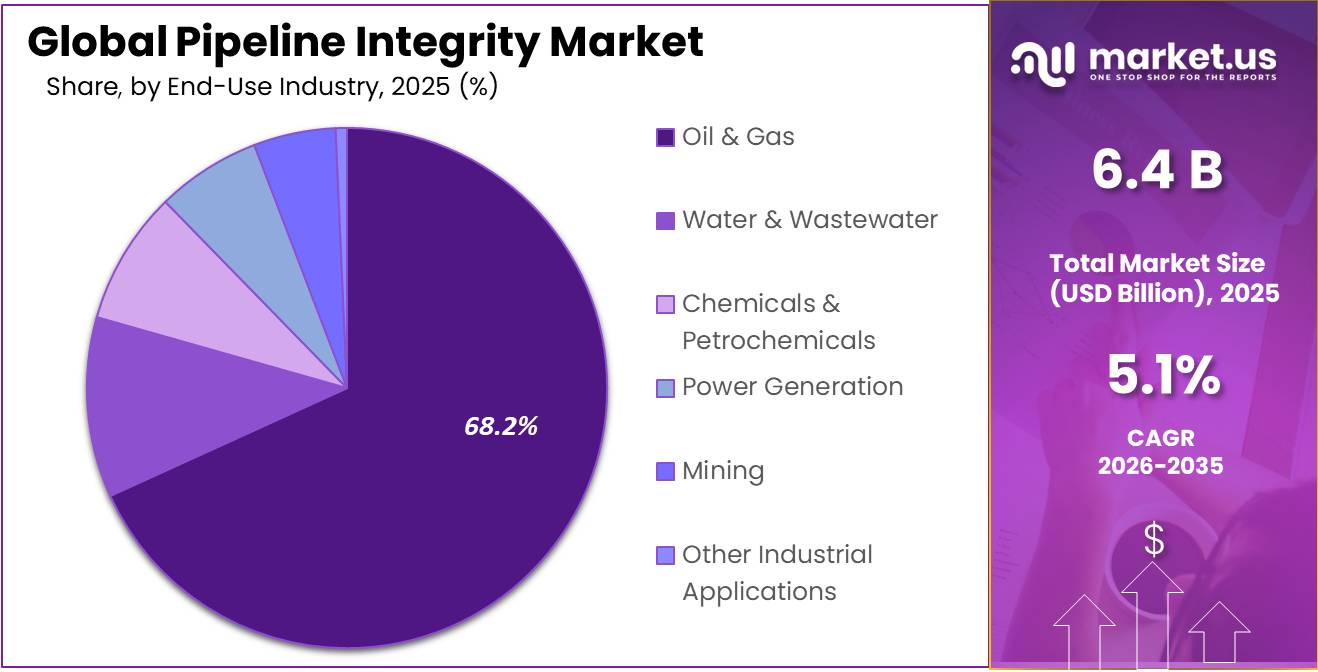
- Oil & Gas held a dominant market position, capturing more than a 68.00% share.
- North America held a dominant position in the Pipeline Integrity Market in 2025, accounting for 37.00% of the market, valued at USD 2.3 billion.
By Service Type Analysis
Inspection Services lead the market through early defect detection and improved pipeline safety.
In 2025, “Inspection Services” held a dominant market position, capturing more than a 39.50% share. These services play an important role in identifying corrosion, cracks, metal loss, and other defects before they affect pipeline operations. Pipeline operators rely on in-line inspection tools, ultrasonic testing, magnetic flux leakage technology, and pressure assessments to evaluate pipeline conditions and plan maintenance. In 2025, demand was supported by the need to maintain ageing infrastructure, reduce unplanned shutdowns, and meet pipeline safety requirements.
The U.S. Department of Transportation’s Pipeline and Hazardous Materials Safety Administration provides inspection and integrity management guidance for regulated pipeline operators, supporting the continued importance of systematic inspections and risk-based maintenance. The 39.50% share represents the supplied market estimate, not a figure published by a government agency.
Cleaning Services play an important role in pipeline integrity by removing wax, scale, sediment, debris, and other unwanted deposits that can restrict product flow and affect inspection accuracy. Pipeline operators use cleaning pigs, mechanical tools, and chemical cleaning methods, depending on pipeline conditions and the material being transported. In 2025, demand for these services was supported by the need to maintain operational efficiency, prepare pipelines for in-line inspections, and reduce maintenance-related disruptions.
The U.S. Pipeline and Hazardous Materials Safety Administration reported that approximately 3.3 million miles of pipelines were under its oversight as of February 2026, illustrating the extensive infrastructure requiring effective operation and maintenance. Although this figure covers the overall pipeline network rather than cleaning services specifically, it highlights the scale of infrastructure where cleaning and maintenance can be important.
By Pipeline Product / Medium Analysis
Natural Gas leads the segment due to its extensive transportation networks and the need for reliable pipeline safety.
In 2025, “Natural Gas” held a dominant market position, capturing more than a 46.30% share. Natural gas pipelines require regular integrity assessments to identify corrosion, cracks, material defects, and gas leaks that may affect safe operations. Pipeline operators use in-line inspection tools, pressure monitoring, leak detection systems, and preventive maintenance to reduce failure risks and maintain reliable gas delivery.
Demand for pipeline integrity services is supported by the continued use of natural gas for electricity generation, industrial heating, and residential energy supply. The U.S. Department of Transportation’s Pipeline and Hazardous Materials Safety Administration provides regulatory oversight and integrity management guidance for gas pipeline operators. The 46.30% share is the supplied market estimate, not an official government statistic.
Crude Oil pipelines require regular inspection and maintenance to identify corrosion, cracks, leaks, and other defects that could interrupt transportation or cause environmental damage. In 2025, pipeline operators continued to depend on integrity assessments, corrosion control, leak detection, and preventive maintenance to protect crude oil transportation networks. According to the U.S. Pipeline and Hazardous Materials Safety Administration, the United States reported 82,203 miles of crude oil pipelines in 2025.
This extensive network highlights the importance of monitoring pipeline conditions and addressing potential failures before they disrupt operations. The U.S. Energy Information Administration also reported that domestic crude oil deliveries to refineries by pipeline reached 3,470,980 thousand barrels in 2025, demonstrating the importance of pipelines in supplying refinery operations. These government statistics support the operational need for integrity services in the crude oil segment.
By Pipeline Type Analysis
Transmission Pipelines lead due to their role in transporting large volumes of oil and gas over long distances.
In 2025, “Transmission Pipelines” held a dominant market position, capturing more than a 39.00% share. These pipelines carry natural gas and other energy products from production areas and processing facilities to storage terminals, industrial users, and distribution networks. Their long routes, high operating pressures, and exposure to corrosion and ground movement create a continuing need for inspection, monitoring, and preventive maintenance.
Pipeline operators use in-line inspection tools, pressure testing, corrosion control, and leak detection systems to identify defects and reduce the risk of service interruptions. The U.S. Pipeline and Hazardous Materials Safety Administration provides pipeline safety regulations and integrity management requirements that support regular assessment of transmission infrastructure. The 39.00% share is the supplied market estimate, rather than a government-published figure.
In 2025, the U.S. Pipeline and Hazardous Materials Safety Administration reported approximately 2,398,829 miles of gas distribution mains and estimated service lines, including 1,394,662 miles of distribution mains and 1,004,167 miles of service lines. This extensive network highlights the importance of inspection and maintenance in reducing gas leakage risks and protecting public safety. Demand for pipeline integrity services is supported by ageing infrastructure, safety requirements, and the need for dependable gas delivery.
By Solution Component Analysis
Services lead the market as pipeline operators rely on regular inspections, maintenance, and technical support to protect infrastructure.
In 2025, “Services” held a dominant market position, capturing more than a 54.00% share. These services cover pipeline inspection, corrosion assessment, integrity testing, risk evaluation, maintenance planning, and repair support. Pipeline operators depend on specialist service providers to identify potential defects, assess pipeline conditions, and reduce the risk of leaks or unexpected shutdowns. Demand is supported by ageing infrastructure, safety requirements, and the need to maintain reliable transportation of natural gas, crude oil, and refined products.
The U.S. Pipeline and Hazardous Materials Safety Administration establishes integrity management requirements for regulated pipeline operators, reinforcing the need for planned inspections and risk-based maintenance. The 54.00% share is the supplied market estimate, not an official government statistic.
Hardware plays an important role in pipeline integrity by helping operators identify defects, monitor operating conditions, and maintain safe pipeline performance. Key equipment includes inspection pigs, corrosion sensors, pressure gauges, leak detection devices, valves, and monitoring instruments. In 2025, demand for these components was supported by the need to maintain ageing infrastructure and improve the early detection of pipeline damage.
According to the U.S. Government Accountability Office, the United States had almost 350,000 miles of interstate gas and hazardous liquid transmission pipelines. The agency also found that manufacturing defects in fittings, flanges, and valves contributed to less than 2% of 1,529 accidents recorded on interstate transmission pipelines from 2016 to 2020. These findings highlight the importance of component quality, inspection, and maintenance in pipeline safety.
By End-Use Industry Analysis
Oil & Gas leads the market due to the need for safe transportation, regular inspection, and reliable pipeline operations.
In 2025, “Oil & Gas” held a dominant market position, capturing more than a 68.00% share. The industry depends on pipeline integrity services to transport crude oil, natural gas, and refined petroleum products while reducing the risks of leakage, corrosion, and equipment failure. Inspection, pressure monitoring, corrosion control, and preventive maintenance help operators identify defects and avoid costly disruptions.
The need to maintain ageing pipelines, comply with safety regulations, and protect surrounding communities continues to support demand for these services. The U.S. Pipeline and Hazardous Materials Safety Administration provides integrity management requirements for regulated oil and gas pipeline operators. The 68.00% share represents the supplied market estimate and is not an official government statistic.
Water & Wastewater networks require regular inspection and maintenance to identify cracks, corrosion, blockages, and structural damage that can lead to water loss or sewage leakage. Utilities use pipeline condition assessments, leak detection equipment, pressure monitoring, and rehabilitation services to maintain infrastructure and reduce service disruptions. In 2025, the need to replace ageing pipes and improve system reliability continued to support demand for pipeline integrity solutions.
The U.S. Environmental Protection Agency estimated that USD 422.9 billion would be needed for drinking water transmission and distribution infrastructure improvements, including the replacement or rehabilitation of ageing pipelines and related equipment. This investment requirement highlights the importance of infrastructure maintenance and rehabilitation for water utilities.
Key Market Segments
By Service Type
- Inspection Services
- Cleaning Services
- Repair, Rehabilitation & Refurbishment Services
- Digital Monitoring & Analytics
- Geospatial Surveying Services
- Integrity Assessment, Risk Analysis & Consulting
By Pipeline Product / Medium
- Crude Oil
- Natural Gas
- Refined Petroleum Products
- Liquefied Natural Gas (LNG)
- Carbon Dioxide (CO₂)
- Other Fluids
By Pipeline Type
- Transmission Pipelines
- Distribution Pipelines
- Gathering Pipelines
- Feeder Pipelines
- Subsea Pipelines
By Solution Component
- Hardware
- Software
- Services
By End-Use Industry
- Oil & Gas
- Water & Wastewater
- Chemicals & Petrochemicals
- Power Generation
- Mining
- Other Industrial Applications
Driver Analysis
Mandatory integrity assessments
U.S. assessment obligations create a relatively defensible inspection backlog because qualifying operators must assess pipeline condition irrespective of discretionary expansion budgets. Under 49 CFR §192.710, applicable onshore steel transmission segments operating at a maximum allowable operating pressure equivalent to at least 30% of specified minimum yield strength—including Class 3 or Class 4 locations and qualifying piggable moderate-consequence areas—must complete initial assessments by 3 July 2034, subject to the rule’s provisions for subsequently qualifying segments; periodic reassessment generally follows at least every 10 years, with intervals not exceeding 126 months.
This is distinct from covered high-consequence-area transmission segments, for which §192.939 establishes a maximum seven-calendar-year reassessment interval for pipelines operating at or above 30% SMYS. The commercial effect is a recurring sequence of line preparation, in-line inspection, anomaly assessment, excavation verification, and engineering documentation rather than a single compliance purchase. Suppliers can capture more value through multiyear inspection-and-assessment agreements, while operators must balance inspection-tool availability against outage windows and remediation capacity.
Importantly, PHMSA’s January 2025 corrections removed provisions vacated following an August 2024 judicial decision, so the opportunity should not be calculated by assuming every provision of the earlier rule remains enforceable. The modeled +1.0 pp contribution assumes 25% of addressable spending receives a 4% incremental annual uplift; the medium-term classification reflects scheduling and execution lead times, not a newly imposed universal 2026 deadline.
Drivers Impact Analysis
| Driver | (~) % Impact on CAGR | Geographic Relevance | Impact Timeline |
|---|---|---|---|
| Mandatory integrity assessments | +1.0 pp | U.S. transmission core | Medium term (2–4 years) |
| Aging-asset life extension | +0.8 pp | U.S., Canada, Western Europe | Short term (≤ 2 years) |
| Methane detection and repair | +0.8 pp | EU core; EU-linked exporters | Short term (≤ 2 years) |
| Gas-network and LNG expansion | +0.6 pp | India; U.S. Gulf Coast; Qatar | Medium term (2–4 years) |
| Integrated integrity analytics | +0.6 pp | North America, Western Europe; GCC operators | Medium term (2–4 years) |
| Geohazard monitoring | +0.4 pp | U.S., Canada; Andean and South Asian corridors | Long term (≥ 4 years) |
Restraint Analysis
Inspection access costs
Physical access restrictions constrain inspection throughput where pipelines cannot accommodate conventional in-line inspection tools without modification: reduced-port valves, tight bends, changing diameters, unsuitable operating pressure, low flow, and unavailable launch or receive facilities can turn a routine inspection into a bespoke engineering project. PHMSA’s draft gas-transmission guidance explicitly recognizes these constraints and notes that some lines can be made piggable through modest modifications, while others would require pipe replacement; because this document is draft guidance, it supports the technical explanation rather than establishing an additional legal obligation.
An illustrative procurement case shows the commercial friction: assume US$200,000 for inspection and reporting, US$300,000 for access modifications, and US$150,000 for cleaning, isolation, and restart support; the total becomes US$650,000, or 3.25 times the inspection-only price, before lost throughput or excavation contingencies. These are analyst assumptions, not reported market averages. The restraint is therefore not simply “high inspection prices,” but the operator’s total enabling expenditure and the scarcity of acceptable operating windows.
Specialized tethered or remotely controlled tools can address some configurations, but applicable hazardous-liquid inspections still face qualification and execution requirements under 49 CFR §195.591. The modeled −0.6 pp deduction assumes 20% of spending experiences a 3% annual growth shortfall through delayed or reduced inspection activity; it credits no negative effect where higher preparation and engineering fees fully offset lost inspection volume.
Restraint Impact Analysis
| Restraint | (~) % Impact on CAGR | Geographic Relevance | Impact Timeline |
|---|---|---|---|
| Inspection access costs | −0.6 pp | U.S., Canada, Western Europe | Medium term (2–4 years) |
| Budget reprioritization | −0.5 pp | North America; oil-linked exporters | Short term (≤ 2 years) |
| Specialist shortages | −0.4 pp | North America, EU, GCC | Medium term (2–4 years) |
| Compliance deferrals | −0.4 pp | U.S. methane-linked services | Short term (≤ 2 years) |
| Legacy-data friction | −0.3 pp | North America, Europe; legacy APAC | Medium term (2–4 years) |
| OT security barriers | −0.2 pp | U.S. critical systems; EU, GCC | Medium term (2–4 years) |
Opportunity Analysis
Hydrogen qualification
The opportunity is to establish a dedicated conversion-qualification business for existing gas pipelines, rather than simply benefit from hydrogen infrastructure announcements. The IEA’s 2026 infrastructure assessment identifies more than 40,000 km of announced hydrogen pipelines through 2035, but only 9% of that length is operational or supported by committed investment; operational and committed length increased 70% from the previous review, with activity concentrated in Europe and China.
Germany’s commencement of a 400 km gas-pipeline repurposing project in 2025 illustrates the scale at which qualification packages can become relevant. As an original contract-sizing scenario—not a quoted market price—a 500 km corridor assessed at US$8,000/km generates US$4 million of initial engineering revenue, while a separately scoped US$500/km annual reassessment and data-service contract produces US$250,000 annually after commissioning; destructive sampling, major excavations, and construction are excluded.
This is upside rather than a baseline driver because the incremental product is a hydrogen-specific qualification dossier and continuing assurance relationship that an incumbent hydrocarbon inspection supplier does not automatically possess. The modeled +0.5 pp assumes successful access to funded projects, validated technical capability, and customer acceptance; it does not assume that announced hydrogen kilometres will all be built.
Opportunity Impact Analysis
| Opportunity | (~) % Potential CAGR Upside | Geographic Relevance | Execution Window |
|---|---|---|---|
| Hydrogen qualification | +0.5 pp | Germany, Netherlands, China | Medium term (2–4 years) |
| CO₂ assurance services | +0.4 pp | U.S. Gulf Coast, North Sea | Medium term (2–4 years) |
| Water-main diagnostics | +0.4 pp | U.S. municipal networks | Medium term (2–4 years) |
| Small-operator platforms | +0.3 pp | U.S. municipal gas networks | Short term (≤ 2 years) |
| Robotic-service licensing | +0.3 pp | U.S., Canada, Western Europe | Medium term (2–4 years) |
| Savings-linked contracts | +0.2 pp | U.S., EU industrial networks | Short term (≤ 2 years) |
Challenges Analysis
Inspection performance validation
Inspection suppliers must continually demonstrate that detection, classification, and sizing performance remain valid for the actual defect population and operating conditions encountered, rather than treating a successfully completed tool run as proof of engineering reliability. PRCI’s performance-validation guidance explicitly distinguishes probability of detection, probability of identification, probability of misidentification, and sizing accuracy; a 2024 ASME technical paper similarly differentiates inspection-system verification from post-run validation against field evidence.
The quantitative challenge is the amount of evidence needed to support a performance claim: under an illustrative independent binomial model, 29 successful detections in 29 representative trials produce a one-sided 95% lower confidence bound just above 90% detection probability, but that inference weakens if the sample excludes difficult geometries or correlated defects. An assumed depth-sizing tolerance of ±10% of wall thickness on an 8 mm pipe corresponds to ±0.8 mm; compared with a reported 2 mm-deep feature, that tolerance equals 40% of the reported depth, demonstrating why apparently small measurement uncertainty can materially affect engineering decisions.
These figures are analytical examples, not universal tool specifications or prescribed sample sizes. Suppliers therefore need threat-specific qualification libraries, representative field-verification datasets, independent technical review, and explicit uncertainty propagation into remaining-strength calculations. The modeled −0.4 pp friction reflects repeated validation and reanalysis consuming capacity after work is sold—not a lack of demand—and is net of additional billable verification work.
Challenges Impact Analysis
| Challenge | (~) % CAGR Friction Drag | Geographic Relevance | Mitigation Horizon |
|---|---|---|---|
| Inspection performance validation | −0.4 pp | U.S., Canada, EU | Medium term (2–4 years) |
| Assessment-to-repair coordination | −0.4 pp | U.S. transmission; Canada, EU | Medium term (2–4 years) |
| Dynamic geohazard interpretation | −0.3 pp | North America; Andean, Himalayan corridors | Long term (≥ 4 years) |
| Changing service-fluid behavior | −0.3 pp | EU hydrogen; U.S., North Sea CO₂ | Long term (≥ 4 years) |
| Cross-border fleet reliability | −0.2 pp | EU–GCC–APAC service corridors | Medium term (2–4 years) |
| Remote-surveillance evidence integration | −0.2 pp | U.S. transmission; EU operators | Medium term (2–4 years) |
Geopolitical Impact Analysis
Geopolitical Impact of Ongoing Wars on the Pipeline Integrity Market
The ongoing conflicts in the Middle East and Russia-Ukraine are increasing pressure on pipeline operators to protect energy infrastructure, prevent supply disruptions, and strengthen inspection programs. Attacks on oil and gas facilities, pumping stations, and export routes have raised concerns about physical damage, leakage, and interruptions to energy transportation.
These risks are increasing the importance of corrosion monitoring, leak detection, emergency repairs, and regular pipeline inspections. However, higher operating costs, restricted access to affected areas, and supply-chain delays can make maintenance more difficult.
The International Energy Agency reported in April 2026 that disruptions to liquefied natural gas shipments through the Strait of Hormuz removed close to 20% of global liquefied natural gas supply from the market, demonstrating the scale of energy infrastructure risks.
In July 2026, the U.S. Pipeline and Hazardous Materials Safety Administration issued guidance urging gas distribution operators to improve risk assessments, address high-risk infrastructure, and strengthen leak management.
Regional Insights
North America: Dominant Regional Market
North America held a dominant position in the Pipeline Integrity Market in 2025, accounting for 37.00% of the market, valued at USD 2.3 billion, based on the supplied market estimates. The region benefits from an extensive oil and gas pipeline network, established safety regulations, and continued investment in inspection, leak detection, corrosion prevention, and pipeline rehabilitation.
The United States reported approximately 300,217 miles of natural gas transmission pipelines in 2025, according to the Pipeline and Hazardous Materials Safety Administration. Canada also provides a strong infrastructure base, with the Canada Energy Regulator overseeing 73,000 kilometres of interprovincial and international pipelines. These networks create ongoing demand for inspection services, monitoring equipment, integrity assessments, and preventive maintenance.
Asia Pacific is positioned for further growth as countries expand energy transportation infrastructure, develop gas supply networks, and invest in new pipeline corridors. These developments create opportunities for pipeline integrity providers offering inspection, corrosion management, leak detection, and remote monitoring. Government-backed infrastructure investment in the region supports demand for pipeline safety services, particularly where new networks must be maintained alongside existing assets.
The Global Energy Monitor’s 2025 tracker identified around 15,000 kilometres of crude oil and natural gas liquids pipelines under construction worldwide, with Asia accounting for more than 60% of oil pipeline development activity. Although these figures cover oil pipeline development rather than the integrity market itself, they indicate a substantial base of infrastructure that may require inspection and maintenance services.
Key Regions and Countries Insights
- North America
- US
- Canadax
- Europe
- Germany
- France
- The UK
- Spain
- Italy
- Rest of Europe
- Asia Pacific
- China
- Japan
- South Korea
- India
- Australia
- Rest of APAC
- Latin America
- Brazil
- Mexico
- Rest of Latin America
- Middle East & Africa
- GCC
- South Africa
- Rest of MEA
Key Players Analysis
Baker Hughes strengthens the pipeline integrity market through its Process & Pipeline Services and Waygate Technologies businesses, which provide in-line inspection, maintenance, and non-destructive testing solutions. In 2025, the company reported USD 27.7 billion in revenue, employed approximately 56,000 people, and operated in more than 120 countries. It also invested USD 600 million in research and development, supporting technology advancement across its industrial and energy portfolio. These capabilities help pipeline operators identify defects, improve asset reliability, and reduce operational risks.
T.D. Williamson has specialized in pipeline maintenance and integrity solutions since 1920. Its services include in-line inspection, cleaning, pipeline isolation, and defect assessment for onshore and offshore networks. In June 2025, TDW announced a strategic investment from funds managed by Apollo, while SCF Partners retained majority ownership. The company reported more than 500 registered patents, reflecting its focus on pipeline technology and innovation. In December 2025, TDW acquired Pro Pipe Services’ Australian operations to strengthen its regional pipeline maintenance and intervention capabilities.
SGS SA competes in pipeline integrity through inspection, non-destructive examination, welding inspection, corrosion assessment, and material verification services. Its pipeline specialists use ultrasonic testing, radiographic testing, magnetic particle testing, and other inspection methods to help operators identify defects and assess infrastructure condition. In 2025, SGS reported 102,804 full-time-equivalent employees across its global operations. The company acquired PfiNDE Inc. in November 2011, strengthening its specialized pipeline inspection and consulting capabilities. Its technical expertise and international service network support pipeline operators seeking reliable inspection and maintenance solutions.
Top Key Players Outlook
- ROSEN Group
- Baker Hughes Company
- T.D. Williamson, Inc. (TDW)
- SGS SA
- Intertek Group plc
- Applus+
- DNV
- Bureau Veritas S.A.
- NDT Global GmbH
- Quest Integrity Group, LLC
- MISTRAS Group, Inc.
- TÜV Rheinland AG
- Penspen Ltd.
- Entegra LLP
- 3P Services GmbH & Co. KG
Recent Developments
- In June 2026, Bureau Veritas S.A completed an assessment of a 20-inch offshore pipeline operated by Petrogas in the Dutch North Sea, confirming that the existing pipeline could progress toward conversion from hydrocarbon service to carbon dioxide transportation under the Abeona carbon capture and storage project. The assessment followed more than 1.5 years of technical study and review, with further validation and operational approvals still required.
- In September 2026, NDT Global introduced QUADRA, an in-line inspection system that combines multiple inspection datasets in a single run to help operators assess corrosion, cracks, and other pipeline defects more effectively. NDT Global employs approximately 880 people, and its technologies support pipeline operators in improving asset safety, planning maintenance, and reducing the risk of unexpected failures.
Report Scope
| Report Features | Description |
|---|---|
| Market Value (2025) | USD 6.4 Bn |
| Forecast Revenue (2035) | USD 10.6 Bn |
| CAGR (2026-2035) | 5.1% |
| Base Year for Estimation | 2025 |
| Historic Period | 2020-2024 |
| Forecast Period | 2026-2035 |
| Report Coverage | Revenue Forecast, Market Dynamics, Competitive Landscape, Recent Developments |
| Segments Covered | By Service Type (Inspection Services, Cleaning Services, Repair, Rehabilitation & Refurbishment Services, Digital Monitoring & Analytics, Geospatial Surveying Services, Integrity Assessment, Risk Analysis & Consulting), By Pipeline Product / Medium (Crude Oil, Natural Gas, Refined Petroleum Products, Liquefied Natural Gas (LNG), Carbon Dioxide (CO₂), Other Fluids), By Pipeline Type (Transmission Pipelines, Distribution Pipelines, Gathering Pipelines, Feeder Pipelines, Subsea Pipelines), By Solution Component (Hardware, Software, Services), By End-Use Industry (Oil & Gas, Water & Wastewater, Chemicals & Petrochemicals, Power Generation, Mining, Other Industrial Applications) |
| Regional Analysis | North America – US, Canada; Europe – Germany, France, The UK, Spain, Italy, Rest of Europe; Asia Pacific – China, Japan, South Korea, India, Australia, Singapore, Rest of APAC; Latin America – Brazil, Mexico, Rest of Latin America; Middle East & Africa – GCC, South Africa, Rest of MEA |
| Competitive Landscape | ROSEN Group, Baker Hughes Company, T.D. Williamson, Inc. (TDW), SGS SA, Intertek Group plc, Applus+, DNV, Bureau Veritas S.A., NDT Global GmbH, Quest Integrity Group, LLC, MISTRAS Group, Inc., TÜV Rheinland AG, Penspen Ltd., Entegra LLP, 3P Services GmbH & Co. KG |
| Customization Scope | Customization for segments, region/country-level will be provided. Moreover, additional customization can be done based on the requirements. |
| Purchase Options | We have three licenses to opt for: Single User License, Multi-User License (Up to 5 Users), Corporate Use License (Unlimited User and Printable PDF) |








