


Report Overview
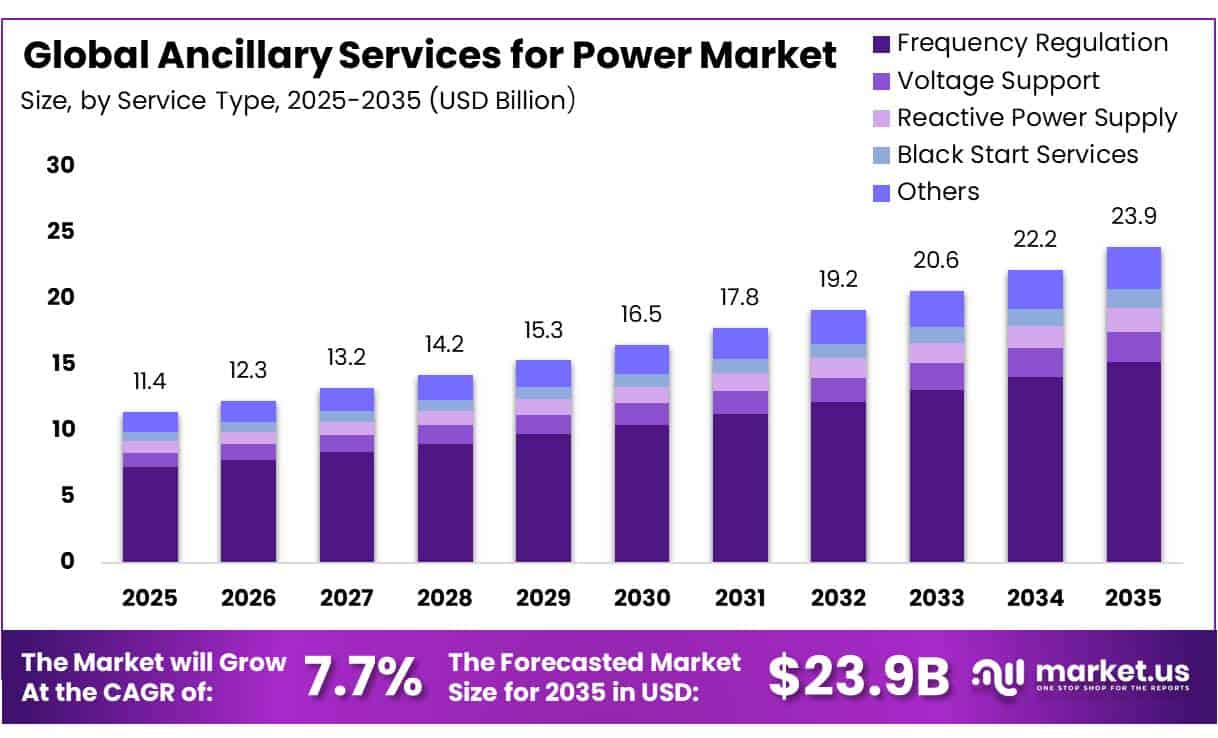
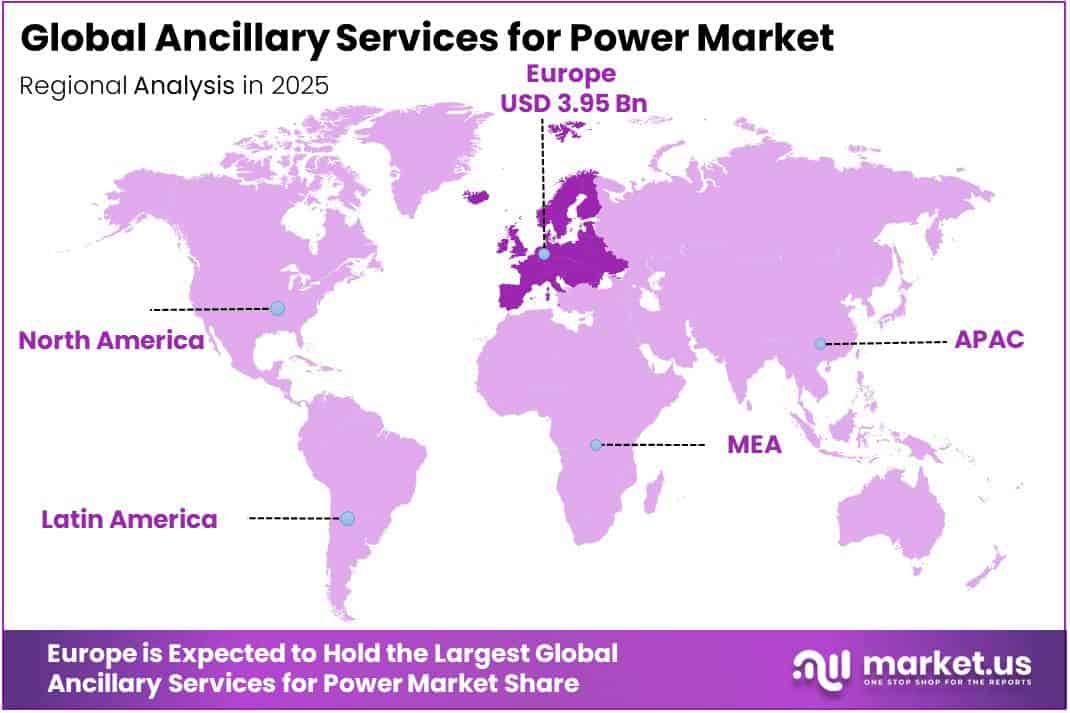
In 2025, the Global Ancillary Services for Power Market was valued at USD 11.4 billion, and between 2026 and 2035, this market is estimated to register a CAGR of 7.7%, reaching about USD 23.9 billion by 2035. Europe held a dominant market position, capturing more than a 34.67% share, holding USD 3.95 billion in revenue.
The ancillary services for power industry supports reliable electricity delivery by balancing supply and demand, maintaining voltage, supplying reactive power, and restoring networks after outages. The Federal Energy Regulatory Commission identifies five main service categories and states that frequency regulation maintains the United States grid at 60 cycles per second, while certain spinning and non-spinning reserves can respond within 10 minutes. These functions create recurring procurement needs for utilities, generators, storage operators, and flexible electricity consumers.
- The International Energy Agency reported that global electricity demand increased 3% in 2025 and forecasts average annual growth of 3.6% during 2026 to 2030. Solar photovoltaic and wind generation are expected to increase their combined share of global electricity output from 17% to 27% by 2030, increasing requirements for frequency control, voltage management, operating reserves, and rapid balancing resources.
Key Takeaways
- The global ancillary services for power market was valued at USD 11.4 billion in 2025.
- The global market is projected to grow at a CAGR of 7.7% and is estimated to reach USD 23.9 billion by 2035.
- On the basis of service type, frequency regulation dominated the market, constituting 63.45% of the total market share.
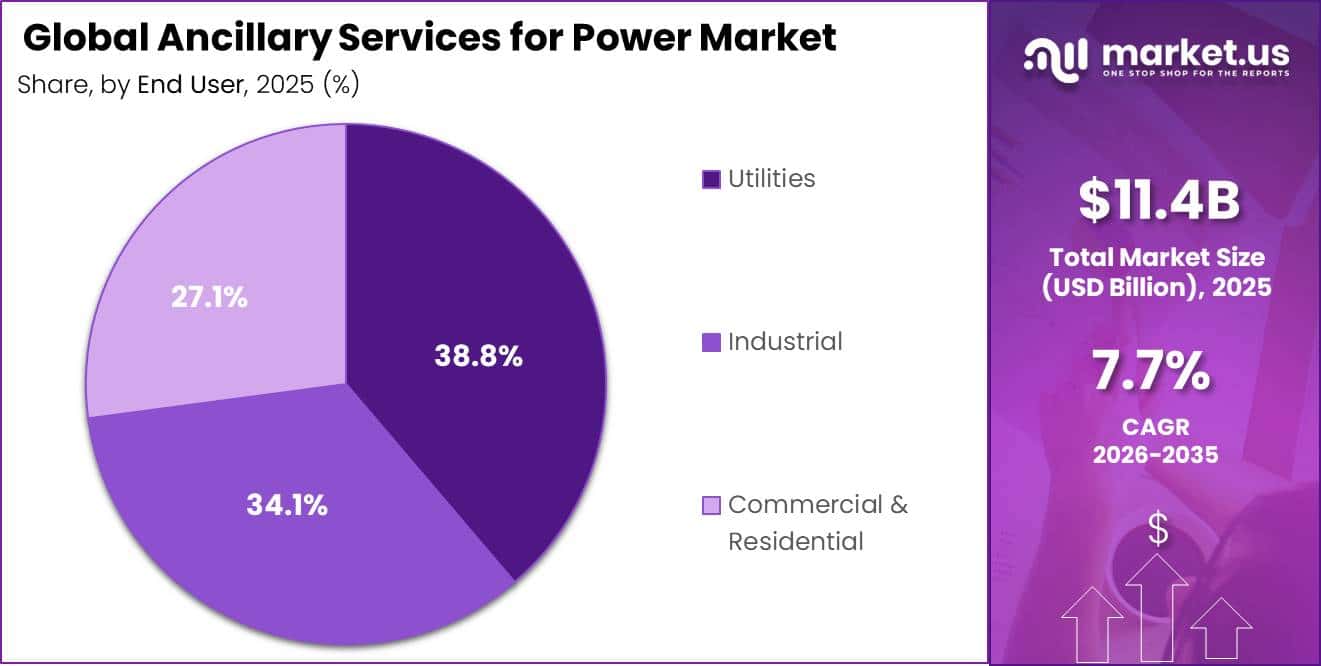
- Based on the end user, utilities dominated the ancillary services for power market, with a substantial market share of around 38.78%.
- In 2025, the Europe was the most dominant region in the Ancillary Services for Power Market, accounting for 34.67% of the total global consumption.
Growth is driven by renewable integration, electrification, data centres, storage deployment, and delayed network connections. More than 2,500 gigawatts of generation, storage, and large-load projects remain in connection queues worldwide.
- The International Energy Agency estimates that grid-enhancing technologies and regulatory reforms could unlock 1,200 to 1,600 gigawatts of advanced projects. This creates opportunities for batteries, demand response, synchronous condensers, grid-forming inverters, flexible generation, and software platforms capable of delivering faster, accurately measured ancillary services.
Government support is accelerating commercial deployment. The United States Department of Energy operates a USD 5 billion grid-resilience grant program, including USD 2.5 billion for industry matching grants and USD 2.3 billion for states and tribes. Its separate Grid Innovation Program provides USD 5 billion for transmission, storage, and distribution demonstrations. In June 2025, the department also allocated up to USD 5 million each to 3 grid-scale storage projects supporting critical facilities during outages and emergencies.
Service Type Analysis
Frequency Regulation leads with 63.45% as grid balancing remains essential, while Others gains momentum from emerging flexibility needs.
In 2025, Frequency Regulation held a dominant market position, capturing more than a 63.45% share. Its leadership was supported by the need to keep electricity supply and demand aligned as renewable output changes. Utilities use regulation services to correct short-term deviations, maintain stable system frequency, and reduce operational imbalance across interconnected power networks.
- In January 2025, according to the Electric Reliability Council of Texas, the minimum capacity required from resources providing Responsive Reserve Service through Primary Frequency Response was set at 1,365 megawatts, with the updated requirement becoming effective on January 1, 2025. This figure shows the scale of fast-response capacity needed to protect grid stability during sudden system disturbances.
Others is the fastest growing segment. Growth is supported by demand for flexible balancing products, advanced reserve mechanisms, congestion management, and new grid-support services. As electricity systems adopt more storage, distributed energy resources, and digital controls, buyers are seeking specialised services that respond quickly to local reliability challenges and changing operating conditions.
End User Analysis
Utilities lead with 38.78% as grid operators remain the main buyers, while Industrial records the fastest growth.
In 2025, Utilities held a dominant market position, capturing more than a 38.78% share. Their leadership was supported by responsibility for balancing electricity supply, maintaining reliability, restoring power after disruptions, and procuring reserve capacity. Utilities coordinate generation, storage, and demand-side resources to manage frequency and voltage across interconnected systems.
- In January 2025, according to the United States Department of Energy, a USD 289.7 million loan guarantee was closed to finance up to 1,000 solar photovoltaic and battery energy storage systems across up to 27 states. The systems are planned mainly for commercial and industrial facilities and will be aggregated to support grid stability and participation in wholesale electricity markets.
Industrial is the fastest growing segment. Expansion is supported by factories, refineries, and data centres adopting generation, battery storage, flexible loads, and automated controls. These facilities can adjust consumption or dispatch stored power when required, creating opportunities to provide demand response, operating reserves, frequency support, and other ancillary services while improving energy resilience.
Key Market Segments
Service Type
- Frequency Regulation
- Voltage Support
- Reactive Power Supply
- Black Start Services
- Others
End User
- Utilities
- Industrial
- Commercial & Residential
Driver Analysis
Renewable Integration Surge The Primary Structural Demand Engine
The accelerating build-out of variable renewable energy (VRE) is the single most consequential demand-side driver for ancillary services globally, and its effect on market volumes is both immediate and compounding. As of early 2026, global renewable capacity additions have maintained their trajectory from 2024–2025, with solar PV and wind collectively surpassing coal in power generation in several major grids.
Spain’s renewables curtailment reached 7.2% across May–July 2025, while Germany curtailed 9.6 TWh in 2025, representing 4% of total renewable output both figures pointing to a grid architecture increasingly strained beyond its balancing headroom. These curtailment events are commercially significant because they simultaneously signal under-investment in ancillary procurement capacity and represent the lost economic justification for renewable projects creating regulatory urgency for TSOs to procure more balancing services.
For ancillary service providers, this translates into higher frequency of dispatch, wider price spreads in balancing markets, and a structural increase in reserve volumes tendered all direct revenue multipliers. The IEA’s Renewables 2025 analysis confirms that persistent curtailment highlights gaps in flexibility and infrastructure that require comprehensive solutions involving transmission, frequency response, and voltage support, directly expanding the total addressable market for ancillary service products across short-response and slower-acting categories.
Drivers Impact Analysis
| Driver | (~) % Impact on CAGR | Geographic Relevance | Impact Timeline |
|---|---|---|---|
| Renewable Integration Surge: Grid volatility from accelerating solar/wind capacity additions demanding real-time balancing services | +2.2% | Global core; APAC (China, India), EU, North America | Short term (≤ 2 years) |
| BESS Technology Cost Deflation: Declining lithium-ion & LFP battery BoM enabling economically viable sub-4-hour ancillary dispatch | +1.8% | North America, EU, APAC corridors (China, South Korea, Australia) | Short–Medium term (1–3 years) |
| Regulatory Liberalization & DER Aggregation: FERC Order 2222 (US), EU Electricity Market Reform, and CERC AS Regulations 2022 opening wholesale ancillary markets to aggregated DERs | +1.5% | North America core, EU, India spill-over | Medium term (2–4 years) |
| AI/ML-Driven Grid Optimization: Deployment of predictive dispatch, reinforcement learning, and real-time balancing algorithms replacing manual redispatch | +1.2% | North America, EU, APAC (Japan, Australia, South Korea) | Medium term (2–4 years) |
| Vehicle-to-Grid (V2G) Proliferation: EV fleet aggregation as distributed ancillary reserve providers — spinning reserves, frequency response, demand-side flexibility | +0.9% | EU (Netherlands, UK, Germany), North America, China pilot corridors | Long term (≥ 4 years) |
| Virtual Power Plant (VPP) Monetization: Commercial VPP platforms aggregating prosumers, industrial demand response, and storage into TSO-grade ancillary bids | +1.0% | North America, EU, APAC (Japan, Australia); South America spill-over | Medium–Long term (3–5 years) |
Restraint Analysis
Transformer and Grid-Equipment Supply Shortage
The ancillary services value chain is structurally bottlenecked upstream by a multi-year deficit in power and distribution transformers that has pushed lead times for large power transformers to roughly 128-144 weeks and, in extreme cases, above 200 weeks by 2026, versus a pre-pandemic norm of 30-60 weeks, while unit prices have risen an estimated 60-95% since 2020 on the back of a modeled 30% national shortfall in power transformers and a 6-10% deficit in distribution units; because every new battery storage or synthetic-inertia asset seeking to monetize frequency regulation, black-start, or voltage-support contracts requires interconnection transformers and switchgear before it can even begin bidding into ancillary markets.
This equipment scarcity directly caps the rate at which new fast-response capacity can be commercialized, effectively rationing supply-side growth in the very market segment expanding fastest; the resulting commercial friction manifests as delayed CapEx deployment, developers locking in equipment orders 2-3 years ahead of expected commercial operation dates, and a margin squeeze for EPC contractors forced to absorb or pass through 60-80% cost inflation on core grid hardware, collectively suppressing near-to-medium-term ancillary capacity additions even as underlying demand for those services accelerates.
Restraint Impact Analysis
| Restraint | (~) % Impact on CAGR | Geographic Relevance | Impact Timeline |
|---|---|---|---|
| Transformer and grid-equipment supply shortage | -2.2% | North America core, EU, APAC (China export exposure) | Medium term (2-4 years) |
| Interconnection queue backlogs delaying asset commissioning | -2.0% | North America core (PJM, MISO, SPP), EU spill-over | Medium term (2-4 years) |
| Tariff and commodity cost volatility on copper, steel, aluminum | -1.4% | North America core, Brazil, India, China trade corridors | Short term (≤2 years) |
| NERC CIP / OT cybersecurity compliance burden for DER integration | -1.1% | North America core, EU (NIS2 spill-over) | Long term (≥4 years) |
| Market design fragmentation and slow regulatory harmonization | -1.0% | EU core, APAC corridors (India, Southeast Asia) | Long term (≥4 years) |
| Skilled-labor and grid-engineering capacity shortfall | -0.7% | North America core, EU | Medium term (2-4 years) |
Opportunity Analysis
Grid-Forming Inertia Contracts
Dedicated procurement of synthetic inertia and system-strength products is a distinct white space because conventional ancillary-services forecasts largely center on regulation reserve, spinning reserve, and balancing products rather than separately priced inverter-led stability capacity; Germany’s four TSOs began a two-year fixed-price procurement program for Momentanreserve on 22 January 2026, with basic contracts requiring 30% availability, premium products requiring 90% availability, and published remuneration ranging from €76 to €888.5 per MW-second annually depending on availability tier.
This creates an investable upgrade pathway for battery owners: adding grid-forming controls, validation models, protection-system modifications, and certification can convert a battery from an energy-arbitrage asset into a multi-product grid-stability platform eligible for inertia, fast frequency response, black-start, and voltage-support revenues; an analyst-modeled 8-15% inverter-and-controls CapEx premium can be recovered within roughly 12-24 months where premium stability contracts are won.
The opportunity is not a current driver because only a small group of leading TSOs has established explicit compensation and qualification rules; firms that standardize grid-forming design now, secure long-duration prequalification, and bundle performance guarantees can capture a +2.1 percentage-point CAGR upside before Germany-style procurement spreads into the UK, Australia, California, and broader EU markets.
Opportunity Impact Analysis
| Opportunity | (~) % Potential CAGR Upside | Geographic Relevance | Execution Window |
|---|---|---|---|
| Grid-forming inertia contracts | +2.1% | EU, UK, Australia, North America | Short term (≤ 2 years) |
| VPP roll-ups for C&I flexibility | +1.8% | North America, EU, Japan, South Korea | Medium term (2-4 years) |
| EV fleet bidirectional reserves | +1.5% | North America, EU, China, Japan | Medium term (2-4 years) |
| Local congestion-service platforms | +1.3% | EU, UK, California, Australia | Medium term (2-4 years) |
| Data-center reliability-as-a-service | +1.1% | North America, EU, India, Southeast Asia | Short term (≤ 2 years) |
| Cross-border software and M&A platforms | +0.9% | EU, North America, APAC emerging markets | Long term (≥ 4 years) |
Challenges Analysis
Asset Telemetry Data Quality
NERC’s inverter-based-resource registration initiative is expanding visibility over formerly unregistered assets, including a threshold under which owners and operators of IBR facilities at or above 20 MVA and connected at 60 kV or more must register; this improves governance but simultaneously increases the data-normalization burden across owners, transmission planners, balancing authorities, and market operators.
A portfolio operating at 95% technical availability can still underperform commercially if 2-5% of capacity has delayed telemetry or fails dispatch acknowledgment during high-value reserve intervals, because the aggregator must retain an additional 5-10% capacity buffer to avoid non-performance charges and reduce bid volume accordingly; at scale, that buffer erodes gross margin more materially than the physical outage itself.
Companies need vendor-neutral data architecture, common asset models, edge-control fallback modes, clock synchronization, automated anomaly detection, and auditable data lineage, with the unresolved interoperability burden modeled to subtract roughly -1.2 percentage points from attainable CAGR through 2028.
Challenges Impact Analysis
| Challenge | (~) % CAGR Friction Drag | Geographic Relevance | Mitigation Horizon |
|---|---|---|---|
| Grid-forming model validation | -1.4% | North America core, EU, Australia | Long term (≥ 4 years) |
| Asset telemetry data quality | -1.2% | North America, EU, APAC corridors | Medium term (2-4 years) |
| Battery revenue-stack degradation | -1.0% | North America, EU, China, Australia | Medium term (2-4 years) |
| Power-engineering talent deficit | -0.9% | North America core, EU regulatory hubs | Long term (≥ 4 years) |
| DER cyberattack surface | -0.8% | North America, EU, Japan, South Korea | Long term (≥ 4 years) |
| Volatile reserve-price cannibalization | -0.7% | Mature OECD markets, China | Medium term (2-4 years) |
Geopolitical Impact Analysis
Geopolitical Grid Realignment and Conflict-Driven Resilience Reshaping Ancillary Services Procurement
Geopolitical realignment is changing how governments and grid operators procure ancillary services, including frequency control, operating reserves, voltage support, and black-start capability. On 9 February 2025, Estonia, Latvia, and Lithuania synchronized with Continental Europe at 14:05 Eastern European Time and permanently disconnected links with Russia and Belarus. The transition moved Baltic frequency management into a synchronous area serving over 400 million customers.
- The European Union supported this synchronization with over EUR 1.2 billion under the Connecting Europe Facility. The investment strengthened interconnectors, control systems, and grid infrastructure needed for independent balancing. It widened opportunities for reserve sharing, automated frequency response, reactive-power management, and storage-based services across Baltic and Continental European systems.
Armed conflict is increasing the value of emergency restoration services. In February 2026, the World Bank reported that damaged or destroyed Ukrainian energy assets had risen by approximately 21% since RDNA4, covering generation, transmission, distribution, and district heating. Repeated infrastructure attacks increase requirements for islanding, reserve capacity, voltage recovery, and black-start resources.
Supply-chain security is influencing ancillary-service investment. The International Energy Agency reported in November 2025 that one country dominated refining for 19 of 20 strategic energy minerals, with an average share near 70%, while more than half were subject to export controls. This concentration may delay batteries, inverters, transformers, and control equipment, encouraging localized sourcing and diversified flexibility portfolios.
Regional Analysis
Europe leads with 34.67% and USD 3.95 billion, while Asia-Pacific records the fastest growth.
Europe held the dominant position in the ancillary services for power market, accounting for 34.67% and USD 3.95 billion. The region benefits from interconnected electricity networks, expanding renewable generation, and strong procurement of frequency regulation, voltage support, and reserve capacity.
- In 2025, renewable sources produced 47.3% of European Union electricity, increasing the need for flexible balancing resources. In the first quarter of 2026, renewables supplied 45.5% of electricity generation, reinforcing demand for fast-response grid services.
Asia-Pacific is the fastest-growing region. Rising power consumption, industrial electrification, renewable additions, and cross-border grid development are increasing the need for ancillary services. In 2026, Southeast Asian investment in renewables, grids, and end-use sectors is expected to reach USD 57 billion, including USD 15 billion for grids. Electricity demand in Southeast Asia is rising 1.5 times faster than the global average, supporting storage, demand response, and balancing-service deployment across complex power systems and regional markets.
Key Regions and Countries Covered
- North America
- The US
- Canada
- Europe
- Germany
- France
- The UK
- Spain
- Italy
- Russia & CIS
- Rest of Europe
- APAC
- China
- Japan
- South Korea
- India
- ASEAN
- Rest of APAC
- Latin America
- Brazil
- Mexico
- Rest of Latin America
- Middle East & Africa
- GCC
- South Africa
- Rest of MEA
Key Players Analysis
Ancillary services providers compete through grid technology, operational reliability, digital control, and the ability to combine generation, storage, and flexible demand. Siemens AG, ABB Ltd., and Schneider Electric SE strengthen their positions through frequency support, microgrids, grid automation, and battery integration. In May 2026, Siemens commissioned a 1.25-megawatt microgrid with 3.9 megawatt-hours of storage, while ABB announced a USD 200 million European investment to expand medium-voltage manufacturing and grid technologies. Schneider Electric’s 2026 utility digital twin was validated across more than 50,000 installations, supporting faster distributed energy resource connections and improved protection coordination.
Utilities and integrated energy companies compete through asset scale, customer access, and participation in balancing markets. Enel SpA, Duke Energy Corporation, and NextEra Energy increasingly use battery storage, demand response, and grid modernization to strengthen service capability. Enel’s 2026 to 2028 plan allocated over EUR 26 billion to grids, while Duke Energy commissioned a 50-megawatt, four-hour battery system in January 2026. Competitive advantage increasingly depends on automated dispatch, forecasting accuracy, regulatory compliance, diversified resources, and long-term relationships with grid operators.
Market Key Players
- Siemens AG
- ABB LTD
- Schneider Electric SE
- EnelSpA
- Duke Energy Corporation
- Dominion Energy
- Next Era Energy
- EDFEnergy
- BP PLC
- Total SE
- Other Key Players
Key Development
- In April 2026, EDF Energy and BW ESS partnered to optimise the first phase of the Hams Hall battery project. The facility will provide 350 MW of power and 1,243 MWh of storage under a 10-year agreement.
- In April 2026, TotalEnergies completed the acquisition of a 50% interest in EPH’s Western European flexible-power platform. The resulting company operates 14 GW of gas, biomass, and battery storage capacity across five European countries.
- In May 2026, NextEra Energy and Dominion Energy announced plans to combine their operations. The proposed company would serve approximately 10 million customer accounts and provide USD 2.25 billion in customer bill credits after completion.
Report Scope
| Report Features | Description |
|---|---|
| Market Value (2025) | USD 11.4 Bn |
| Forecast Revenue (2035) | USD 23.9 Bn |
| CAGR (2026-2035) | 7.7% |
| Base Year for Estimation | 2025 |
| Historic Period | 2020-2024 |
| Forecast Period | 2026-2035 |
| Report Coverage | Revenue Forecast, Market Dynamics, Competitive Landscape, Recent Developments |
| Segments Covered | By Service Type (Frequency Regulation, Voltage Support, Reactive Power Supply, Black Start Services, and Others), By End User (Utilities, Industrial, and Commercial & Residential) |
| Regional Analysis | North America – The US & Canada; Europe – Germany, France, The UK, Spain, Italy, Russia & CIS, Rest of Europe; APAC– China, Japan, South Korea, India, ASEAN & Rest of APAC; Latin America– Brazil, Mexico & Rest of Latin America; Middle East & Africa– GCC, South Africa, & Rest of MEA |
| Competitive Landscape | Siemens AG, ABB LTD, Schneider Electric SE, EnelSpA, Duke Energy Corporation, Dominion Energy, Next Era Energy, EDFEnergy, BP PLC, Total SE, and Other Key Players. |
| Customization Scope | Customization for segments, region/country-level will be provided. Moreover, additional customization can be done based on the requirements. |
| Purchase Options | We have three licenses to opt for: Single User License, Multi-User License (Up to 5 Users), Corporate Use License (Unlimited Users and Printable PDF) |





































