


Report Overview
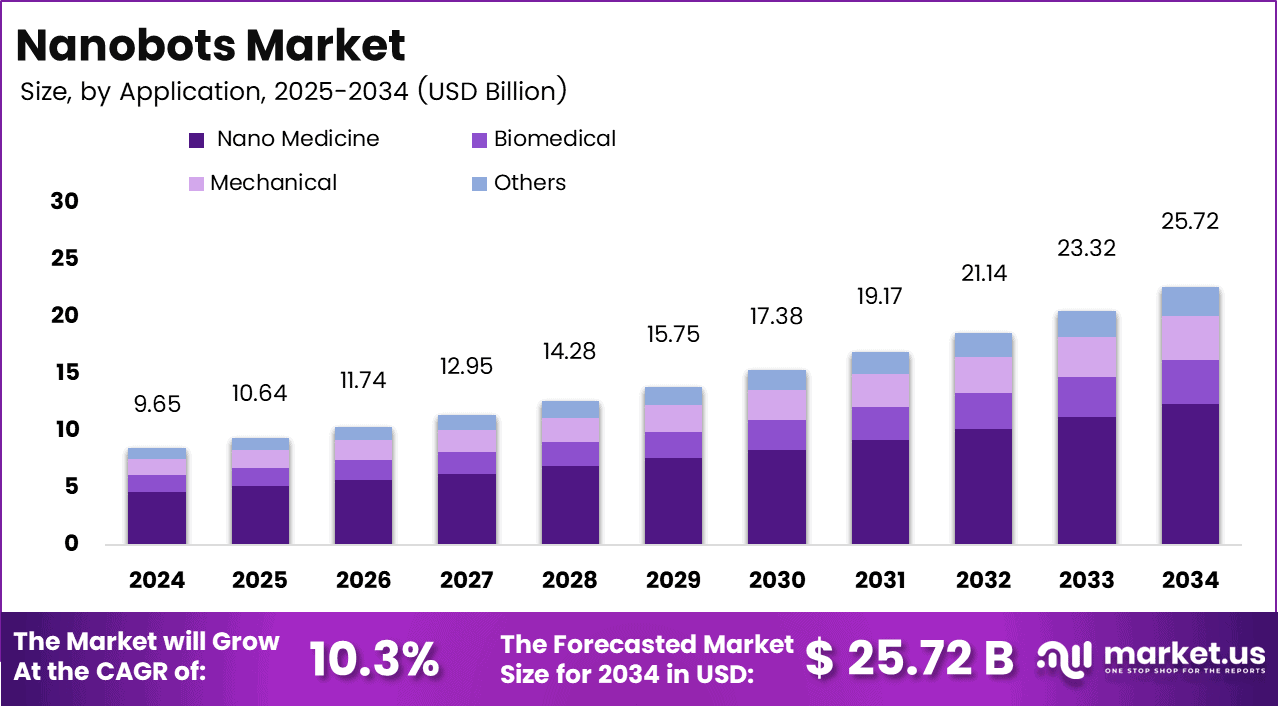
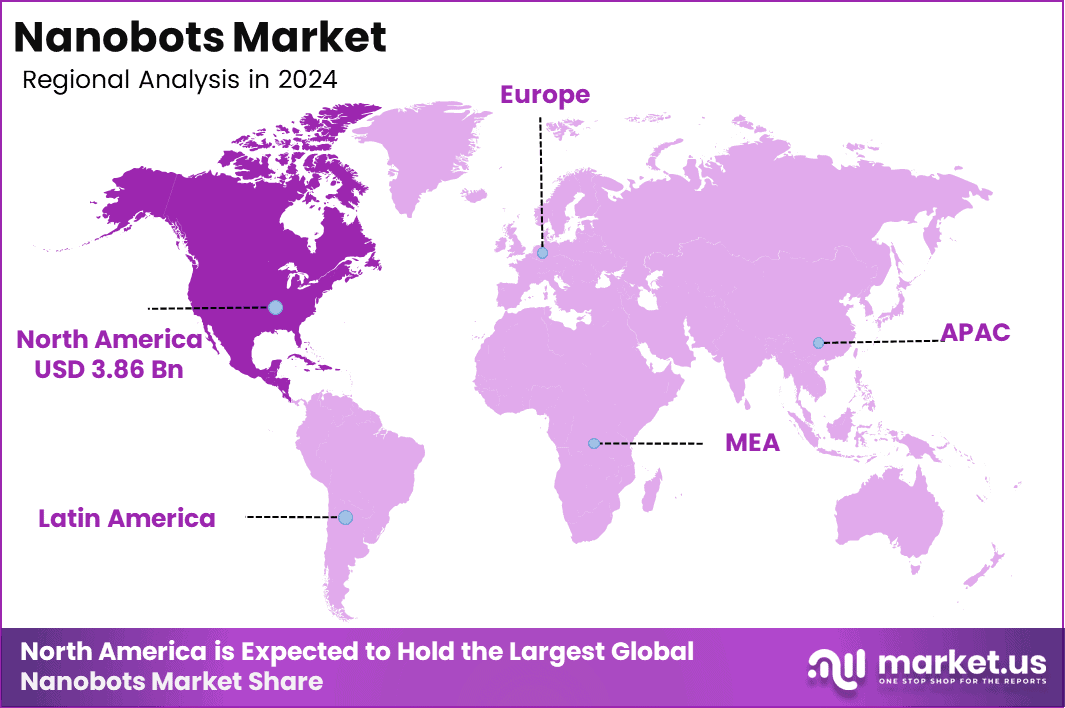
The Global Nanobots Market stands at USD 9.6 billion in 2024 and will reach USD 25.7 billion by 2034, growing at a CAGR of 10.3% from 2025 to 2034. North America holds 40% of the market and earns USD 3.8 billion in revenue.
Health systems keep spending more, and that spending pulls nanoscale devices into clinics and labs. The OECD reported that member countries put about 9.3% of their GDP into health in 2024, above pre-pandemic levels. Research budgets follow the same path.
China’s National Bureau of Statistics reported R&D spending of 3,926.2 billion yuan in 2025, up 8.1% year on year and equal to 2.80% of GDP. Drug makers and hospitals use that money to test targeted drug carriers, cell repair tools, and imaging platforms. Every new program needs nanomanipulators, atomic force systems, and electron beam tools, so instrument demand rises with each research cycle.
Public funding explains most of that lead. The United States Congress set the National Institutes of Health base budget at $47.2 billion for fiscal 2026, a $415 million rise over fiscal 2025, and roughly 80% of that money flows to universities and research institutes as grants and contracts. Those grants buy the exact tools nanobot developers need.
Key Takeaways
- The Global Nanobots Market holds a value of USD 9.6 billion in 2025. The market will reach USD 25.7 billion by 2035. The market will grow at a CAGR of 10.3% during the forecast period.
- Microbivore Nano Robots leads the type segment with a 38.2% share.
- Nano Medicine leads the application segment with a 48.1% share.
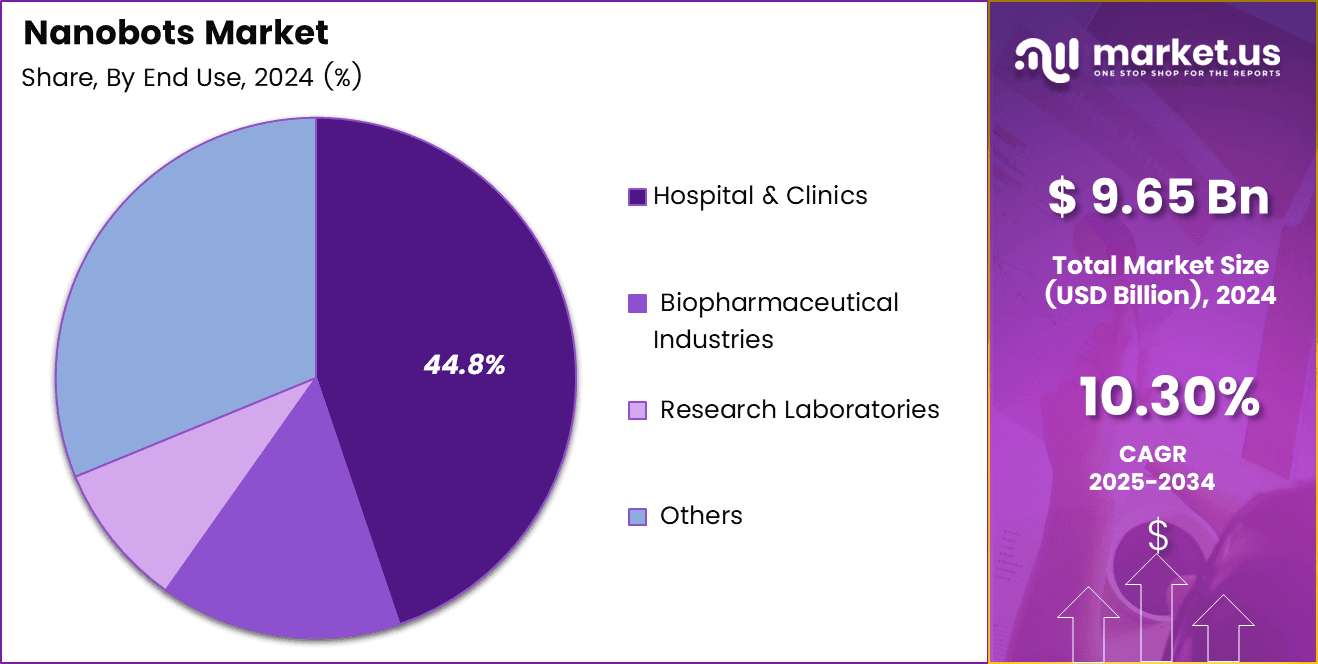
- Hospitals and Clinics lead the end-use segment with a 44.8% share.
- North America leads the market with a 40% share and USD 3.8 billion in revenue.
Role of Generative AI
Generative AI is transforming the spend analytics and procurement landscape by enhancing automation, accuracy, and decision-making across all stages of the process. It begins with data cleansing and categorization, where AI automates the classification of invoices, purchase orders, and supplier records to improve data consistency and reliability.
Predictive analytics enables organizations to forecast spend trends and assess what-if scenarios for strategic sourcing. Further, GenAI automates procurement processes such as RFI/RFP generation, contract summaries, and supplier communication. As a decision-support tool, it acts as a digital copilot for procurement leaders, providing real-time recommendations for supplier consolidation and cost optimization.
By Type
Microbivore Nano Robots dominate with 38.2% due to drug-resistant infection clearance in the bloodstream.
Microbivore nano robots lead because they address antibiotic-resistant infections, a major global health challenge. WHO linked bacterial antimicrobial resistance to more than 4.7 million deaths in 2021, while about 1 in 6 laboratory-confirmed bacterial infections showed antibiotic resistance in 2023. Their ability to directly capture and destroy bacteria makes them attractive for hospital and bloodstream infection research.
Cellular repair nanorobots are growing fastest as aging populations increase demand for less invasive treatment. UN DESA estimates 703 million people are aged 65 or older today, rising to 1.5 billion by 2050. This supports research into nanorobots that repair tissue, remove plaque, and address damage at the cellular level while reducing the need for open surgery.
By Application
Nano Medicine dominates with 48.1% due to targeted drug delivery and public funding.
Nano medicine leads the application segment because public funding strongly supports drug delivery, imaging, and targeted therapeutic technologies. The US National Nanotechnology Initiative requested US$1.45 billion for 2026 across 10 federal agencies, while health agencies led by the NIH have historically directed more than US$900 million annually toward nanotechnology research.
Biomedical applications are growing quickly as more advanced products move through regulatory approval. The FDA approved 46 novel medicines in 2025, following 50 in 2024, strengthening confidence in nano-scale delivery and diagnostic technologies. This is supporting wider adoption of nanomanipulation and measurement systems across diagnostics, biosensors, tissue engineering, and monitoring applications.
By End Use
Hospitals and Clinics dominate with 44.8% due to bedside monitoring and procedure infrastructure.
Hospitals and clinics lead nanobot adoption because they already have the beds, specialists, and monitoring infrastructure needed for nano-scale procedures. OECD countries averaged 4.2 hospital beds per 1,000 people in 2023, while Korea reported 12.8.
WHO estimates hospital sepsis treatment costs above US$32,000 per patient, with about 15 per 1,000 admitted patients developing sepsis, strengthening interest in technologies that can reduce treatment time and complications. Biopharmaceutical companies are expanding fastest because they have the financial capacity to build in-house nano-fabrication and testing capabilities.
Thermo Fisher Scientific reported US$44.56 billion in 2025 revenue, up 4% from US$42.88 billion, while Agilent Technologies generated US$6.95 billion in fiscal 2025, increasing 6.7%. This supports higher spending on pilot lines, nanomanipulators, specialist talent, and proprietary delivery platforms.
Key Market Segments
By Type
- Microbivore Nano Robots
- Respirocyte Nano Robots
- Clot-Cutter Nano Robots
- Cellular Repair Nanorobots
- Others
By Application
- Nano Medicine
- Biomedical
- Mechanical
- Others
By End Use
- Hospital and Clinics
- Biopharmaceutical Industries
- Research Laboratories
- Others
Geopolitical Impact Analysis
Trade friction now sets the cost base for nanobot production. The WTO expects world goods trade volume to grow just 1.9% in 2026, down sharply from 4.6% in 2025, and it links the slowdown to tariffs and conflict risk. Tariffs bite directly. The Budget Lab at Yale measured the United States average effective tariff rate at 10.9% before substitution in August 2026.
Nanobot builders import piezo actuators, rare earth magnets, ultra-pure gold and silver targets, silicon wafers, and vacuum chambers, so a double-digit duty raises the landed cost of a single nanomanipulation platform by tens of thousands of dollars. Buyers pass that cost into service contracts and instrument prices.
Shipping adds a second layer. Carriers still route Asia-to-Europe traffic around the Cape of Good Hope, which adds 10 to 14 days to each voyage and burns far more fuel. Freight analysts put the extra cost at roughly $200 to $400 per TEU on that detour, and Asia-to-Europe spot rates sat near $3,523 per FEU in 2026.
Two extra weeks matter for cryogenic parts, calibration standards, and reagent kits with short shelf lives. Service teams then hold larger buffer stocks, which ties up working capital. Services trade holds up better, growing 5.3% in 2025 with 4.8% projected for 2026, so vendors lean harder on remote calibration and software subscriptions to protect margins while hardware flows stay slow.
Regional Analysis
North America dominates the Nanobots Market, holding a 40% share and generating USD 3.8 billion in revenue. Federal science funding anchors this position. Congress set the total NIH and ARPA-H funding level at $48.933 billion for fiscal 2026, about 0.9% above the prior year, with ARPA-H alone holding $1.5 billion for high-risk health technology programs.
Asia Pacific ranks as the fastest-growing region in the Nanobots Market, and rising national science budgets drive that speed. China directed 277.8 billion yuan into basic research in 2025, an 11.1% jump over 2024. India lifted its Ministry of Health and Family Welfare allocation to 1,06,530.42 crore rupees for 2026 to 2027, with the Department of Health Research receiving 26% more than the prior year.
Europe holds the second position and leans on coordinated public research funding. The European Commission adopted the Horizon Europe 2026 to 2027 work programme in December 2025 with a total budget of 14 billion euros, and Cluster 1 for health carries more than 1.33 billion euros of that total. Germany leads in precision instruments and materials analysis.
US Market Size
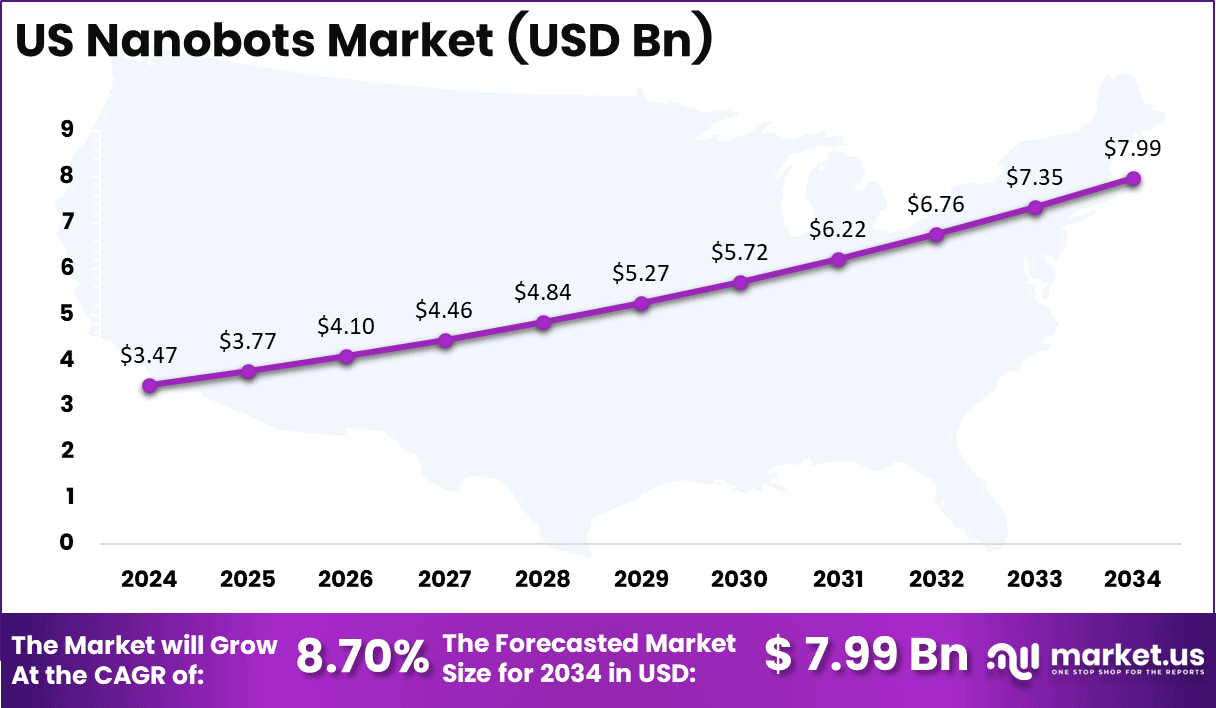
The US nanobots market was valued at USD 3.47 billion in 2024 and is projected to reach USD 7.99 billion by 2034, expanding at a CAGR of 8.7% from 2025–2034. This growth is driven by strong investments in nanomedicine, precision drug delivery systems, and advanced healthcare robotics.
Increasing adoption in biomedical engineering and regenerative medicine further supports market expansion. Nanobots are gaining traction due to their ability to perform targeted therapeutic interventions, improve surgical precision, and accelerate drug discovery processes, establishing a key foundation for future advancements in medical nanotechnology across the United States.
Key Regions and Countries
North America
- US
- Canada
Europe
- Germany
- France
- The UK
- Spain
- Italy
- Rest of Europe
Asia Pacific
- China
- Japan
- South Korea
- India
- Australia
- Rest of APAC
Latin America
- Brazil
- Mexico
- Rest of Latin America
Middle East and Africa
- GCC
- South Africa
- Rest of MEA
Market Dynamics
Drivers
| Driver | (~) % Impact on CAGR Forecast | Geographic Relevance | Impact Timeline |
|---|---|---|---|
| Clinically validated magnetic microrobot navigation in large-animal models | +2.1% | Global; led by Switzerland, Germany, United States | Short term (2 years or less) |
| Sustained multi-agency federal nanoscale R&D appropriations | +1.6% | United States, Japan, South Korea | Short term (2 years or less) |
| Transfer of semiconductor atomic-layer deposition and metrology toolchains | +1.3% | Taiwan, South Korea, United States, Netherlands | Medium term (2 to 4 years) |
| Tertiary oncology centre adoption of targeted intra-arterial delivery | +1.0% | North America, Western Europe, China | Medium term (2 to 4 years) |
| Maturation of DNA-origami and molecular-machine platform IP | +0.8% | United States, Denmark, China | Medium term (2 to 4 years) |
| Deployment of nanoscale biosensing in point-of-care diagnostics | +0.6% | Global; fastest in India, ASEAN | Short term (2 years or less) |
Clinically Validated Magnetic Microrobot Navigation
A major milestone came in November 2025, when an ETH Zurich-led consortium demonstrated magnetic microrobots navigating in vivo through sheep and pigs, with controlled payload delivery. Sterile microrobot cartridges could achieve gross margins of 65% to 78%, compared with 35% to 45% for conventional nanoparticle manufacturing.
Translational funding is also moving projects closer to clinical development. Structured preclinical programs could shorten characterization timelines by around 9 to 14 months, while hospital procurement may extend commercial sales cycles to 12 to 24 months. Platform developers may also allocate approximately 20% to 25% of operating expenses to clinical-affairs capabilities as commercialization progresses.
Restraints
| Restraint | (~) % Impact on CAGR Forecast | Geographic Relevance | Impact Timeline |
|---|---|---|---|
| EU MDR Rule 19 Class III reclassification and notified-body queue | -1.8% | European Union, EEA, Switzerland | Short term (2 years or less) |
| Statutory prohibition of nano ingredient classes in EU consumer products | -1.4% | European Union | Short term (2 years or less) |
| Restrictive policy rates suppressing deep-tech venture and CapEx financing | -1.1% | Global; acute in Europe, India | Short term (2 years or less) |
| Absence of dedicated procedural reimbursement codes | -0.9% | United States, Japan, Germany | Medium term (2 to 4 years) |
| Export controls on advanced lithography and nanofabrication tooling | -0.7% | China, Russia, restricted-entity jurisdictions | Medium term (2 to 4 years) |
| No approved autonomous nanorobotic therapeutic on any national register | -0.5% | Global | Long term (4 years or more) |
EU MDR Rule 19 Reclassification And Notified-Body Queue
EU Medical Device Regulation Annex VIII Rule 19 places nanomaterial-based devices with high or medium internal exposure in Class III, while only negligible-exposure products can qualify for Class IIa. Injectable or intravascular nanobots therefore face the stricter Annex IX assessment route. The compliance deadline for custom-made Class III implantable devices is 26 May 2026, while fewer than 50 MDR-designated notified bodies are available to support certification demand.
Class III assessments typically require 13 to 24 months, with documentation deficiencies adding another 4 to 8 months. MDR certification costs are estimated at 3 to 5 times pre-2021 levels, contributing to EBIT margin pressure of around 300 to 600 basis points. Developers may also defer cleanroom investment by 2 to 3 fiscal years and prioritize launches in markets with faster regulatory pathways.
Challenges
| Challenge | (~) % CAGR Friction Drag | Geographic Relevance | Mitigation Horizon |
|---|---|---|---|
| Nanofabrication process talent deficit | -1.5% | Global; acute in the United States, EU, Japan | Long term (4 years or more) |
| Cleanroom capacity and yield | -1.2% | North America, Western Europe | Medium term (2 to 4 years) |
| Biodistribution and immune clearance | -1.0% | Global | Long term (4 years or more) |
| Batch-to-batch characterisation burden | -0.8% | Global; regulated markets first | Medium term (2 to 4 years) |
| Precious and rare-earth input volatility | -0.6% | China-dependent supply chains | Medium term (2 to 4 years) |
| Imaging and navigation interoperability | -0.4% | Global hospital installed base | Medium term (2 to 4 years) |
Nanofabrication Process Talent Deficit
Nanobot manufacturing faces a major talent constraint because it competes with semiconductor fabrication for the same nanoscale process engineers. The industry may require more than 1 million additional skilled workers by 2030, with the engineering shortfall potentially reaching around 153,000 by 2035. Senior process roles can take 6 to 11 months to fill, while wages are increasing by around 8% to 15% annually.
Each vacant engineering position can reduce effective line utilization by roughly 10% to 18% and extend technology transfer by 8 to 16 weeks. Companies are responding through apprenticeship programs, geographic diversification, and automated characterization, although these measures can raise near-term operating expenses by around 150 to 350 basis points before productivity and yield improvements are realized.
Opportunities
| Opportunity | (~) % Potential CAGR Upside | Geographic Relevance | Execution Window |
|---|---|---|---|
| Catalytic nanorobotic destruction of PFAS in water infrastructure | +1.9% | United States, European Union, Australia | Medium term (2 to 4 years) |
| Precision agrochemical nano-delivery for smallholder cropping systems | +1.5% | India, Brazil, ASEAN, Sub-Saharan Africa | Medium term (2 to 4 years) |
| Per-procedure navigation-as-a-service and outcome-linked licensing | +1.2% | United States, Gulf states, Japan | Medium term (2 to 4 years) |
| India and ASEAN nanofabrication CDMO offshoring hubs | +0.9% | India, Singapore, Malaysia, Vietnam | Long term (4 years or more) |
| Roll-up consolidation of university spinout nanorobotics IP | +0.7% | Europe, North America, Israel | Short term (2 years or less) |
| In-line nanoscale defect repair for advanced packaging lines | +0.5% | Taiwan, South Korea, United States | Long term (4 years or more) |
Catalytic Nanorobotic Destruction Of PFAS
PFAS-destruction nanorobots remain an untapped opportunity because utilities still rely mainly on activated carbon, ion exchange, and reverse osmosis. EPA limits PFOA and PFOS to 4 parts per trillion, with monitoring from 2027 and compliance between 2029 and 2031. A reusable catalytic nanorobot operating across 20 to 50 duty cycles could reduce treatment costs by around 30% to 55% compared with disposable media.
A cartridge-plus-regeneration model could support gross margins of roughly 55% to 70%, compared with about 20% to 30% for commodity treatment media. However, drinking-water certification, pilot approvals, and municipal qualification can take 18 to 36 months, making early deployment critical ahead of the 2029 compliance deadline.
Key Players Analysis
Thermo Fisher Scientific leads Tier 1 by scale. The company posted full-year 2025 revenue of $44.56 billion, up 4% from $42.88 billion in 2024, and spent $1.397 billion on research and development, equal to 3.1% of revenue. Agilent Technologies follows with fiscal 2025 revenue of $6.95 billion, up 6.7% reported, and R&D of $455 million.
Teledyne Technologies reported 2025 sales near $6.12 billion, a 7.9% rise, and deployed about $850 million on acquisitions during the year. Tier 2 players hold sharp technical niches. Bruker Corporation closed fiscal 2025 with revenue of $3.44 billion and guides fiscal 2026 to $3.57 billion to $3.60 billion, a 4% to 5% reported gain.
Bruker raised $600 million through mandatory convertible preferred stock in September 2025, netting roughly $582 million to fund its balance sheet. Oxford Instruments plc reported fiscal 2026 revenue of £423.2 million with adjusted operating profit of £73.7 million, and it invested £37.1 million in R&D, equal to 8.8% of sales.
Smaller specialists compete on precision rather than scale. Nanonics Imaging, Angstrom Advanced, and Kleindiek Nanotechnik build scanning probe and nanomanipulation systems for university and semiconductor labs, and they win orders through custom configurations. Cavendish Capital Markets supports the sector through financing and advisory work rather than hardware supply.
Top Key Players in the Market
- Oxford Instruments plc
- Thermo Fisher Scientific
- Bruker Corporation
- Teledyne Technologies Incorporated
- Agilent Technologies, Inc.
- Cavendish Capital Markets Limited
- Nanonics Imaging Ltd.
- Angstrom Advanced Inc.
- Kleindiek Nanotechnik GmbH
Recent Developments
- In June 2025, Oxford Instruments plc signed a binding agreement to sell its NanoScience quantum business to Quantum Design International for £60 million in total cash consideration, including up to £3 million of deferred consideration, and launched a share buyback of up to £50 million.
- In September 2025, Thermo Fisher Scientific completed the acquisition of Solventum’s Purification and Filtration business for approximately $4.0 billion in cash, adding a unit expected to generate about $750 million of revenue in 2025.
- In September 2025, Bruker Corporation priced a public offering of $600.0 million of 6.375% Mandatory Convertible Preferred Stock, with an underwriter option for a further $90.0 million and estimated net proceeds of about $582.0 million.
- In February 2026, Teledyne Technologies acquired DD-Scientific Holdings Limited and its subsidiary DD-Scientific Limited for approximately $53.0 million in cash, net of cash acquired.
Report Scope
| Report Features | Description |
|---|---|
| Market Value (2024) | USD 9.6 Billion |
| Forecast Revenue (2034) | USD 25.7 Billion |
| CAGR (2025-2034) | 10.3% |
| Base Year for Estimation | 2024 |
| Historic Period | 2020-2023 |
| Forecast Period | 2025-2034 |
| Report Coverage | Revenue Forecast, Market Dynamics, Competitive Landscape, Recent Developments |
| Segments Covered | By Type (Microbivore Nano Robots, Respirocyte Nano Robots, Clottocyte Nano Robots, Cellular Repair Nanorobots, Others); By Application (Nano Medicine, Biomedical, Mechanical, Others); By End Use (Hospitals and Clinics, Biopharmaceutical Industries, Research Laboratories, Others) |
| Regional Analysis | North America – US, Canada; Europe – Germany, France, The UK, Spain, Italy, Rest of Europe; Asia Pacific – China, Japan, South Korea, India, Australia, Singapore, Rest of APAC; Latin America – Brazil, Mexico, Rest of Latin America; Middle East & Africa – GCC, South Africa, Rest of MEA |
| Competitive Landscape | Oxford Instruments plc, Thermo Fisher Scientific, Bruker Corporation, Teledyne Technologies Incorporated, Agilent Technologies, Inc., Cavendish Capital Markets Limited, Nanonics Imaging Ltd., Angstrom Advanced Inc., Kleindiek Nanotechnik GmbH |
| Customization Scope | Customization for segments, region/country-level will be provided. Additional customization can be done based on requirements. |
| Purchase Options | We have three licenses to opt for: Single User License, Multi-User License (Up to 5 Users), Corporate Use License (Unlimited Users and Printable PDF) |





























