


Report Overview
In 2025, the Global Generative AI 2.0 Market was valued at USD 11.8 billion. The market is projected to grow at a CAGR of 38.9% during 2026–2035, reaching approximately USD 315.1 billion by 2035. North America dominated the global market in 2025, accounting for more than 45.0% of the total market share and generating approximately USD 5.31 billion in revenue.
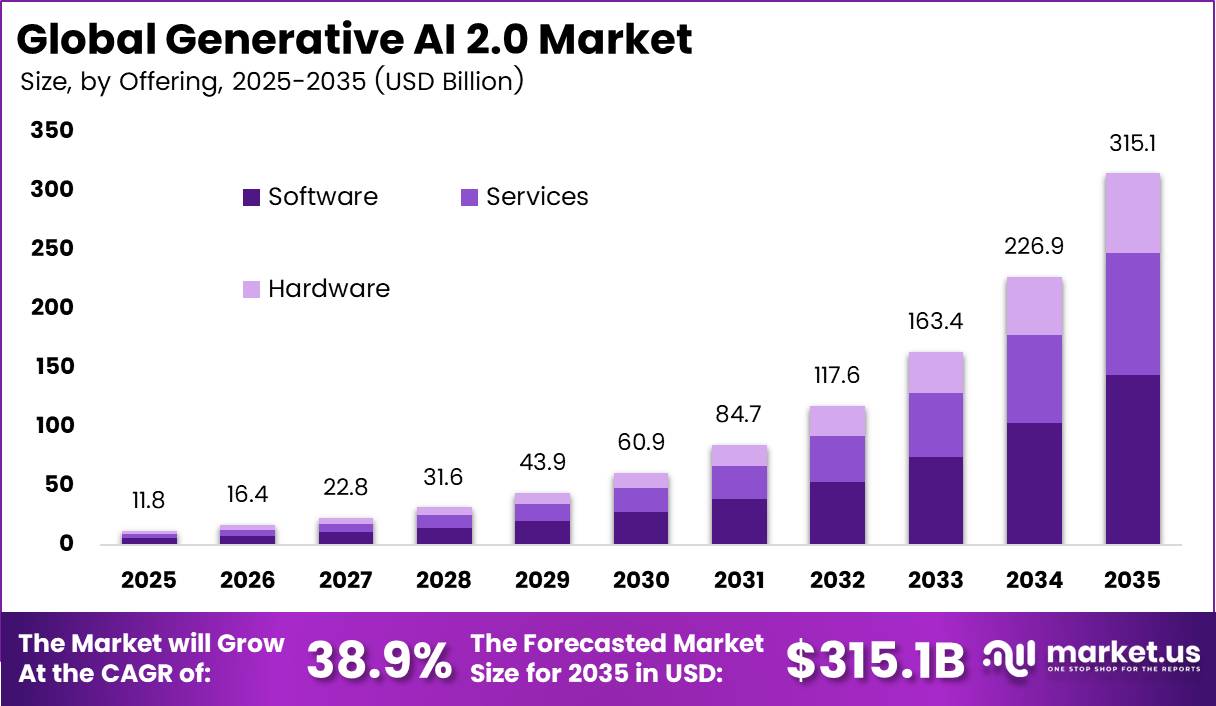
This surge is tied directly to explosive enterprise uptake. According to the Stanford HAI 2025 AI Index, 78% of organizations used AI in at least one business function in 2024, up from 55% a year earlier, while the share using generative AI more than doubled from 33% to 71%.
The OECD reported that 20.2% of firms across member states used AI in 2025, up from 8.7% in 2023, feeding direct demand for foundation models, inference hardware, and managed services. Chipmaker filings show the same pull. NVIDIA reported full-year fiscal 2025 revenue of USD 130.5 billion, up 114%, with data center revenue rising 142% to USD 115.2 billion as buyers rushed to deploy generative workloads.
Key Takeaways
- The market stood at USD 11.8 billion in 2025 and is set to reach USD 315.11 billion by 2035. Growth will run at a CAGR of 38.9% across the 2026 to 2035 forecast window.
- Software leads the Offering segment with a 57.85% share, while Services is the fastest-growing sub-segment.
- Text leads the Data Modality segment with a 36.1% share, while Multimodal is the fastest-growing sub-segment.
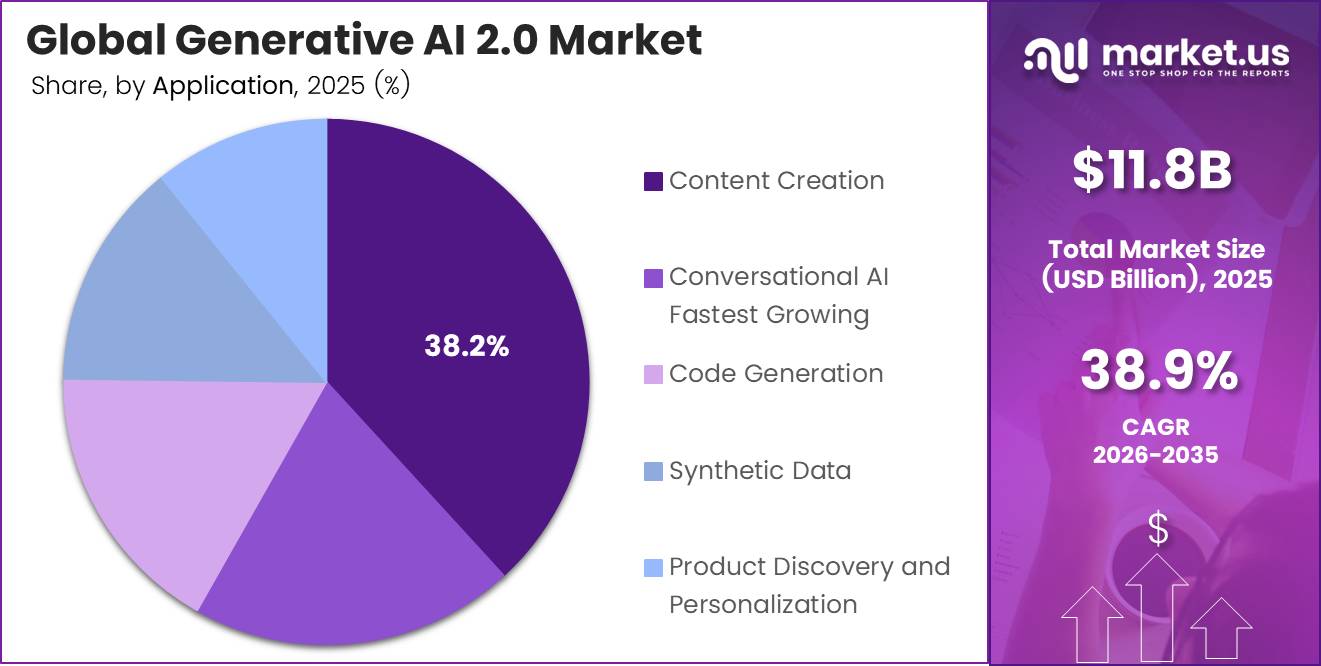
- Content Creation leads the Application segment with a 38.2% share, while Conversational AI is the fastest-growing sub-segment.
- Media and Entertainment leads the Industry Vertical segment with a 29.7% share.
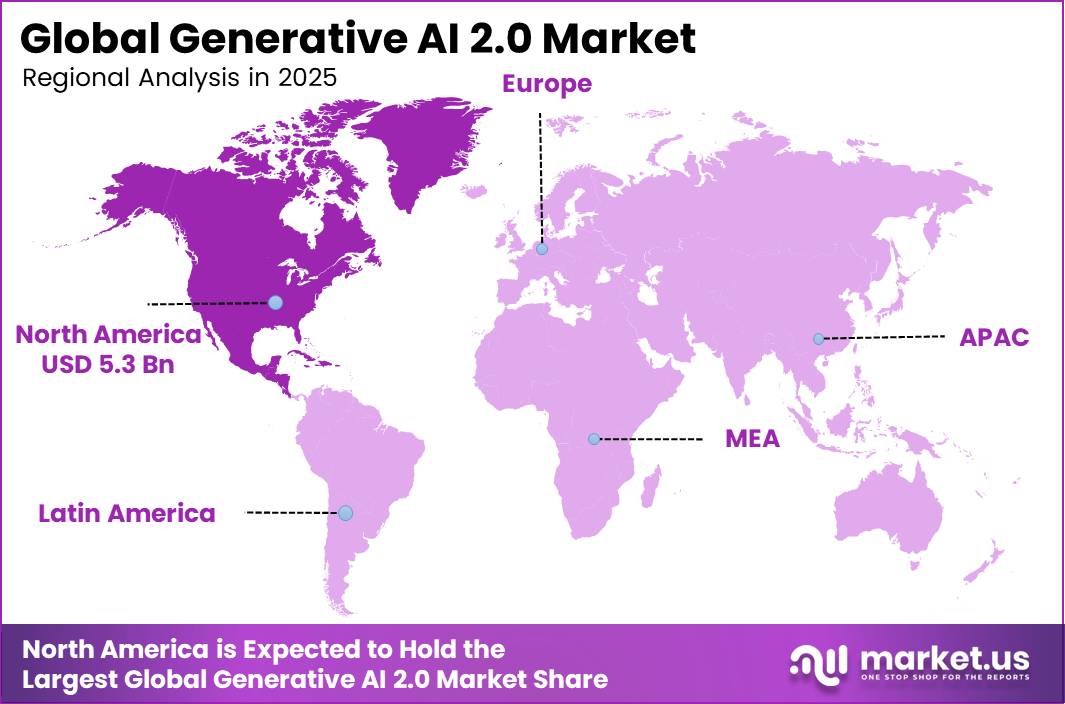
- North America leads the market with a 45.0% share and USD 5.31 billion in revenue.
Market Statistics and Data Insights
Operational Efficiency and Performance
- Enterprise developers using AI coding tools took 19% longer to complete tasks than those working without them, despite developers predicting a 24% speedup, per a randomized controlled trial of experienced open-source developers.
- Even after experiencing this measured slowdown, developers still self-reported believing AI had sped them up by 20%, revealing a 43-point perception gap between actual and perceived productivity.
- Getting engineers to code 3x faster with AI tools delivers only about 2-5% more organizational output when other workflow factors remain unchanged, according to engineering-productivity benchmarking analysis.
- 64% of organizations now require end-to-end AI response times under 250 milliseconds for their most critical use cases, yet 50% of deployments fail to meet this latency threshold at peak load.
Technology Adoption Rates
- 88% of surveyed organizations report regular AI use in at least one business function in 2025, up from 78% a year earlier, per McKinsey’s global AI survey.
- 23% of respondents report their organizations are actively scaling an agentic AI system across at least one business function, while an additional 39% are experimenting with AI agents.
- Google’s developer usage of generative AI models rose to 69% of surveyed respondents in early 2025, versus 55% who used OpenAI models in the same period, with Meta and IBM models trailing at 38% and 26% respectively.
Energy Efficiency and Sustainability
- The NVIDIA GB200 Grace Blackwell Superchip demonstrated 25x greater energy efficiency than the prior Hopper GPU generation for AI inference workloads.
- Meta’s MTIA accelerator reaches up to 2.1×10^12 FLOP/s per watt in tensor-FP16 format, while NVIDIA’s H100 reaches up to 1.4×10^12 FLOP/s per watt, with leading ML hardware historically becoming roughly 40% more energy-efficient each year.
- Average data-center Power Usage Effectiveness (PUE) declined from 1.44 in 2019 to 1.38 in 2024, with hyperscale providers achieving an industry-leading PUE of 1.22, even as water consumption rose 9.6% over five years due to AI-driven liquid cooling demand.
- A best-practice data-center scenario suggests over 7% additional PUE reduction and over 85% Water Usage Effectiveness (WUE) reduction is achievable relative to current AI data-center baselines of PUE 1.58 and WUE 1.8.
- Energy consumption per LLM query varies enormously across models: OpenAI’s o3 model consumes over 33-39 Wh per long prompt—more than 70 times the 0.454 Wh consumed by GPT-4.1 nano—based on infrastructure-level benchmarking of 30 commercially deployed models.
Cost and Technical Efficiency Data
- Per-token inference prices for major generative AI providers fell roughly 75% within a single year, with average cost per million tokens dropping from approximately $10 to $2.50.
- Epoch AI research indicates generative AI inference costs are dropping at rates approaching 200x per year once both pricing and hardware/model efficiency improvements are accounted for.
- Gartner projects that running inference on a 1-trillion-parameter model will cost large language model providers more than 90% less by 2030 versus 2025, with LLMs becoming up to 100 times more cost-efficient than 2022-era models over the same period.
By Offering
Software dominates with 57.85% due to recurring license revenue anchoring enterprise deployments.
Software leads the offering segment because enterprises buy generative AI mostly as subscription platforms and API access, not one-off tools. Gartner data shows worldwide AI application software spending will more than double from USD 83.7 billion in 2024 to USD 172 billion in 2025, and AI infrastructure software will climb from USD 56.9 billion to USD 126.2 billion in the same window.
Accenture’s FY2025 shareholder letter reports generative AI revenue tripled to USD 2.7 billion, with bookings nearly doubling to USD 5.9 billion across 6,000 client projects. Deloitte has committed over USD 3 billion in GenAI investments through FY2030 to expand delivery capacity, showing the pull toward integration and consulting work
By Data Modality
Text dominates with 36.1% due to mature language models powering daily workflows.
Text remains the leading modality because large language models sit at the heart of the most used consumer and enterprise tools. OpenAI’s DevDay 2025 disclosure confirmed ChatGPT hit 800 million weekly active users, processing 6 billion tokens per minute through the API, and 4 million developers now build on the platform.
A World Bank study shows Gemini reached 187 million monthly visits and 104 million users by May 2025, reinforcing text as the mass adoption modality. Text tools also power code, summaries, and search, giving them the widest install base. Multimodal is the fastest-growing sub-segment because new models handle text, image, audio, and video in one pass.
OpenAI’s ChatGPT usage study shows non-work conversations rose from 53% to over 70% between late 2022 and July 2025, driven mainly by image and voice prompts. Google’s Gemini and Anthropic’s Claude also shipped multimodal features across 2025, feeding sharp uptake in creative and analytical workflows.
By Application
Content Creation dominates with 38.2% due to broad creative workflow integration across enterprises.
Content Creation leads because generative AI slots directly into existing design, marketing, and video pipelines. Adobe’s April 2025 press release confirmed the general availability of Firefly Image Model 4, Firefly Image Model 4 Ultra, and the Firefly Video Model, giving enterprises commercially safe outputs for brand work.
Firefly Standard plans start at USD 9.99 per month with 2,000 video credits, while Pro plans deliver 7,000 credits at USD 29.99, driving high-volume creative use inside agencies and studios. GitHub’s own telemetry, cited in Microsoft’s FY2025 earnings, shows GitHub Copilot has 20 million users and adoption across 90% of Fortune 100 firms, with AI projects on GitHub more than doubling in a year.
Conversational AI is the fastest-growing sub-segment because customer service and internal help desks now run on chat agents. Salesforce State of Service data shows 69% of companies worldwide deployed at least one chatbot or AI chat agent in 2025, and Copilot Studio now supports more than 230,000 organizations building agents.
By Industry Vertical
Media and Entertainment dominates with 29.7% due to studio adoption in VFX, dubbing, and post-production.
Media and Entertainment leads the vertical mix because studios have folded generative AI into visual effects, localization, and marketing pipelines. Netflix used generative tools for VFX in its original series The Eternaut, per Bloomberg’s Hollywood AI report, and used AI to de-age characters in Happy Gilmore 2.
In December 2025, Walt Disney signed a three-year licensing deal with OpenAI worth USD 1 billion, giving Sora access to more than 200 characters from Disney, Marvel, Pixar, and Star Wars franchises. Studios still spend cautiously on creative content generation, holding it below 3% of production budgets, while pushing about 7% of operational spend into AI tools for localization, contract review, and marketing.
Healthcare adoption is expanding through cleared medical devices. The U.S. FDA authorized 1,451 AI-enabled devices cumulatively by the end of 2025, with 350 cleared in 2025 alone. Banking is scaling too, with JPMorgan Chase rolling out its LLM Suite to more than 200,000 employees across 175 use cases.
Key Market Segments
By Offering
- Software
- Services
- Hardware
By Data Modality
- Text
- Multimodal
- Audio and Speech
- Image and Video
- Code
By Application
- Conversational AI
- Content Creation
- Code Generation
- Synthetic Data
- Product Discovery and Personalization
By Industry Vertical
- Media and Entertainment
- Healthcare
- Banking, Financial Services, and Insurance (BFSI)
- E-commerce and Retail
- Automotive
- Marketing and Advertising
- Other
Geopolitical Impact Analysis
Trade friction now shapes every stage of generative AI supply chains. On January 15, 2026, the White House imposed a 25% tariff under Section 232 on advanced logic integrated circuits used in AI, covering GPUs and related computing gear routed through Taiwan and other foundry hubs, per U.S. BIS filings.
The Congressional Research Service confirms the U.S. added 42 Chinese entities to the Entity List in March 2025 and 23 more in September 2025, plus a full license requirement on NVIDIA H20 shipments to China. These moves lifted landed costs for AI accelerators and forced hyperscalers to reroute orders, since U.S. rules cap AI compute deployment abroad at 50% of total capacity and 7% in any single non-Tier 1 country.
Logistics stress compounds the tariff load. UNCTAD reported that Red Sea traffic fell over 42% after late 2023 disruptions, adding 10 to 14 transit days for Asia-to-Europe container shipping that carries HBM memory, server racks, and networking parts.
UNCTAD’s 2025 Maritime Transport Review also flags new U.S. port fees on foreign-built vessels that raise inbound hardware costs. On the demand side, WTO compliance filings list U.S. tariffs on Chinese lithium-ion batteries lifted from 7.5% to 25% and photovoltaic cells from 25% to 50%, both critical for the power backbone of AI data centers. Together, these measures push training and inference costs higher and pull capacity back onto U.S. soil.
Regional Analysis
North America dominates the Generative AI 2.0 Market, holding a 45.0% share and generating USD 5.31 billion in revenue. The United States drives this lead through a mix of hyperscaler capex, model developer density, and deep venture capital pools. This spending pattern locks in North American capacity for training and inference workloads that other regions cannot yet match at scale.
Asia Pacific is the fastest-growing region in the Generative AI 2.0 Market. China, Japan, South Korea, and India are the growth engines. Chinese cloud firms and model labs pushed adoption sharply, with the Stanford AI Index noting Greater China posted a 27-point year-over-year jump in AI adoption, the largest globally. India’s IndiaAI Mission commits INR 10,371 crore to compute and skills, expanding domestic model builds.
Europe holds a solid second position through strong regulation, sovereign compute programs, and strategic AI investment across Germany, France, and the U.K. Per the OECD via ITIF, U.K. firm AI adoption rose from 9.9% in 2023 to 20.5% in 2025, and Germany moved from 11.6% to 19.7%. The EU AI Act rollout is pulling enterprise spend toward compliant, EU-hosted deployments and boosting local vendors.
Key Regions and Countries
North America
- US
- Canada
Europe
- Germany
- France
- The UK
- Spain
- Italy
- Rest of Europe
Asia Pacific
- China
- Japan
- South Korea
- India
- Australia
- Rest of APAC
Latin America
- Brazil
- Mexico
- Rest of Latin America
Middle East and Africa
- GCC
- South Africa
- Rest of MEA
Market Dynamics
Drivers
| Driver | (~) % Impact on CAGR Forecast | Geographic Relevance | Impact Timeline |
|---|---|---|---|
| Hyperscaler CapEx Buildout | +4.2% | North America, Asia Pacific | Short term (2 years or less) |
| Enterprise Copilot Standardization | +3.1% | Global | Short term (2 years or less) |
| Foundation Model Cost Decline | +2.6% | Global | Short term (2 years or less) |
| Sovereign AI Compute Programs | +2.0% | Europe, GCC, India | Medium term (2 to 4 years) |
| Developer Ecosystem Expansion | +1.4% | Global | Short term (2 years or less) |
| Consumer Adoption Flywheel | +1.2% | Global | Short term (2 years or less) |
Hyperscaler CapEx Buildout
Hyperscaler capital spending is a major force pushing the baseline growth rate above 38.9%, contributing an estimated +4.2% to CAGR. Alphabet’s 2025 capital expenditure nearly doubled year on year, with further increases planned through 2026 for AI servers, custom TPUs, and data-center capacity.
Microsoft reported Azure growth of more than 34% on a constant-currency basis in fiscal 2025, while Meta indicated that its fiscal 2026 capital expenditure could reach triple-digit billions. This investment is also changing AI infrastructure economics. Power procurement is moving toward continuous multi-gigawatt contracts, with individual AI-related interconnection applications exceeding 2 gigawatts.
Restraints
| Restraint | (~) % Impact on CAGR Forecast | Geographic Relevance | Impact Timeline |
|---|---|---|---|
| Advanced Chip Export Controls | -2.8% | China, Tier 2 Countries | Short term (2 years or less) |
| EU AI Act Compliance Costs | -1.6% | Europe | Short term (2 years or less) |
| Data Center Power Grid Limits | -1.4% | North America, Ireland | Medium term (2 to 4 years) |
| Copyright and IP Litigation | -1.1% | Global | Short term (2 years or less) |
| Enterprise ROI Skepticism | -0.9% | Global | Short term (2 years or less) |
Advanced Chip Export Controls
U.S. semiconductor export controls represent a major near-term constraint, reducing the baseline CAGR by an estimated -2.8%. The January 2026 Bureau of Industry and Security Final Rule introduced a 25% Section 232 tariff on qualifying advanced logic integrated circuits, alongside Entity List restrictions expanded during 2025.
Semiconductor categories 8471.50, 8471.80, and 8473.30 also face pre-shipment security reviews that can add multi-week clearance periods, restricting accelerator availability across Tier 2 and Tier 3 markets. The impact is visible across 3 areas.
Chip-dependent hyperscaler operations in restricted markets face margin pressure measured in double-digit basis points, while generative AI vendors serving Chinese enterprises are delaying some CapEx investments. At the same time, Chinese rare-earth export controls are increasing costs for cooling and networking equipment, forcing some generative AI operators to absorb landed-cost premiums of 15% or higher over the short term.
Challenges
| Challenge | (~) % CAGR Friction Drag | Geographic Relevance | Mitigation Horizon |
|---|---|---|---|
| AI Talent Supply Gap | -2.2% | Global | Long term (4 years or more) |
| Model Hallucination Reliability | -1.7% | Global | Medium term (2 to 4 years) |
| HBM Memory Supply Bottleneck | -1.5% | Global, South Korea Concentration | Medium term (2 to 4 years) |
| Data Governance Fragmentation | -1.2% | Global | Medium term (2 to 4 years) |
| Agentic AI Reliability Deficit | -1.0% | Global | Medium term (2 to 4 years) |
AI Talent Supply Gap
The shortage of specialized AI engineering, MLOps, and applied research talent creates an estimated -2.2% drag on the market’s growth potential. Across major OECD economies, the ratio of AI-skilled workers to AI-related vacancies remained below 1.0 through 2025, while hiring cycles for senior AI roles can extend to 9 months or longer.
STEM doctoral output in AI-related fields across G20 countries is also increasing only at single-digit rates each year, while U.S. access to international talent remains constrained by the annual 85,000 H-1B specialty occupation cap. To manage this shortage, companies are increasing investment in internal training and long-term reskilling programs through fiscal 2030, while also offering higher retention packages.
These talent premiums can reduce operating margins by around 150–300 basis points. At the same time, more companies are shifting parts of model training and AI development operations to talent hubs such as India and Poland to control costs and expand access to skilled workers.
Opportunities
| Opportunity | (~) % Potential CAGR Upside | Geographic Relevance | Execution Window |
|---|---|---|---|
| Vertical-Specific Foundation Models | +3.4% | Global | Medium term (2 to 4 years) |
| Edge and On-Device Inference | +2.5% | Global | Medium term (2 to 4 years) |
| Emerging Market SMB Penetration | +1.9% | Latin America, Africa, Southeast Asia | Long term (4 years or more) |
| Synthetic Data Monetization | +1.6% | Global | Medium term (2 to 4 years) |
| Physical AI and Robotics Convergence | +1.5% | Global | Long term (4 years or more) |
| Public Sector Deployment | +1.1% | Global | Medium term (2 to 4 years) |
Vertical-Specific Foundation Models
Vertical-specific foundation models represent a largely untapped opportunity that could add an estimated +3.4% upside to the baseline CAGR. Unlike horizontal Copilot tools, vertical AI adoption in areas such as healthcare, legal services, insurance, and industrial process control remains limited by domain-specific data, validation requirements, and regulation.
The commercial potential is significant. Company filings indicate that gross margins on specialized AI modules can be 15–25 percentage points higher than horizontal chatbot offerings, while average revenue per user can move from single-digit-dollar consumer pricing to four-digit or five-digit enterprise seat pricing.
Regulatory disclosures also suggest that models with documented training-data provenance could reduce cost per inference for regulated workloads by around 30%, supporting stronger unit economics as public-sector and regulated-industry procurement expands over the medium term.
Key Players Analysis
Tier 1 leaders anchor the market through model IP, hyperscale compute, and chip supply. NVIDIA’s Q4 FY2025 SEC filing reports data center revenue of USD 115.2 billion for the full year, up 142%, with USD 11 billion from Blackwell in a single quarter. Microsoft’s FY2025 annual report shows Microsoft Cloud revenue of USD 46.7 billion in Q4 alone, and the FY26 Q3 disclosure puts the AI business run rate at USD 37 billion, up 123% year-over-year.
Alphabet’s 2025 10-K reports USD 91.4 billion in 2025 capital expenditures, nearly double the 2024 figure, aimed mainly at AI infrastructure. Deal activity shows how tier leaders are locking in Tier 2 challengers. Microsoft, Nvidia, and Anthropic announced in November 2025 that Microsoft would invest up to USD 5 billion and Nvidia up to USD 10 billion in Anthropic, valuing the startup around USD 350 billion, with Anthropic committing USD 30 billion to Azure.
Meta’s June 2025 Scale AI transaction placed USD 14.3 billion for a 49% non-voting stake at a USD 29 billion valuation. Amazon’s February 2026 OpenAI deal committed up to USD 50 billion to OpenAI alongside a USD 38 billion cloud purchase pact.
Tier 2 challengers include Cohere, Stability AI, xAI, Baidu, IBM, Oracle, SAP, Adobe, and Salesforce. xAI’s Series E closed at USD 20 billion in January 2026 at a USD 230 billion valuation, with Nvidia and Cisco Investments among backers. Adobe and Salesforce hold strong enterprise footholds through Firefly and Einstein GPT built on partner models, while IBM’s watsonx and Oracle’s OCI Generative AI target regulated industries.
Top Key Players in the Market
- OpenAI
- Alphabet Inc. (Google and Google DeepMind)
- Microsoft Corporation
- NVIDIA Corporation
- Amazon Web Services
- Meta Platforms, Inc.
- Anthropic
- IBM Corporation
- Adobe Inc.
- Salesforce, Inc.
- Oracle Corporation
- SAP SE
- Cohere
- Stability AI
- Baidu, Inc.
- xAI
Recent Developments
- In April 2026, Broadcom and Meta extended their multi-year custom-silicon partnership through 2029 to develop successive generations of Meta Training and Inference Accelerator (MTIA) ASICs. The initial deployment commitment exceeds 1 gigawatt of compute capacity, establishes a multi-gigawatt rollout roadmap, and includes Broadcom technology across chip design; the first accelerator is positioned as the industry’s first 2 nm AI compute accelerator.
- In January 2026, TSMC set a 2026 capital-expenditure program of US$52 billion–US$56 billion, after investing approximately US$40.9 billion in 2025. The record manufacturing outlay expands advanced-node and packaging capacity underpinning high-performance and application-specific AI semiconductors, with the company later indicating spending would trend toward the top of the announced range.
Report Scope
| Report Features | Description |
|---|---|
| Market Value (2025) | USD 11.8 Billion |
| Forecast Revenue (2035) | USD 315.11 Billion |
| CAGR (2026-2035) | 38.9% |
| Base Year for Estimation | 2025 |
| Historic Period | 2020-2024 |
| Forecast Period | 2026-2035 |
| Report Coverage | Revenue Forecast, Market Dynamics, Competitive Landscape, Recent Developments |
| Segments Covered | By Offering (Software, Services, Hardware); By Data Modality (Text, Multimodal, Audio and Speech, Image and Video, Code); By Application (Conversational AI, Content Creation, Code Generation, Synthetic Data, Product Discovery and Personalization); By Industry Vertical (Media and Entertainment, Healthcare, Banking, Financial Services, and Insurance (BFSI), E-commerce and Retail, Automotive, Marketing and Advertising, Other) |
| Regional Analysis | North America – US, Canada; Europe – Germany, France, The UK, Spain, Italy, Rest of Europe; Asia Pacific – China, Japan, South Korea, India, Australia, Singapore, Rest of APAC; Latin America – Brazil, Mexico, Rest of Latin America; Middle East & Africa – GCC, South Africa, Rest of MEA |
| Competitive Landscape | OpenAI, Alphabet Inc. (Google and Google DeepMind), Microsoft Corporation, NVIDIA Corporation, Amazon Web Services, Meta Platforms, Inc., Anthropic, IBM Corporation, Adobe Inc., Salesforce, Inc., Oracle Corporation, SAP SE, Cohere, Stability AI, Baidu, Inc., xAI |
| Customization Scope | Customization for segments, region/country-level will be provided. Moreover, additional customization can be done based on the requirements. |
| Purchase Options | We have three licenses to opt for: Single User License, Multi-User License (Up to 5 Users), Corporate Use License (Unlimited Users and Printable PDF) |





























