


Report Overview
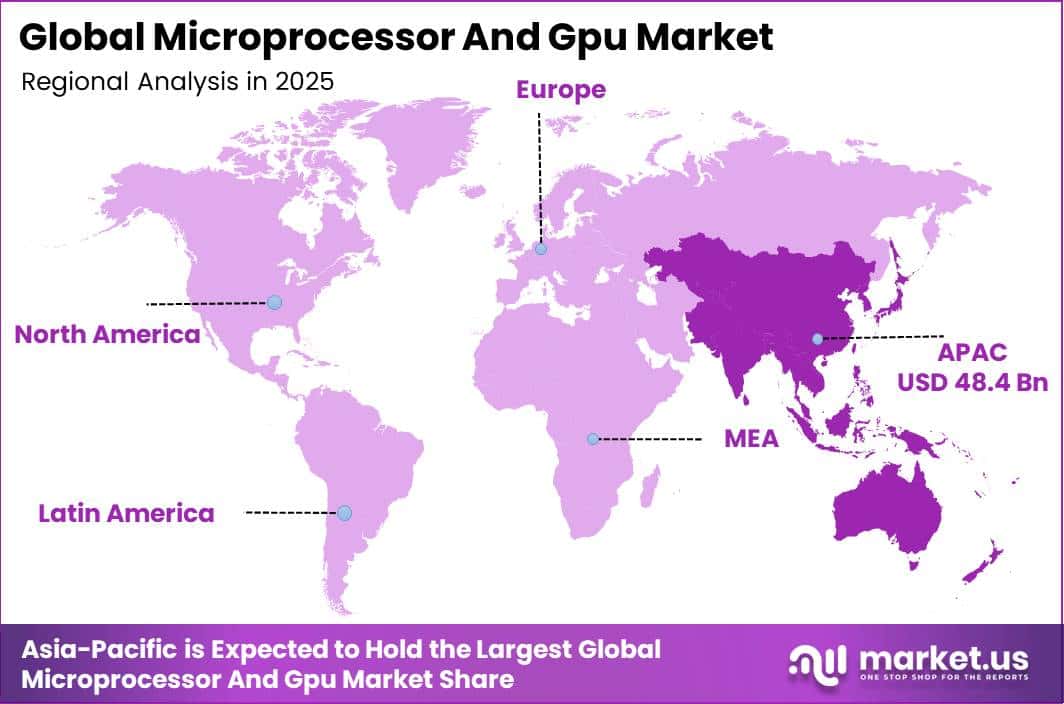
In 2025, the Global Microprocessor and GPU Market was valued at USD 130.7 billion. The market is projected to grow at a CAGR of 7.0% during 2026–2035, reaching approximately USD 257.2 billion by 2035. Asia-Pacific dominated the global market in 2025, accounting for more than 37% of the total market share and generating approximately USD 48.4 billion in revenue.
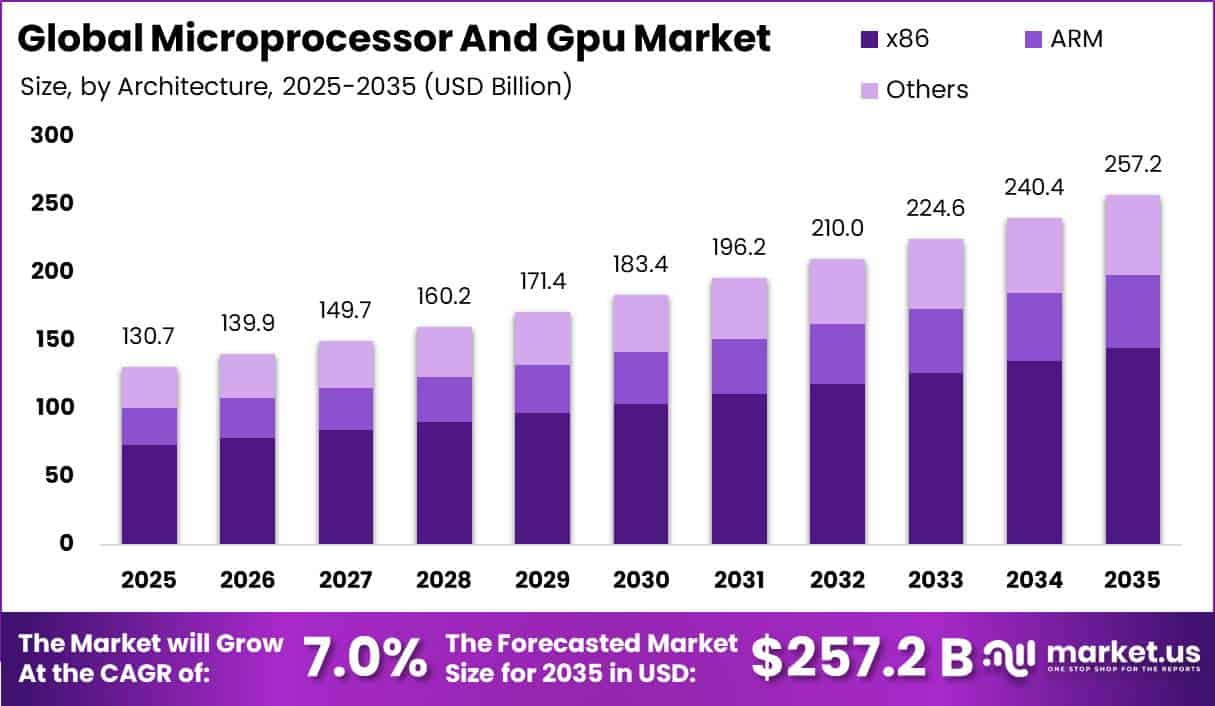
Growth is supported by rising adoption of AI, cloud computing, data centres, high-performance servers, smart electronics, and connected vehicles. The IEA expects global data-centre electricity consumption to reach around 945 TWh by 2030, more than 2 times the 2024 level, indicating strong expansion of computing infrastructure.
This growth directly increases demand for server CPUs, GPUs, and AI accelerators. WSTS reported global semiconductor sales of USD 795.6 billion in 2025, up 26.2% year on year, while the computer segment expanded by more than 60%, supported by AI and data-centre investment. WSTS reported that semiconductor sales in Asia Pacific/All Others increased 45.4% in 2025, while China recorded 17.9% growth.
Digital adoption also supports processor demand, with 6.0 billion people, or 74% of the global population, online in 2025, compared with 5.8 billion in 2024. Automotive production provides another growth base, as Asia-Oceania produced about 59.2 million vehicles in 2025, up from nearly 55.0 million in 2024, representing an increase of around 4.2 million units.
Key Takeaway
- The Microprocessor and GPU Market was valued at USD 130.7 billion in 2025 and is projected to reach USD 257.2 billion by 2035 at a 7.0% CAGR.
- The microprocessor segment held a 62.1% share, driven by broad use across PCs, smartphones, servers, and industrial equipment.
- The x86 architecture segment led with a 56.3% share, supported by enterprise, cloud, and high-performance computing demand.
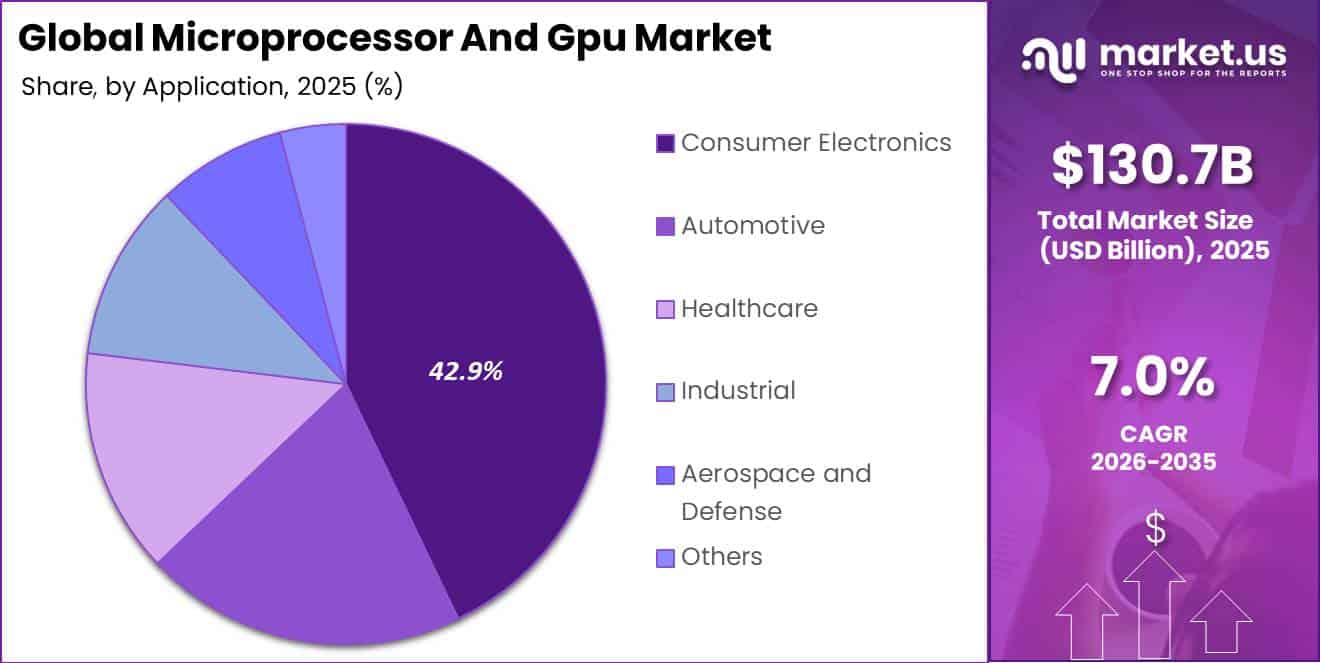
- Consumer electronics led applications with a 42.9% share, driven by high device volumes and frequent replacement cycles.
- Asia-Pacific led the market in 2025 with more than 37% share and approximately USD 48.4 billion in revenue.
By Type
The Microprocessor segment, with a 62.1% share, leads the Microprocessor and GPU Market because microprocessors are used across a much wider range of devices and systems than GPUs. They are essential in PCs, smartphones, servers, industrial controllers, robots, vehicles, and connected equipment, where they manage operating systems, data processing, communication, and real-time control functions.
Strong growth in industrial automation also supports this segment. The International Federation of Robotics reported that 542,000 industrial robots were installed worldwide in 2024, while the global operating stock reached 4.6 million units, increasing 9% year on year. In addition, Asia accounted for 74% of new robot installations, highlighting strong processor demand from the region’s manufacturing sector.
By Architecture
The x86 Architecture segment, with a 56.3% share, leads the Microprocessor and GPU Market because it remains the main computing platform for enterprise servers, business PCs, engineering workstations, and high-performance computing systems. Its strong software compatibility, mature virtualisation support, and wide use across operating systems and enterprise applications make it easier for organisations to upgrade existing infrastructure without major software changes.
Eurostat reported that 52.7% of EU enterprises used paid cloud services in 2025, increasing by 7.4 percentage points from 2023. This supports demand for standard server platforms that can efficiently handle virtual machines, databases, cloud applications, and business software. High-performance computing also strengthens x86 adoption.
According to the June 2025 TOP500 list, Intel processors powered 58.8% of the world’s 500 fastest supercomputers, while AMD processors accounted for 34.6%. Together, Intel and AMD represented 93.4% of listed systems. This large installed base, combined with continued investment in cloud infrastructure, enterprise IT, and high-performance computing, supports the continued leadership of the x86 architecture segment.
By Application
The Consumer Electronics segment, with a 42.9% share, leads the Microprocessor and GPU Market due to high device volumes and frequent product replacement cycles. Smartphones, tablets, PCs, gaming consoles, smart TVs, wearables, and connected home devices depend on microprocessors for operating systems, connectivity, sensor processing, and application performance.
GPUs are also widely used in gaming devices, premium smartphones, PCs, and smart displays for graphics processing and on-device AI functions. According to the International Telecommunication Union, global mobile-cellular subscriptions reached 9.2 billion in 2025, equal to 112 subscriptions per 100 people.
Mobile-broadband subscriptions reached 99 per 100 people, while 5G accounted for 36% of total mobile-broadband subscriptions. In addition, the Consumer Technology Association projected U.S. consumer technology retail revenue of USD 537 billion in 2025, representing 3.2% growth from 2024.
Key Market Segments
By Type
- Microprocessor
- GPU
By Architecture
- x86
- ARM
- Others
By Application
- Consumer Electronics
- Automotive
- Healthcare
- Industrial
- Aerospace and Defense
- Others
Geopolitical Impact Analysis
Geopolitical tensions are increasing costs, delivery risks, and supply-chain uncertainty across the Microprocessor and GPU Market. Semiconductor production depends heavily on East Asian wafer fabrication, advanced packaging facilities, and international assembly networks. Rising tariffs and trade restrictions can increase the landed cost of processors, GPUs, servers, graphics cards, printed circuit boards, substrates, and other electronic components.
The WTO–IMF Tariff Tracker highlights the growing use of product-level and bilateral tariffs as industrial-policy tools for strategic technology goods. Manufacturers are reviewing sourcing locations, shifting final assembly, maintaining larger inventories, and developing alternative supply routes. These measures increase working-capital requirements and may raise final product prices.
Energy costs also remain an important concern because semiconductor manufacturing is highly electricity-intensive. The IEA reported that wholesale electricity prices across the EU, India, the UK, and the US were around 20% lower on average in 2024, although prices in most markets remained above pre-COVID levels.
Regional conflicts are also creating longer shipping times between Asian manufacturing hubs and European customers. UNCTAD reported that rerouting vessels around the Cape of Good Hope added about 12 days to Shanghai–Rotterdam journeys, increasing transit time by roughly 30% and reducing effective global container-shipping capacity by around 9%.
The IMF estimated that Red Sea disruptions added 10 days or more to average delivery times on affected routes, while the Suez Canal normally handles about 15% of global maritime trade volume. These delays can disrupt processor shipments, OEM production schedules, server deployments, and component availability, while increasing reliance on higher-cost air freight.
Regional Analysis
Asia-Pacific dominated the Microprocessor and GPU Market in 2025, accounting for 37% of global revenue, or approximately USD 48.4 billion. The region benefits from a well-developed electronics supply chain covering wafer fabrication, semiconductor packaging and testing, printed circuit boards, and final assembly of smartphones, PCs, servers, gaming systems, and networking equipment.
This strong manufacturing base creates steady demand for microprocessors and GPUs across consumer and industrial applications. WSTS reported Asia-Pacific semiconductor sales of USD 220.9 billion in 2025, representing 44.6% year-on-year growth. China also recorded semiconductor sales of USD 217.1 billion, highlighting the region’s importance in global electronics production and consumption.
North America is expected to be the fastest-growing region, supported by rising investment in AI infrastructure, cloud computing, advanced servers, and domestic semiconductor manufacturing. WSTS reported semiconductor sales in the Americas of USD 254.7 billion in 2025, increasing 30.9% year on year.
Strong demand from cloud providers, AI developers, chip designers, and data-centre operators is supporting the adoption of high-performance processors and AI GPUs. In addition, the U.S. CHIPS and Science Act provides USD 52.7 billion for semiconductor manufacturing, research, and workforce development, strengthening regional production capacity and long-term processor demand.
Key Regions and Countries
- North America
- US
- Canada
- Europe
- Germany
- France
- The UK
- Spain
- Italy
- Rest of Europe
- Asia Pacific
- China
- Japan
- South Korea
- India
- Australia
- Rest of APAC
- Latin America
- Brazil
- Mexico
- Rest of Latin America
- Middle East & Africa
- GCC
- South Africa
- Rest of MEA
Market Dynamics
Drivers
| Driver | (~) % CAGR | Geographic Relevance | Impact Timeline |
|---|---|---|---|
| AI data-centre buildout | +2.0% | Global | Short term (2 years or less) |
| Enterprise cloud migration | +1.2% | North America, Europe, Asia-Pacific | Medium term (2 to 4 years) |
| AI-enabled device refresh | +0.9% | Global | Short term (2 years or less) |
| Industrial automation adoption | +0.7% | Asia-Pacific, Europe, North America | Medium term (2 to 4 years) |
| Automotive compute content | +0.5% | China, Europe, North America | Long term (4 years or more) |
AI data-centre buildout
AI data-centre expansion is a major market driver because demand is shifting toward rack-scale systems that combine CPUs, GPUs, networking, memory, and accelerated computing. The IEA projects global data-centre electricity demand to increase from about 485 TWh in 2025 to around 950 TWh by 2030, reaching nearly 3% of global electricity demand.
Strong AI and data-centre investment is also supporting semiconductor demand. WSTS reported that global semiconductor sales increased 26.2% in 2025, driven by stronger logic and memory demand.
Rising need for energy-efficient computing also supports higher-value CPU and GPU platforms. Overall, AI data-centre expansion could add around 2.0% to the market’s 7.0% baseline CAGR, while supporting higher average selling prices and software-linked revenue.
Restraints
| Restraint | (~) % CAGR | Geographic Relevance | Impact Timeline |
|---|---|---|---|
| Advanced-chip export controls | -1.3% | United States, China, Middle East, Southeast Asia | Short term (2 years or less) |
| High fab capital intensity | -0.9% | Global | Medium term (2 to 4 years) |
| Power-grid connection limits | -0.7% | North America, Europe, Asia-Pacific | Medium term (2 to 4 years) |
| Public-sector procurement limits | -0.4% | China, United States, Europe | Short term (2 years or less) |
| End-market affordability pressure | -0.3% | Emerging markets | Short term (2 years or less) |
Advanced-chip export controls
Advanced-chip export controls remain a key sales restraint because they limit where high-performance GPUs, AI accelerators, and related computing systems can be shipped and installed. The U.S. BIS introduced the AI Diffusion Rule, with planned compliance from May 15, 2025.
The rule required authorised entities to keep at least 75% of controlled computing capacity in approved locations. U.S.-headquartered entities were also expected to maintain at least 50% of controlled capacity domestically and no more than 7% in a single non-preferred destination.
Although BIS rescinded the rule in May 2025, stricter semiconductor export-control measures remained an important compliance issue. Higher licensing, customer-screening, and routing costs can reduce high-end accelerator sales and may create around a 1.3% drag on the market’s baseline CAGR.
Challenges
| Challenge | (~) % CAGR | Geographic Relevance | Mitigation Horizon |
|---|---|---|---|
| Advanced packaging concentration | -1.1% | East Asia, North America, Europe | Long term (4 years or more) |
| Memory bandwidth constraints | -0.8% | Global | Medium term (2 to 4 years) |
| Engineering talent scarcity | -0.6% | Global | Long term (4 years or more) |
| Red Sea logistics volatility | -0.4% | Asia-Europe trade lanes | Short term (2 years or less) |
| Thermal design complexity | -0.3% | Global | Medium term (2 to 4 years) |
Advanced packaging concentration
Advanced packaging concentration remains a major operational challenge because high-performance GPUs and processors rely on 2.5D and 3D packaging, high-bandwidth memory, advanced substrates, and specialised assembly capacity. Semiconductor fabrication can take up to 90 days, while packaging and testing add further production time and supply-chain dependencies.
Logistics disruptions can increase this pressure. Red Sea rerouting reduced effective global container-shipping capacity by about 9% and added roughly 12 days to Shanghai–Rotterdam voyages.
The global industrial-robot stock reached 4.6 million units in 2024, up 9%, increasing demand for advanced processing components. Without dual sourcing, reserved packaging capacity, thermal redesign, and buffer inventory, this challenge could create around a 1.1% drag on maximum CAGR potential.
Opportunities
| Opportunity | (~) % CAGR | Geographic Relevance | Execution Window |
|---|---|---|---|
| Sovereign AI infrastructure | +1.6% | Middle East, Europe, Asia-Pacific | Medium term (2 to 4 years) |
| Edge AI monetisation | +1.2% | Global | Medium term (2 to 4 years) |
| Chiplet platform licensing | +0.9% | North America, Europe, Asia-Pacific | Long term (4 years or more) |
| Energy-efficient accelerator replacement | +0.8% | Global | Medium term (2 to 4 years) |
| Healthcare imaging acceleration | +0.5% | North America, Europe, Asia-Pacific | Long term (4 years or more) |
Sovereign AI infrastructure
Sovereign AI infrastructure is emerging as a future growth opportunity as governments focus more on data security, local hosting, and national AI capabilities. Countries representing more than 40% of global GDP have introduced national AI strategies.
In the U.S., the CHIPS and Science Act provides USD 52.7 billion for semiconductor manufacturing, research, and workforce development, showing strong public support for domestic computing ecosystems. Demand for locally hosted AI platforms, secure inference, and national research infrastructure could create new opportunities for processor and GPU suppliers.
Sovereign deployments supported by local system integration, capacity agreements, and software services could improve platform gross margins by an estimated 3% to 6% compared with hardware-only sales. This opportunity could provide around 1.6% potential CAGR upside above the market’s 7.0% baseline CAGR.
Key Players Analysis
The Microprocessor and GPU Market is led by a strong Tier-1 group including NVIDIA, Intel, AMD, Qualcomm, Samsung Electronics, Broadcom, Apple, and MediaTek. NVIDIA holds a leading position in AI GPUs and accelerated data-centre computing. Its fiscal 2026 revenue reached USD 215.9 billion, increasing 65% year on year, while Compute & Networking revenue reached USD 193.5 billion.
The company spent USD 18.5 billion on R&D, equal to around 8.6% of revenue, supporting Blackwell GPUs, networking products, and AI software. NVIDIA is also estimated to hold more than 70% of the data-centre GPU segment. Intel remains a major supplier of PC and server CPUs, with USD 52.9 billion in 2025 revenue, USD 13.8 billion in R&D spending, and USD 14.6 billion in capital expenditure.
AMD remains a major challenger in x86 processors and AI GPUs. Its Data Center segment generated USD 16.6 billion in 2025, increasing 32%, supported by EPYC CPUs and Instinct MI350 GPUs. Fourth-quarter data-centre revenue reached USD 5.4 billion, up 39%. Qualcomm, MediaTek, Apple, and Samsung remain important in mobile processors, while Broadcom focuses on networking silicon and custom AI accelerators.
Texas Instruments serves embedded and industrial applications. IBM and Arm also influence competition through specialised computing and processor architecture. Market success increasingly depends on software support, advanced packaging, memory bandwidth, foundry access, and long-term supply agreements.
Top Key Players in the Market
- Intel Corporation
- NVIDIA Corporation
- AMD (Advanced Micro Devices)
- Qualcomm Incorporated
- Samsung Electronics
- Broadcom Inc.
- IBM Corporation
- MediaTek Inc.
- ARM Limited (SoftBank Group)
- Texas Instruments
- Apple Inc.
Recent Developments
- In March 2025, AMD completed its acquisition of ZT Systems, strengthening its position in large-scale AI and data-centre infrastructure. AMD paid USD 3.37 billion in cash and issued 8,335,849 shares, with additional consideration of up to USD 300 million in cash and 740,961 shares subject to certain conditions.
- In September 2025, NVIDIA and Intel announced a multi-generation partnership for AI infrastructure and personal computing. NVIDIA agreed to invest USD 5.0 billion in Intel common stock at USD 23.28 per share. Intel later disclosed that the USD 5.0 billion private placement was completed in December 2025.
Report Scope
| Report Features | Description |
|---|---|
| Market Value (2025) | USD 130.7 Billion |
| Forecast Revenue (2035) | USD 257.2 Billion |
| CAGR (2026-2035) | 7.0% |
| Base Year for Estimation | 2025 |
| Historic Period | 2020-2024 |
| Forecast Period | 2026-2035 |
| Report Coverage | Revenue Forecast, Market Dynamics, Competitive Landscape, Recent Developments |
| Segments Covered | By Type (Microprocessor, GPU), By Architecture (x86, ARM, Others), By Application (Consumer Electronics, Automotive, Healthcare, Industrial, Aerospace and Defense, Others) |
| Regional Analysis | North America – US, Canada; Europe – Germany, France, The UK, Spain, Italy, Rest of Europe; Asia Pacific – China, Japan, South Korea, India, Australia, Singapore, Rest of APAC; Latin America – Brazil, Mexico, Rest of Latin America; Middle East & Africa – GCC, South Africa, Rest of MEA |
| Competitive Landscape | Intel Corporation, NVIDIA Corporation, AMD (Advanced Micro Devices), Qualcomm Incorporated, Samsung Electronics, Broadcom Inc., IBM Corporation, MediaTek Inc., ARM Limited (SoftBank Group), Texas Instruments, Apple Inc. |
| Customization Scope | Customization for segments, region/country-level will be provided. Moreover, additional customization can be done based on the requirements. |
| Purchase Options | We have three licenses to opt for: Single User License, Multi-User License (Up to 5 Users), Corporate Use License (Unlimited Users and Printable PDF) |





























